MySQL performance is easiest to reason about as a latency budget. A query that takes 40 milliseconds spent those milliseconds somewhere: waiting for a connection thread, in the parser and optimizer, in the buffer pool, on the I/O subsystem, in the redo log at commit, or on a replica that has to apply it before the application reads it back. Each stage has an instrument that says how much it took, and each stage has a small number of ways to go wrong.
This page walks that budget from the client to the replica, stage by stage. For each stage it names the Performance Schema or status counter that measures it, the failure pattern we see most often across the MySQL estates MinervaDB supports, and the archive posts that treat it in depth. It assumes the reader operates MySQL for a living and wants the numbers, not the introduction.
The archive it introduces runs to more than 150 posts on MySQL performance: EXPLAIN and the optimizer, InnoDB buffer pool and I/O tuning, redo logging and commit latency, locking and thread contention, Group Replication and InnoDB Cluster write throughput, workload statistics, and the release-by-release changes through MySQL 8.0, 8.4 LTS, 9.x and the 26.7 line.
Stage 1 of the MySQL performance budget: getting a thread
The first line of the MySQL performance budget is spent before a query is parsed: it needs a thread, and on the default one-thread-per-connection model that is cheap until it is not. Connection storms, short-lived connections from pooled application tiers, and thousands of idle sessions each cost memory and scheduler time, and the symptom is latency that rises with connection count rather than with query cost.
-- thread cache effectiveness: misses per connection should be close to zero on a steady workload
SHOW GLOBAL STATUS WHERE Variable_name IN
  ('Connections', 'Threads_created', 'Threads_cached', 'Threads_connected', 'Threads_running',
   'Max_used_connections', 'Aborted_connects');

-- where connections are waiting right now, by wait event
SELECT event_name, count_star, sum_timer_wait / 1e12 AS wait_seconds
FROM   performance_schema.events_waits_summary_global_by_event_name
WHERE  event_name LIKE 'wait/synch/mutex/sql/LOCK_thread%'
   OR  event_name LIKE 'wait/io/socket/%'
ORDER  BY sum_timer_wait DESC
LIMIT  10;
The MySQL thread-based architecture post is the model, the MySQL thread cache performance post sets thread_cache_size from Threads_created rather than from folklore, and the fine-tuning InnoDB thread concurrency post covers the admission control that stops a thousand runnable threads from thrashing sixteen cores. The thread pool plugin moving to Community Edition in MySQL 26.7 post covers the change that makes the thread pool an option on every edition, and when its fixed thread groups beat the default model.
Two posts cover the connection-level faults that look like performance problems: MySQL error 1130, host is not allowed to connect and the JDBC abandoned connection cleanup thread that keeps application servers holding sessions open long after the request finished.
Stage 2: the optimizer, and reading what it decided
The optimizer’s own time is a small line in the MySQL performance budget; the cost of its decisions is not. A wrong join order or a missed index turns a 2 millisecond query into a 2 second one, and the only way to see the decision is EXPLAIN in its modern forms: EXPLAIN FORMAT=TREE for the shape, EXPLAIN ANALYZE for measured rows and timings per node.
EXPLAIN ANALYZE
SELECT o.order_id, c.email, SUM(oi.qty * oi.unit_price) AS total
FROM   orders o
JOIN   customers c   ON c.customer_id = o.customer_id
JOIN   order_items oi ON oi.order_id = o.order_id
WHERE  o.created_at >= NOW() - INTERVAL 7 DAY
  AND  c.region = 'EMEA'
GROUP  BY o.order_id, c.email\G

-- read each node as: (cost=.. rows=estimated) (actual time=first..last rows=actual loops=n)
-- estimated rows off by 10x or more on a table scan node: statistics, not the optimizer
-- Nested loop inner join with a large "loops=" on the inner table: the join order or the index is wrong
-- Hash join appearing where an index join was expected: the join column has no usable index
The MySQL query optimization and EXPLAIN complete guide is the starting point, mastering MySQL EXPLAIN format covers the tree and JSON output, and the join-specific posts follow: optimizing join methods and join orders, join operations in MySQL 8, MySQL INNER JOIN, and complex joins and the effect of multicolumn indexes on execution plans.
Index design for the optimizer is its own thread in the archive: multi-column indexing, indexing and function usage (a function on the indexed column defeats the index unless it is a functional index), adaptive hash indexing, enable or disable, and rebuild versus reorganize. The seek and scan costs and statistics management post explains the cost constants and innodb_stats_persistent_sample_pages behind the estimates, and using workload statistics effectively turns Performance Schema digests into the list of queries worth this attention.
Stage 3: the buffer pool, where MySQL performance is won or lost
Every InnoDB read goes through the buffer pool, and the ratio of logical reads to physical reads is the single number that predicts whether a workload is CPU-bound or disk-bound. A hit rate that looks fine on average can hide a working set that does not fit at the daily peak, which shows as a burst of Innodb_buffer_pool_reads at the same hour every day.
-- buffer pool pressure, sampled twice sixty seconds apart and differenced
SHOW GLOBAL STATUS WHERE Variable_name IN
  ('Innodb_buffer_pool_read_requests', 'Innodb_buffer_pool_reads',
   'Innodb_buffer_pool_pages_free', 'Innodb_buffer_pool_pages_dirty',
   'Innodb_buffer_pool_wait_free', 'Innodb_buffer_pool_pages_flushed');

-- which tables own the buffer pool right now
SELECT object_schema, object_name,
       COUNT(*) AS pages,
       ROUND(COUNT(*) * 16 / 1024, 1) AS approx_mb,
       SUM(is_old = 'YES') AS old_sublist_pages
FROM   information_schema.innodb_buffer_page
WHERE  object_schema NOT IN ('mysql', 'sys')
GROUP  BY object_schema, object_name
ORDER  BY pages DESC
LIMIT  15;
The InnoDB performance optimization complete guide sets the pool size, instances and the flushing parameters together, because they interact; optimizing the InnoDB buffer pool for write performance covers the dirty-page side, where innodb_max_dirty_pages_pct and adaptive flushing decide whether a checkpoint stall lands inside a user transaction. Innodb_buffer_pool_wait_free above zero is the direct evidence of that stall.
Memory beyond the pool is covered in query memory consumption per schema, which uses memory_summary_by_thread_by_event_name to find the sessions holding the memory that the pool would rather have, and in transparent huge pages and MySQL, the operating-system setting that causes latency spikes on large-memory hosts until it is disabled.
Stage 4: the I/O subsystem and the numbers that size it
When the buffer pool misses, the MySQL performance budget moves to disk, and InnoDB’s background I/O has to keep pace with the foreground. The tuning surface is small and often set wrong: innodb_io_capacity and innodb_io_capacity_max tell InnoDB how many IOPS it may spend on flushing, and both a value far below the storage’s real capacity and a value far above it hurt, one by letting dirty pages pile up, the other by starving user reads.
The innodb_io_capacity and innodb_io_capacity_max tuning post sets them from measured device capability, forecasting MySQL IOPS projects the demand ahead of a capacity decision, and MySQL I/O subsystem read analysis separates read I/O caused by buffer pool misses from read I/O caused by sorts and temporary tables spilling to disk. The I/O thread model is in InnoDB I/O threads in MySQL 8 and MySQL InnoDB I/O threads for performance.
When the counters do not explain the latency, the archive goes below MySQL: MySQL query performance with strace and reading strace output for MySQL performance attach to the process and see the system calls, and hidden interrupt CPU usage in MySQL finds the softirq time that top attributes to nothing. CPU affinity and priority management is the follow-up for NUMA hosts.
Stage 5: commit, redo and the cost of durability
A write transaction is not finished until its redo log records are on durable storage, and the parameters that govern that step trade durability for latency in a way that should be a deliberate decision, not a default. innodb_flush_log_at_trx_commit = 1 with sync_binlog = 1 is the durable configuration; anything else is a documented risk accepted for throughput.
-- redo pressure: log waits mean the log buffer filled before it could be written
SHOW GLOBAL STATUS WHERE Variable_name IN
  ('Innodb_log_waits', 'Innodb_log_writes', 'Innodb_os_log_fsyncs', 'Innodb_os_log_written');

-- commit-path waits by event, MySQL 8.0+
SELECT event_name, count_star, ROUND(avg_timer_wait / 1e9, 3) AS avg_ms
FROM   performance_schema.events_waits_summary_global_by_event_name
WHERE  event_name IN ('wait/io/file/innodb/innodb_log_file',
                      'wait/synch/mutex/innodb/log_sys_mutex',
                      'wait/io/file/sql/binlog')
ORDER  BY count_star DESC;
The log file synchronization in InnoDB post is the mechanics, and the redo redesign is covered in InnoDB parallel redo logs in MySQL 8 and implementing parallel redo logging, which explain why since MySQL 8.0 the log writer and flusher are separate threads and what that does to commit latency under concurrency.
Transaction semantics that affect the commit path are in commit, rollback and savepoint in InnoDB, rolling back a transaction from the application, and the two isolation-level posts, MySQL transaction isolation levels deep dive and transaction isolation levels, since REPEATABLE READ’s gap locks are a commit-latency problem as much as a correctness one.
Schema changes are a special case of the write path: MySQL instant DDL covers the ALGORITHM=INSTANT operations that change metadata only, and the ones that still rebuild the table and should be done with an online schema-change tool.
Stage 6: locks and thread contention
The stage of MySQL performance that produces the worst tail latency is waiting on another session. Row locks, gap locks, metadata locks and InnoDB’s internal mutexes all show up as time in which the query did no work, and Performance Schema in MySQL 8.0 makes every one of them visible if the instruments are on.
-- who is blocking whom, MySQL 8.0+
SELECT r.trx_id AS waiting_trx, r.trx_mysql_thread_id AS waiting_thread,
       b.trx_id AS blocking_trx, b.trx_mysql_thread_id AS blocking_thread,
       TIMESTAMPDIFF(SECOND, r.trx_wait_started, NOW()) AS waited_s,
       LEFT(r.trx_query, 80) AS waiting_query
FROM   performance_schema.data_lock_waits w
JOIN   information_schema.innodb_trx b ON b.trx_id = w.blocking_engine_transaction_id
JOIN   information_schema.innodb_trx r ON r.trx_id = w.requesting_engine_transaction_id
ORDER  BY waited_s DESC;
The InnoDB locking mechanisms from flush locks to deadlocks post is the taxonomy. leaf block contention in InnoDB covers the index page hot spot that monotonically increasing keys create under high insert rates, and diagnosing thread contention with Performance Schema covers the mutex and rwlock waits that appear as high CPU with low throughput. Two posts treat waits as a first-class metric: the impact of queue waits and troubleshooting signal waits.
Stage 7: replication, where the budget leaves the server
On a replicated topology MySQL performance is measured end to end: the write is not usable until the replica has applied it, and on Group Replication it is not committed until the group has certified it. Both add to the budget, and both have their own counters. The archive covers this layer thoroughly because it is where MinervaDB does much of its production work.
-- Group Replication: certification and apply backlog per member
SELECT member_id,
       count_transactions_in_queue          AS certify_queue,
       count_transactions_remote_in_applier_queue AS apply_queue,
       count_conflicts_detected,
       transactions_committed_all_members
FROM   performance_schema.replication_group_member_stats;

-- classic async replication: lag as the applier sees it, MySQL 8.0+
SELECT channel_name, service_state, last_applied_transaction,
       last_applied_transaction_end_apply_timestamp
FROM   performance_schema.replication_applier_status_by_worker;
Start with MySQL Group Replication performance, troubleshooting Group Replication performance and monitoring Group Replication; then the write-path posts, write performance in MySQL 8 Group Replication and InnoDB Cluster write performance, and the topology posts, InnoDB Cluster for horizontal scaling and failover and recovery in InnoDB Cluster and ClusterSet. key enhancements in MySQL 8 Group Replication tracks the flow-control and consistency options by release, and Group Replication versus MariaDB Galera Cluster is the comparison for estates that run both.
For classic replication, MySQL GTID replication and binlog file inconsistencies cover the failures that turn into lag, and optimizing Azure Database for MySQL covers the managed-service version of the same questions, where the replica and the flush parameters are set by the provider.
The MySQL performance budget on one page
The table is the whole walk compressed: the stage, the counter that measures it, and the pattern that most often explains a bad number. Thresholds are the starting points we use on a first health check and are illustrative until calibrated on the workload.
| Stage | Measure with | Bad number looks like | Usual cause |
|---|---|---|---|
| 1. Thread | Threads_created vs Connections; Threads_running | Threads_created rising steadily; Threads_running > cores under load | thread_cache_size too small; no pooling; no admission control |
| 2. Optimizer | EXPLAIN ANALYZE; events_statements_summary_by_digest | estimated rows 10x off; loops= in the thousands on an inner table | stale statistics; missing multicolumn index; join order |
| 3. Buffer pool | Innodb_buffer_pool_reads / read_requests; wait_free | miss ratio above 1 percent at peak; wait_free > 0 | pool too small for the working set; flushing behind |
| 4. I/O | innodb_io_capacity vs device IOPS; pages_flushed rate | flushing lagging dirty-page growth; read latency spikes | io_capacity mis-set; sorts spilling; THP |
| 5. Commit | Innodb_log_waits; innodb_log_file and binlog waits | log_waits > 0; avg commit wait in milliseconds | log buffer too small; slow fsync; sync_binlog on slow disk |
| 6. Locks | data_lock_waits; mutex and rwlock wait summaries | waited_s in seconds; high CPU with low throughput | long transactions; gap locks; hot index leaf |
| 7. Replication | replication_group_member_stats; applier status | certify or apply queue growing; lag in seconds | large transactions; single-threaded apply; flow control |
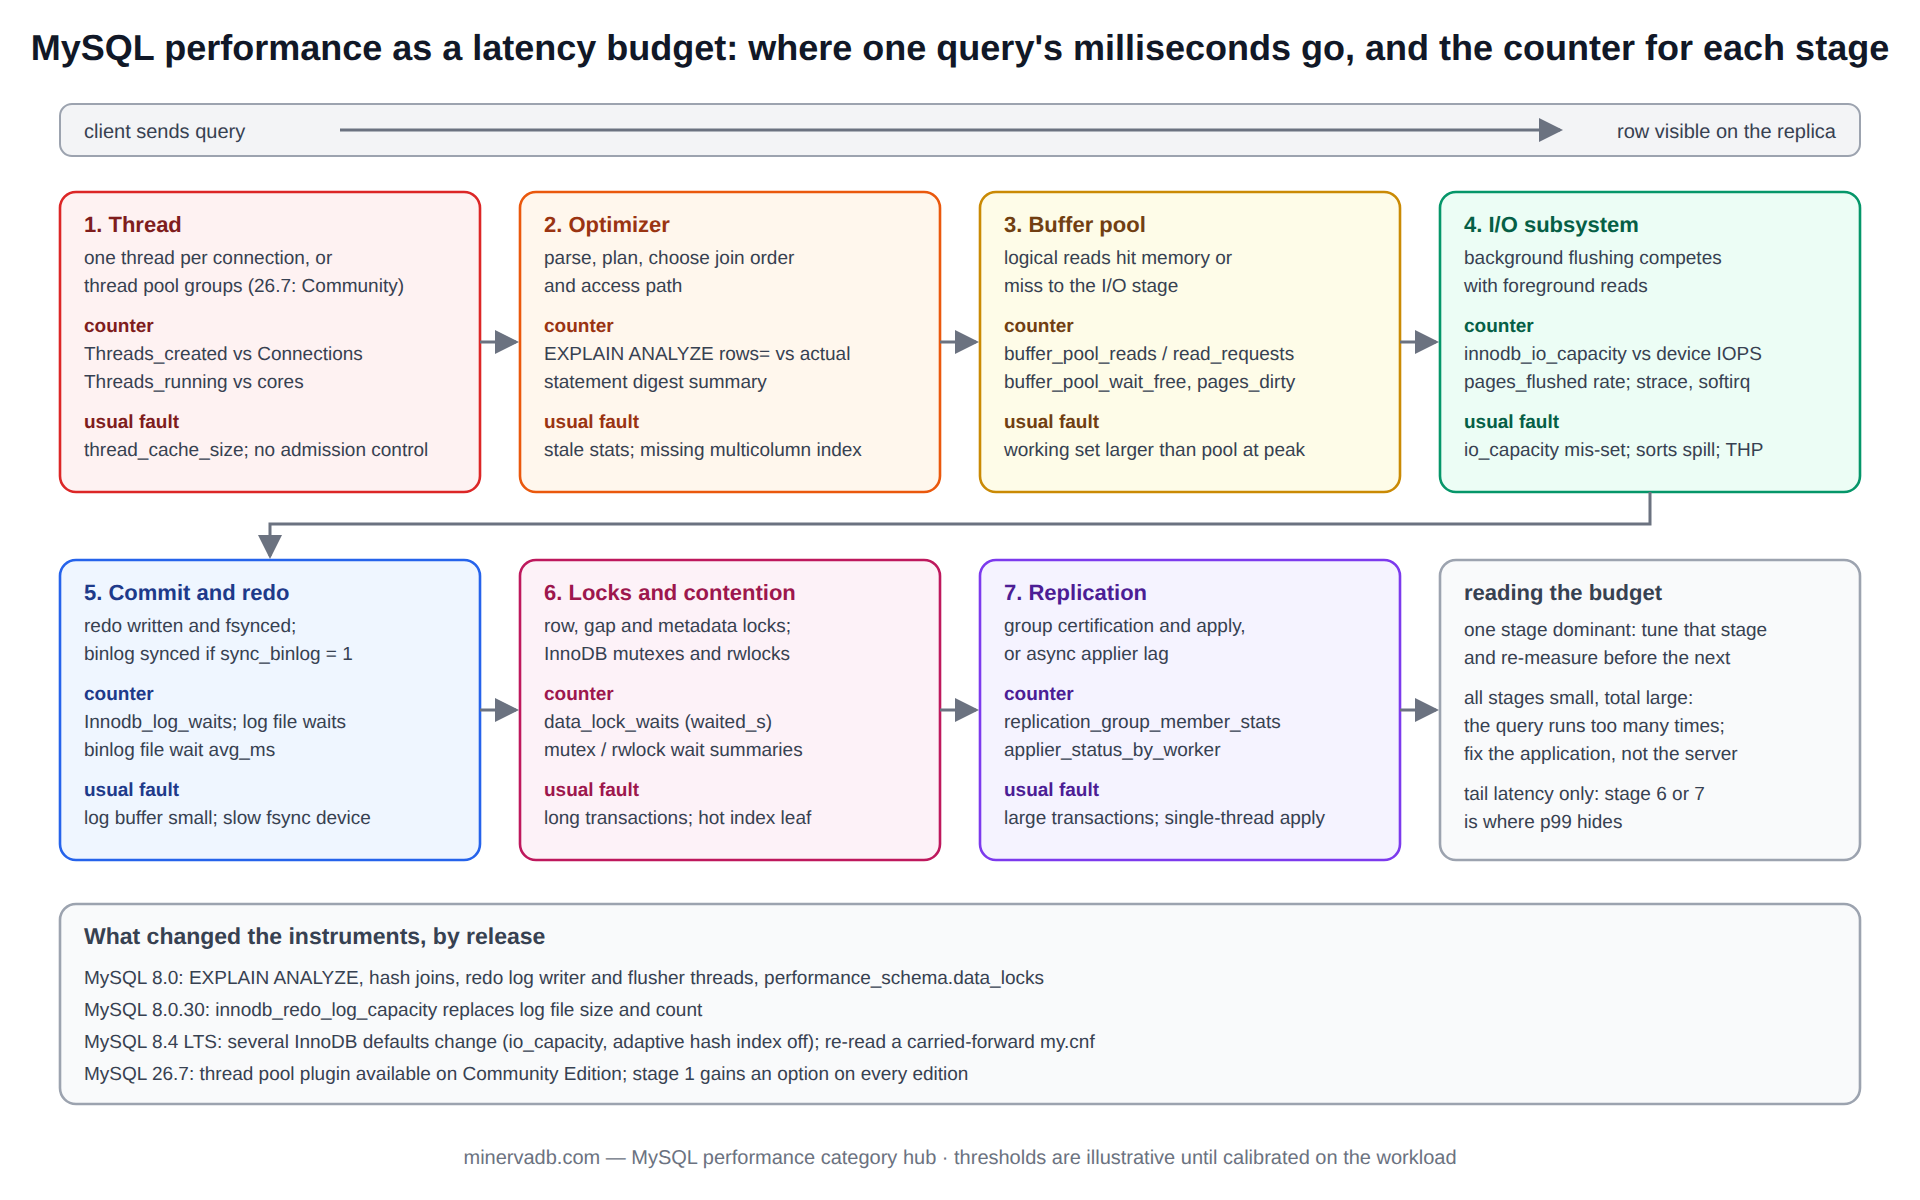
MySQL performance by release
The budget is the same on every release; the instruments and the defaults are not. Version notes, pinned so they can be checked against the release notes: since MySQL 8.0, EXPLAIN ANALYZE, hash joins, the redesigned redo log with separate writer and flusher threads, and the performance_schema.data_locks tables replace the older innodb_locks views. Since MySQL 8.0.30, redo log capacity is set with innodb_redo_log_capacity rather than file size and count.
MySQL 8.4 LTS changes several InnoDB defaults, including innodb_buffer_pool_in_core_file, innodb_io_capacity and the adaptive hash index being off by default, which is why a configuration carried forward from 8.0 needs to be re-read rather than copied.
The MySQL 26.7 and 9.7 LTS performance, scalability and high availability post covers the current line’s changes, and the MySQL 8 for enhanced write performance and custom sequences in MySQL 8 posts cover two write-path features whose behaviour is release-specific. Before relying on any release note in production, test on a copy with production data and a production-shaped workload; defaults that improve one workload regress another.
Running MySQL performance as a practice
The stages above are a MySQL performance diagnosis. The archive also covers the routine that keeps the diagnosis from being needed: the MySQL health check guide with scripts, MySQL performance troubleshooting best practices, troubleshooting ad-hoc query performance, troubleshooting query latency and index usage, and proactive monitoring and anomaly detection.
Two operational posts stop the observability from becoming the problem: slow query log management with logrotate and automated backup cleanup, since a full disk is the fastest way to turn every stage red at once. statistical analysis of query throughput capacity is the capacity-planning method, and five tips for effective MySQL support is the shortest statement of how we run the support side.
Every recommendation on this page carries the same two conditions we attach to customer work: test it on a copy before it reaches production, and keep a robust DR posture, because a durability parameter changed for throughput is a decision about how much data a crash may lose.
Where this MySQL performance archive sits
This archive is the tuning layer of the MySQL collection on minervadb.com. The MySQL archive is the broad set, the MySQL internals archive and InnoDB archive go beneath the counters to the structures that produce them, and the MySQL troubleshooting archive is organised by symptom rather than by stage. The authoritative reference for the optimizer and the InnoDB parameters named here is the MySQL Reference Manual chapter on optimization.
For a performance audit that walks all seven stages against a live workload, or 24×7 support for an estate where the budget is measured in an SLA, the MinervaDB MySQL consulting practice does this work with the counters quoted for every finding and the rollback written before the change.