Why MariaDB Performance Monitoring Fails Without Baselines
MariaDB performance monitoring is what separates a diagnosis from a guess. Most MariaDB incidents are never actually diagnosed. When a production cluster degrades at 02:00, the on-call DBA reaches forSHOW PROCESSLIST, sees a wall of queries, kills the longest one, and declares victory.
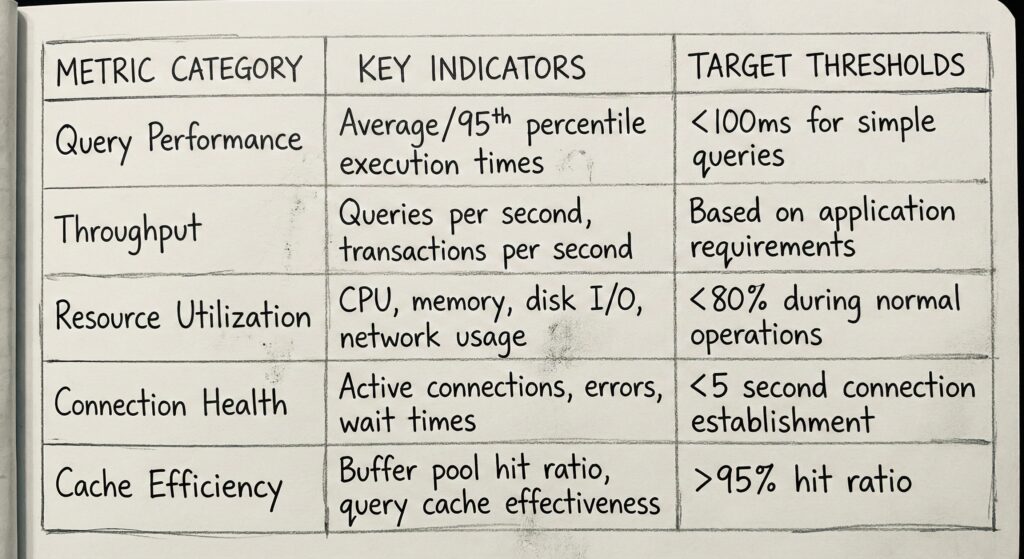
The Consolidated MariaDB Performance Monitoring Script
The following MariaDB performance monitoring script produces a single result set covering all twenty metrics, including six derived ratios. This is the MariaDB performance monitoring baseline query we deploy first on every engagement. It reads only frominformation_schema.GLOBAL_STATUS and information_schema.GLOBAL_VARIABLES, so it runs unmodified on MariaDB 10.4, 10.5, 10.6, 10.11 and 11.x.
-- ---------------------------------------------------------------------
-- MinervaDB :: MariaDB 20-Metric Diagnostic Snapshot
-- Compatible: MariaDB 10.4 / 10.5 / 10.6 / 10.11 / 11.x
-- Privilege : PROCESS (or equivalent) to read I_S.GLOBAL_STATUS
-- ---------------------------------------------------------------------

-- ---------- Raw status counters ----------
SET @UPTIME          = (SELECT VARIABLE_VALUE FROM information_schema.GLOBAL_STATUS WHERE VARIABLE_NAME = 'UPTIME');
SET @THR_CONNECTED   = (SELECT VARIABLE_VALUE FROM information_schema.GLOBAL_STATUS WHERE VARIABLE_NAME = 'THREADS_CONNECTED');
SET @THR_RUNNING     = (SELECT VARIABLE_VALUE FROM information_schema.GLOBAL_STATUS WHERE VARIABLE_NAME = 'THREADS_RUNNING');
SET @MAX_USED_CONN   = (SELECT VARIABLE_VALUE FROM information_schema.GLOBAL_STATUS WHERE VARIABLE_NAME = 'MAX_USED_CONNECTIONS');
SET @ABORTED_CONN    = (SELECT VARIABLE_VALUE FROM information_schema.GLOBAL_STATUS WHERE VARIABLE_NAME = 'ABORTED_CONNECTS');
SET @QUESTIONS       = (SELECT VARIABLE_VALUE FROM information_schema.GLOBAL_STATUS WHERE VARIABLE_NAME = 'QUESTIONS');
SET @COM_SELECT      = (SELECT VARIABLE_VALUE FROM information_schema.GLOBAL_STATUS WHERE VARIABLE_NAME = 'COM_SELECT');
SET @COM_INSERT      = (SELECT VARIABLE_VALUE FROM information_schema.GLOBAL_STATUS WHERE VARIABLE_NAME = 'COM_INSERT');
SET @COM_UPDATE      = (SELECT VARIABLE_VALUE FROM information_schema.GLOBAL_STATUS WHERE VARIABLE_NAME = 'COM_UPDATE');
SET @COM_DELETE      = (SELECT VARIABLE_VALUE FROM information_schema.GLOBAL_STATUS WHERE VARIABLE_NAME = 'COM_DELETE');
SET @SLOW_QUERIES    = (SELECT VARIABLE_VALUE FROM information_schema.GLOBAL_STATUS WHERE VARIABLE_NAME = 'SLOW_QUERIES');
SET @BP_READ_REQ     = (SELECT VARIABLE_VALUE FROM information_schema.GLOBAL_STATUS WHERE VARIABLE_NAME = 'INNODB_BUFFER_POOL_READ_REQUESTS');
SET @BP_READS        = (SELECT VARIABLE_VALUE FROM information_schema.GLOBAL_STATUS WHERE VARIABLE_NAME = 'INNODB_BUFFER_POOL_READS');
SET @BP_PG_DIRTY     = (SELECT VARIABLE_VALUE FROM information_schema.GLOBAL_STATUS WHERE VARIABLE_NAME = 'INNODB_BUFFER_POOL_PAGES_DIRTY');
SET @BP_PG_TOTAL     = (SELECT VARIABLE_VALUE FROM information_schema.GLOBAL_STATUS WHERE VARIABLE_NAME = 'INNODB_BUFFER_POOL_PAGES_TOTAL');
SET @BP_WAIT_FREE    = (SELECT VARIABLE_VALUE FROM information_schema.GLOBAL_STATUS WHERE VARIABLE_NAME = 'INNODB_BUFFER_POOL_WAIT_FREE');
SET @LOG_WAITS       = (SELECT VARIABLE_VALUE FROM information_schema.GLOBAL_STATUS WHERE VARIABLE_NAME = 'INNODB_LOG_WAITS');
SET @ROW_LK_CURRENT  = (SELECT VARIABLE_VALUE FROM information_schema.GLOBAL_STATUS WHERE VARIABLE_NAME = 'INNODB_ROW_LOCK_CURRENT_WAITS');
SET @ROW_LK_AVG      = (SELECT VARIABLE_VALUE FROM information_schema.GLOBAL_STATUS WHERE VARIABLE_NAME = 'INNODB_ROW_LOCK_TIME_AVG');
SET @DEADLOCKS       = (SELECT VARIABLE_VALUE FROM information_schema.GLOBAL_STATUS WHERE VARIABLE_NAME = 'INNODB_DEADLOCKS');
SET @TMP_TABLES      = (SELECT VARIABLE_VALUE FROM information_schema.GLOBAL_STATUS WHERE VARIABLE_NAME = 'CREATED_TMP_TABLES');
SET @TMP_DISK        = (SELECT VARIABLE_VALUE FROM information_schema.GLOBAL_STATUS WHERE VARIABLE_NAME = 'CREATED_TMP_DISK_TABLES');
SET @SORT_MERGE      = (SELECT VARIABLE_VALUE FROM information_schema.GLOBAL_STATUS WHERE VARIABLE_NAME = 'SORT_MERGE_PASSES');
SET @FULL_JOIN       = (SELECT VARIABLE_VALUE FROM information_schema.GLOBAL_STATUS WHERE VARIABLE_NAME = 'SELECT_FULL_JOIN');
SET @OPENED_TABLES   = (SELECT VARIABLE_VALUE FROM information_schema.GLOBAL_STATUS WHERE VARIABLE_NAME = 'OPENED_TABLES');
SET @OPEN_TABLES     = (SELECT VARIABLE_VALUE FROM information_schema.GLOBAL_STATUS WHERE VARIABLE_NAME = 'OPEN_TABLES');
SET @BLOG_CACHE_USE  = (SELECT VARIABLE_VALUE FROM information_schema.GLOBAL_STATUS WHERE VARIABLE_NAME = 'BINLOG_CACHE_USE');
SET @BLOG_CACHE_DISK = (SELECT VARIABLE_VALUE FROM information_schema.GLOBAL_STATUS WHERE VARIABLE_NAME = 'BINLOG_CACHE_DISK_USE');
SET @BLOG_COMMITS    = (SELECT VARIABLE_VALUE FROM information_schema.GLOBAL_STATUS WHERE VARIABLE_NAME = 'BINLOG_COMMITS');
SET @BLOG_GRP_COMMIT = (SELECT VARIABLE_VALUE FROM information_schema.GLOBAL_STATUS WHERE VARIABLE_NAME = 'BINLOG_GROUP_COMMITS');

-- ---------- Configuration variables ----------
SET @MAX_CONN        = (SELECT VARIABLE_VALUE FROM information_schema.GLOBAL_VARIABLES WHERE VARIABLE_NAME = 'MAX_CONNECTIONS');
SET @TBL_OPEN_CACHE  = (SELECT VARIABLE_VALUE FROM information_schema.GLOBAL_VARIABLES WHERE VARIABLE_NAME = 'TABLE_OPEN_CACHE');
SET @LONG_QUERY_TIME = (SELECT VARIABLE_VALUE FROM information_schema.GLOBAL_VARIABLES WHERE VARIABLE_NAME = 'LONG_QUERY_TIME');

-- ---------- Unified diagnostic output ----------
SELECT 'A. Connections' AS section, 'Threads_connected' AS metric,
       CAST(@THR_CONNECTED AS CHAR) AS value, 'below 80 pct of max_connections' AS healthy_target
UNION ALL
SELECT 'A. Connections', 'Threads_running',
       CAST(@THR_RUNNING AS CHAR), 'at or below CPU core count'
UNION ALL
SELECT 'A. Connections', 'Connection Usage pct',
       CAST(ROUND(100 * @MAX_USED_CONN / NULLIF(@MAX_CONN, 0), 2) AS CHAR), 'below 80 pct'
UNION ALL
SELECT 'A. Connections', 'Aborted_connects',
       CAST(@ABORTED_CONN AS CHAR), 'flat delta, near zero'
UNION ALL
SELECT 'B. Throughput', 'Questions (QPS avg since start)',
       CAST(ROUND(@QUESTIONS / NULLIF(@UPTIME, 0), 2) AS CHAR), 'stable vs baseline'
UNION ALL
SELECT 'B. Throughput', 'Read/Write Mix (SELECT pct)',
       CAST(ROUND(100 * @COM_SELECT /
            NULLIF(@COM_SELECT + @COM_INSERT + @COM_UPDATE + @COM_DELETE, 0), 2) AS CHAR),
       'workload dependent, watch for drift'
UNION ALL
SELECT 'B. Throughput', CONCAT('Slow Query Ratio pct (long_query_time=', @LONG_QUERY_TIME, ')'),
       CAST(ROUND(100 * @SLOW_QUERIES / NULLIF(@QUESTIONS, 0), 4) AS CHAR), 'below 0.1 pct'
UNION ALL
SELECT 'C. InnoDB Buffer Pool', 'Buffer Pool Hit Ratio pct',
       CAST(ROUND(100 * (1 - (@BP_READS / NULLIF(@BP_READ_REQ, 0))), 4) AS CHAR), '99.9 pct or higher'
UNION ALL
SELECT 'C. InnoDB Buffer Pool', 'Dirty Pages pct',
       CAST(ROUND(100 * @BP_PG_DIRTY / NULLIF(@BP_PG_TOTAL, 0), 2) AS CHAR), 'stable, below 40 pct'
UNION ALL
SELECT 'C. InnoDB Buffer Pool', 'Innodb_buffer_pool_wait_free',
       CAST(@BP_WAIT_FREE AS CHAR), 'zero'
UNION ALL
SELECT 'C. InnoDB Buffer Pool', 'Innodb_log_waits',
       CAST(@LOG_WAITS AS CHAR), 'zero'
UNION ALL
SELECT 'D. Locking', 'Innodb_row_lock_current_waits',
       CAST(@ROW_LK_CURRENT AS CHAR), 'zero to one, transient'
UNION ALL
SELECT 'D. Locking', 'Innodb_row_lock_time_avg (ms)',
       CAST(@ROW_LK_AVG AS CHAR), 'below 100 ms'
UNION ALL
SELECT 'D. Locking', 'Innodb_deadlocks',
       CAST(@DEADLOCKS AS CHAR), 'single digits per day'
UNION ALL
SELECT 'E. Temp / Sort / Index', 'Disk Temp Table pct',
       CAST(ROUND(100 * @TMP_DISK / NULLIF(@TMP_TABLES, 0), 2) AS CHAR), 'below 10 pct'
UNION ALL
SELECT 'E. Temp / Sort / Index', 'Sort_merge_passes',
       CAST(@SORT_MERGE AS CHAR), 'near zero delta'
UNION ALL
SELECT 'E. Temp / Sort / Index', 'Select_full_join',
       CAST(@FULL_JOIN AS CHAR), 'zero'
UNION ALL
SELECT 'E. Temp / Sort / Index', 'Table Cache Hit Ratio pct',
       CAST(ROUND(100 * @OPEN_TABLES / NULLIF(@OPENED_TABLES, 0), 2) AS CHAR), 'above 99 pct after warm-up'
UNION ALL
SELECT 'F. Binary Log', 'Binlog Cache Disk Use pct',
       CAST(ROUND(100 * @BLOG_CACHE_DISK /
            NULLIF(@BLOG_CACHE_USE + @BLOG_CACHE_DISK, 0), 2) AS CHAR), 'below 1 pct'
UNION ALL
SELECT 'F. Binary Log', 'Commits per Group Commit',
       CAST(ROUND(@BLOG_COMMITS / NULLIF(@BLOG_GRP_COMMIT, 0), 2) AS CHAR), 'above 1.0 under write load'
ORDER BY section, metric;
Run it twice, sixty seconds apart, and diff the counter rows — delta sampling is the foundation of accurate MariaDB performance monitoring; cumulative ratios only become actionable over a bounded interval. If you run MariaDB on cloud or containerised infrastructure, pair this with our notes on tuning MariaDB for cloud environments.
MariaDB Performance Monitoring: Connections and Threads (Metrics 1–4)
The first four counters answer one question: is the server already saturated at the front door, before a single query executes?1. Threads_connected
Measures: Open client connections, including idle sessions still holding a thread and its session buffers. Healthy: Flat under constant load, below 80% ofmax_connections.
Incident signature: Climbs from 200 to 1,500 in a minute while Threads_running stays low. That divergence means something downstream stalled and the pool is opening new sessions instead of reusing blocked ones.
Remediation: Cap application pool size at the source; set wait_timeout and interactive_timeout to 300 or lower. Raising max_connections is a stopgap — put MaxScale or ProxySQL in front for multiplexing.
2. Threads_running
Measures: Threads actively executing rather than sleeping. The real concurrency signal, and the one that tracks CPU saturation. Healthy: At or below CPU core count. Incident signature: Spikes to 300+ with CPU pinned — the thundering herd that follows a plan flip or a dropped index. Remediation: Usethread_handling=pool-of-threads with thread_pool_size equal to core count so excess concurrency queues instead of thrashing. Kill the runaway statement first, fix the plan second.
3. Connection Usage Percentage
Measures:Max_used_connections against max_connections — high-water mark versus configured ceiling.
Healthy: Below 80%, leaving headroom for monitoring and backup sessions.
Incident signature: 100%, with Connection_errors_max_connections incrementing. Once the ceiling is hit, even the DBA cannot log in.
Remediation: Raise max_connections only after confirming open_files_limit supports it, and configure extra_port so administrative access survives saturation.
4. Aborted_connects
Measures: Attempts that failed before authentication completed — bad credentials, handshake timeouts, TLS failures. Healthy: Near-zero delta between samples. Incident signature: Hundreds per minute, thenmax_connect_errors blocking a legitimate application host outright.
Remediation: Raise connect_timeout to 10–20s on congested networks, set skip_name_resolve=ON to kill reverse-DNS stalls, audit grants, and clear blocks with FLUSH HOSTS.
MariaDB Performance Monitoring: Query Throughput and Slow Queries (Metrics 5–7)
These three counters tell you whether work is arriving faster than the server can retire it.5. Questions (Queries Per Second)
Measures: Statements executed for clients, excluding internal and replicated statements. Healthy: Stable against the same hour on the same weekday — there is no universal good number, only your baseline. Incident signature: Three times normal QPS while business volume is flat — a retry storm or an ORM N+1 regression, not growth. Remediation: Correlate with theCom_* family to find which statement class exploded, throttle at the proxy, and push the fix into the application.
6. Read/Write Mix (Com_select vs Com_insert / Com_update / Com_delete)
Measures: Workload composition. Write share drives redo generation, purge load, and replication cost. Healthy: Consistent with the architecture you designed for. Incident signature:Com_delete jumps mid-day because a retention job slipped its window, inflating the InnoDB history list and stalling purge.
Remediation: Chunk bulk DML into 1,000–10,000 row batches, move purge jobs off-peak, and keep innodb_purge_threads at 4 or more on write-heavy systems.
7. Slow Query Ratio
Measures:Slow_queries as a share of Questions — statements exceeding long_query_time.
Healthy: Below 0.1%, with long_query_time at 1 second or lower. The 10-second default hides everything that matters.
Incident signature: A jump from 0.05% to 4% immediately after a deployment or a statistics refresh that changed plans.
Remediation: Set log_slow_verbosity='query_plan,explain' (see the MariaDB slow query log documentation), aggregate with pt-query-digest, and add covering indexes for the top two offenders. Run ANALYZE TABLE ... PERSISTENT FOR ALL before blaming the optimizer.
MariaDB Performance Monitoring: InnoDB Buffer Pool and Flushing (Metrics 8–11)
Buffer pool and flushing counters are the highest-value signals in MariaDB performance monitoring, because this is the boundary where memory pressure turns into disk latency.8. InnoDB Buffer Pool Hit Ratio
Measures: The most watched ratio in MariaDB performance monitoring — logical reads served from memory: one minusInnodb_buffer_pool_reads / Innodb_buffer_pool_read_requests.
Healthy: 99.9% or better for OLTP. The decimals matter — 99.0% can still mean thousands of physical reads per second.
Incident signature: Falls to 95% with Innodb_buffer_pool_reads climbing steeply. Either the working set outgrew RAM, or one full scan evicted the hot pages.
Remediation: Size innodb_buffer_pool_size at 60–75% of RAM on a dedicated host, as covered in our guide to InnoDB performance optimization and set innodb_old_blocks_time=1000 so scan pages do not promote into the young sublist. On 10.4/10.5 check innodb_buffer_pool_instances; it is obsolete from 10.6.
9. Dirty Page Percentage
Measures:Innodb_buffer_pool_pages_dirty against ..._pages_total — modified pages awaiting flush.
Healthy: Stable in the 10–40% band, well below innodb_max_dirty_pages_pct.
Incident signature: Pinned above 90% with checkpoint age near redo capacity. InnoDB enters furious flushing and throughput collapses into a sawtooth.
Remediation: Increase innodb_log_file_size to give the checkpoint room, set innodb_io_capacity and innodb_io_capacity_max to what the device sustains, and lower innodb_max_dirty_pages_pct_lwm to about 10 for continuous flushing.
10. Innodb_buffer_pool_wait_free
Measures: Times a thread waited for a clean page because none was available. Healthy: Zero. Not low — zero. Incident signature: Any sustained increase. Latency turns erratic while CPU and QPS look ordinary, because user threads are being forced to flush. Remediation: Raiseinnodb_io_capacity_max, add cleaner capacity on 10.4/10.5 via innodb_page_cleaners, enlarge the buffer pool, and confirm device latency with iostat -x first.
11. Innodb_log_waits
Measures: Waits caused by a full redo log buffer that had to be flushed before the transaction could continue. Healthy: Zero. Incident signature: Increments in clusters during bulk loads, wide multi-row updates, or online schema changes. Remediation: Raiseinnodb_log_buffer_size to 64–256 MB on write-intensive systems and break oversized transactions into smaller commits.
MariaDB Performance Monitoring: Locking and Deadlocks (Metrics 12–14)
Contention is the failure mode that hardware cannot fix, which makes these MariaDB performance monitoring metrics decisive during a latency incident.12. Innodb_row_lock_current_waits
Measures: Transactions blocked on row locks right now. A gauge, not a cumulative counter. Healthy: Zero or one, transient. Incident signature: Sustained double digits — hot-row contention on a counter or queue table, or one long transaction holding locks while everything queues behind it. Remediation: Find the blocker viainformation_schema.INNODB_TRX and INNODB_LOCK_WAITS, drop innodb_lock_wait_timeout to 10–20s, and index the write predicate — an unindexed UPDATE locks far more rows than it changes.
13. Innodb_row_lock_time_avg
Measures: Mean row-lock wait in milliseconds since server start. Healthy: Below 100 ms. Incident signature: Several thousand milliseconds and rising. The classic cause is an application that opens a transaction, makes an external HTTP call, then commits — holding locks for a network round trip. Remediation: Enforce transaction-scope discipline in code review, keep single-statement work on autocommit, and index write predicates.14. Innodb_deadlocks
Measures: Cumulative deadlock count. A MariaDB-native status variable, so no scraping ofSHOW ENGINE INNODB STATUS is required to trend it.
Healthy: A handful per day in a system that retries correctly.
Incident signature: Hundreds per hour beginning at the exact minute a release shipped — almost always inconsistent lock ordering in a multi-row update path.
Remediation: Set innodb_print_all_deadlocks=ON to capture full wait-for graphs, enforce deterministic ordering by primary key before updating, shorten transactions, and implement retry-on-1213.
MariaDB Performance Monitoring: Temp Tables, Sorts and Index Efficiency (Metrics 15–18)
These four counters are proxies for execution-plan quality. They rise whenever the optimizer is forced to work around a missing index.15. Disk Temp Table Percentage
Measures:Created_tmp_disk_tables as a share of Created_tmp_tables — how often internal temporary tables spill to disk.
Healthy: Below 10%.
Incident signature: 60–80% during reporting windows, temp device saturated, every dashboard query timing out at once.
Remediation: Raise tmp_table_size and max_heap_table_size together — the effective limit is the lower of the two. MariaDB uses Aria for on-disk temp tables by default (aria_used_for_temp_tables=ON), and tmp_disk_table_size caps runaway spills. The durable fix is an index satisfying GROUP BY or ORDER BY without materialization.
16. Sort_merge_passes
Measures: Sorts that exceededsort_buffer_size and required disk-based merge passes.
Healthy: Near-zero delta.
Incident signature: Thousands per hour from unindexed ORDER BY over wide result sets — often a paginated report using SELECT * with a large OFFSET.
Remediation: Never inflate sort_buffer_size globally — it is per-session and will exhaust memory under concurrency. Keep it at 2–8 MB, raise it per session for ETL, and fix the query with a composite index matching the sort order.
17. Select_full_join
Measures: Joins executed with no usable index on the joined table, producing effectively O(n×m) work. Healthy: Zero. Incident signature: Non-zero and growing after a migration dropped a foreign-key index. The server is CPU-bound with little I/O, andHandler_read_rnd_next rises in lockstep — the tell-tale pair for scan-heavy access.
Remediation: Index the join column and confirm with EXPLAIN that type is no longer ALL with a NULL key. Enlarging join_buffer_size is mitigation, never a solution.
18. Table Cache Hit Ratio
Measures: Table-open churn, derived fromOpen_tables against Opened_tables.
Healthy: Above 99% after warm-up, with the Opened_tables delta approaching zero.
Incident signature: Hundreds of opens per second with Table_open_cache_overflows rising — dictionary contention that presents as an unexplained global slowdown.
Remediation: Size table_open_cache as concurrent connections times average tables per query (4,000–16,000 typical), set table_definition_cache to cover all tables, use table_open_cache_instances 8–16, and raise open_files_limit.
MariaDB Performance Monitoring: Binary Log (Metrics 19–20)
Binary log counters complete MariaDB performance monitoring by exposing commit latency and the real cost of durability.19. Binlog Cache Disk Use Percentage
Measures:Binlog_cache_disk_use relative to total binlog cache usage — transactions whose events outgrew the in-memory cache and spilled to a temp file.
Healthy: Below 1%.
Incident signature: 30% or more during bulk write windows, commit latency rising, replicas drifting because every large transaction pays a disk round trip before commit.
Remediation: Set binlog_cache_size to 1–4 MB (per session) and binlog_stmt_cache_size similarly. Cut event volume with binlog_row_image=MINIMAL where the topology allows, and split oversized transactions.
20. Group Commit Efficiency (Binlog_commits / Binlog_group_commits)
Measures: Average transactions amortized into a single binary log fsync. Healthy: Comfortably above 1.0 under concurrent write load; higher means better fsync amortization. Incident signature: A ratio of essentially 1.0 withsync_binlog=1, and commit latency tracking storage fsync latency exactly. Every transaction pays for its own flush.
Remediation: Force grouping with binlog_commit_wait_count=20 and binlog_commit_wait_usec=1000. Keep sync_binlog=1 and innodb_flush_log_at_trx_commit=1 on low-latency, power-loss-protected storage.
Field Notes: MariaDB Performance Monitoring in Practice
Five habits separate effective MariaDB performance monitoring from dashboard theatre.Delta sampling is the core of accurate MariaDB performance monitoring
Delta sampling is the single most misunderstood part of MariaDB performance monitoring. Every counter inGLOBAL_STATUS except the gauges is monotonic since server start. A buffer pool hit ratio computed over 400 days of uptime is a historical average that stays green through an outage that is destroying you right now. Sample every 10–60 seconds and alert on the derived rate. The only values safe to read absolutely are Threads_connected, Threads_running, Innodb_row_lock_current_waits, and dirty page percentage.
Pair MariaDB performance monitoring counters with PROCESSLIST during an incident
Counters tell you the class of problem;information_schema.PROCESSLIST tells you which statement owns it. This pairing is the fastest triage step in MariaDB performance monitoring. Filter aggressively instead of reading the raw dump.
SELECT ID, USER, HOST, DB, COMMAND, TIME, STATE,
       LEFT(INFO, 120) AS QUERY_HEAD
FROM information_schema.PROCESSLIST
WHERE COMMAND NOT IN ('Sleep', 'Daemon')
  AND TIME > 2
ORDER BY TIME DESC
LIMIT 25;
A STATE of "Copying to tmp table" confirms metric 15; "Sending data" with high TIME confirms metrics 17 and 18; "Waiting for table metadata lock" points at unfinished DDL, not InnoDB.
Use MariaDB-specific slow log verbosity
MariaDB's slow log is richer than the defaults suggest. Enabling plan capture turns it from a list of symptoms into a list of causes.SET GLOBAL slow_query_log = ON; SET GLOBAL long_query_time = 0.5; SET GLOBAL log_slow_verbosity = 'query_plan,explain'; SET GLOBAL log_queries_not_using_indexes = ON; SET GLOBAL log_slow_rate_limit = 1;With
explain enabled, MariaDB writes the actual execution plan beside each slow statement, so you diagnose the plan the optimizer chose at 02:00 rather than the one it picks at 10:00. On very high-QPS systems, sample with log_slow_rate_limit rather than disabling the log.
Wire MariaDB performance monitoring into Prometheus and Grafana
Ad-hoc scripts are for incidents; continuous MariaDB performance monitoring is what prevents them. We walk through a real example in our case study on cutting P99 latency 10x with observability. Deploymysqld_exporter with a least-privilege account and let Prometheus do the delta arithmetic through rate().
CREATE USER 'exporter'@'127.0.0.1' IDENTIFIED BY '<strong-password>';
GRANT PROCESS, REPLICATION CLIENT, SELECT ON *.* TO 'exporter'@'127.0.0.1';
GRANT SLAVE MONITOR ON *.* TO 'exporter'@'127.0.0.1';
ALTER USER 'exporter'@'127.0.0.1' WITH MAX_USER_CONNECTIONS 3;
Nineteen of the twenty MariaDB performance monitoring metrics map directly onto
mysql_global_status_* series; the ratios become recording rules. Alert on sustained breaches across 5-minute windows, never on a single scrape. Continuous MariaDB performance monitoring is only useful when the alerting thresholds come from your own baseline.
Record a MariaDB performance monitoring baseline before you need one
Snapshot all twenty MariaDB performance monitoring metrics at peak, at trough, and during your heaviest batch window, and store them with the schema version. The next incident then opens with a comparison rather than an investigation.Summary Table: 20 MariaDB Performance Monitoring Metrics
Keep this MariaDB performance monitoring table open during triage.| # | Metric | Healthy Range | Red-Flag Signal | Remediation |
|---|---|---|---|---|
| 1 | Threads_connected | Below 80% of max_ |
Rapid climb while Threads_ |
Cap application pool size; wait_timeout 300; add ProxySQL or MaxScale |
| 2 | Threads_running | At or below CPU core count | Sustained 5x cores with CPU at 100% | thread_handling=pool-of-threads; thread_pool_size = cores |
| 3 | Connection Usage % | Below 80% | Sustained 100% with rising max-connection errors | Raise max_connections with open_files_limit; configure extra_port |
| 4 | Aborted_connects | Near-zero delta | Hundreds per minute; hosts getting blocked | connect_timeout 10–20; skip_name_resolve=ON; FLUSH HOSTS |
| 5 | Questions (QPS) | Stable vs baseline | 3x normal with flat business volume | Inspect Com_* mix; throttle at the proxy; fix ORM N+1 |
| 6 | Read/Write Mix | Consistent with design | Com_delete spike mid-day; purge lag | Chunk DML; move batches off-peak; innodb_purge_threads 4 or more |
| 7 | Slow Query Ratio | Below 0.1% | Jump to 3–5% after deploy or stats refresh | log_slow_verbosity='query_plan,explain'; add covering indexes |
| 8 | Buffer Pool Hit Ratio | 99.9% or better | Drop to 95% with rising physical reads | innodb_buffer_pool_size 60–75% of RAM; innodb_old_blocks_time=1000 |
| 9 | Dirty Pages % | Stable 10–40% | Pinned above 90%; sawtooth throughput | Larger innodb_log_file_size; tune innodb_io_capacity[_max]; lwm=10 |
| 10 | Innodb_buffer_pool_ |
Zero | Any sustained increase | Raise innodb_io_capacity_max; more page cleaners; bigger buffer pool |
| 11 | Innodb_log_waits | Zero | Clusters during bulk loads | innodb_log_buffer_size 64–256 MB; split large transactions |
| 12 | Innodb_row_lock_ |
0–1, transient | Sustained double digits | Triage INNODB_TRX / INNODB_LOCK_WAITS; index the write predicate |
| 13 | Innodb_row_lock_ |
Below 100 ms | Thousands of ms and rising | Shorten transaction scope; no external calls inside transactions |
| 14 | Innodb_deadlocks | Single digits per day | Hundreds per hour after a release | innodb_print_all_deadlocks=ON; order by PK; retry on error 1213 |
| 15 | Disk Temp Table % | Below 10% | 60–80% during reporting windows | Raise tmp_table_size and max_heap_table_size; index GROUP BY / ORDER BY |
| 16 | Sort_merge_passes | Near-zero delta | Thousands per hour | Composite index on sort order; keep sort_buffer_size 2–8 MB |
| 17 | Select_full_join | Zero | Non-zero and growing after a migration | Index the join column; confirm EXPLAIN no longer shows type=ALL |
| 18 | Table Cache Hit Ratio | Above 99% after warm-up | Hundreds of opens/sec; cache overflows | table_open_cache 4k–16k; table_definition_cache; instances 8–16 |
| 19 | Binlog Cache Disk Use % | Below 1% | 30%+ during bulk writes; commit latency up | binlog_cache_size 1–4 MB; binlog_row_image=MINIMAL; smaller transactions |
| 20 | Commits per Group Commit | Above 1.0 under load | Ratio near 1.0 with sync_binlog=1 | binlog_commit_wait_count=20; binlog_commit_wait_usec=1000 |
MariaDB Performance Monitoring and Assessment from MinervaDB
MinervaDB delivers MariaDB performance monitoring, performance audits, production health checks, and 24/7 enterprise-class managed DBA services for organizations running mission-critical open-source database infrastructure. Our engagements go well past counter collection: we baseline your workload, instrument the twenty MariaDB performance monitoring metrics above into your existing observability stack, rebuild the indexing and configuration strategy around measured evidence, and stay on call when it matters. Our MariaDB performance monitoring engagements are outcome-based, not tool-based. Explore our full range of database engineering services. If your MariaDB estate is growing faster than your confidence in it, write to us at contact@minervadb.com for a MariaDB performance assessment.Running MariaDB in production? MinervaDB provides MariaDB consulting, 24×7 MariaDB support and MariaDB remote DBA services as part of its database consulting services.
Running this in production?
MinervaDB provides MariaDB Consulting, MariaDB Support and MariaDB Remote DBA with 24x7 coverage and a 15-minute S1 response. Talk to an engineer.