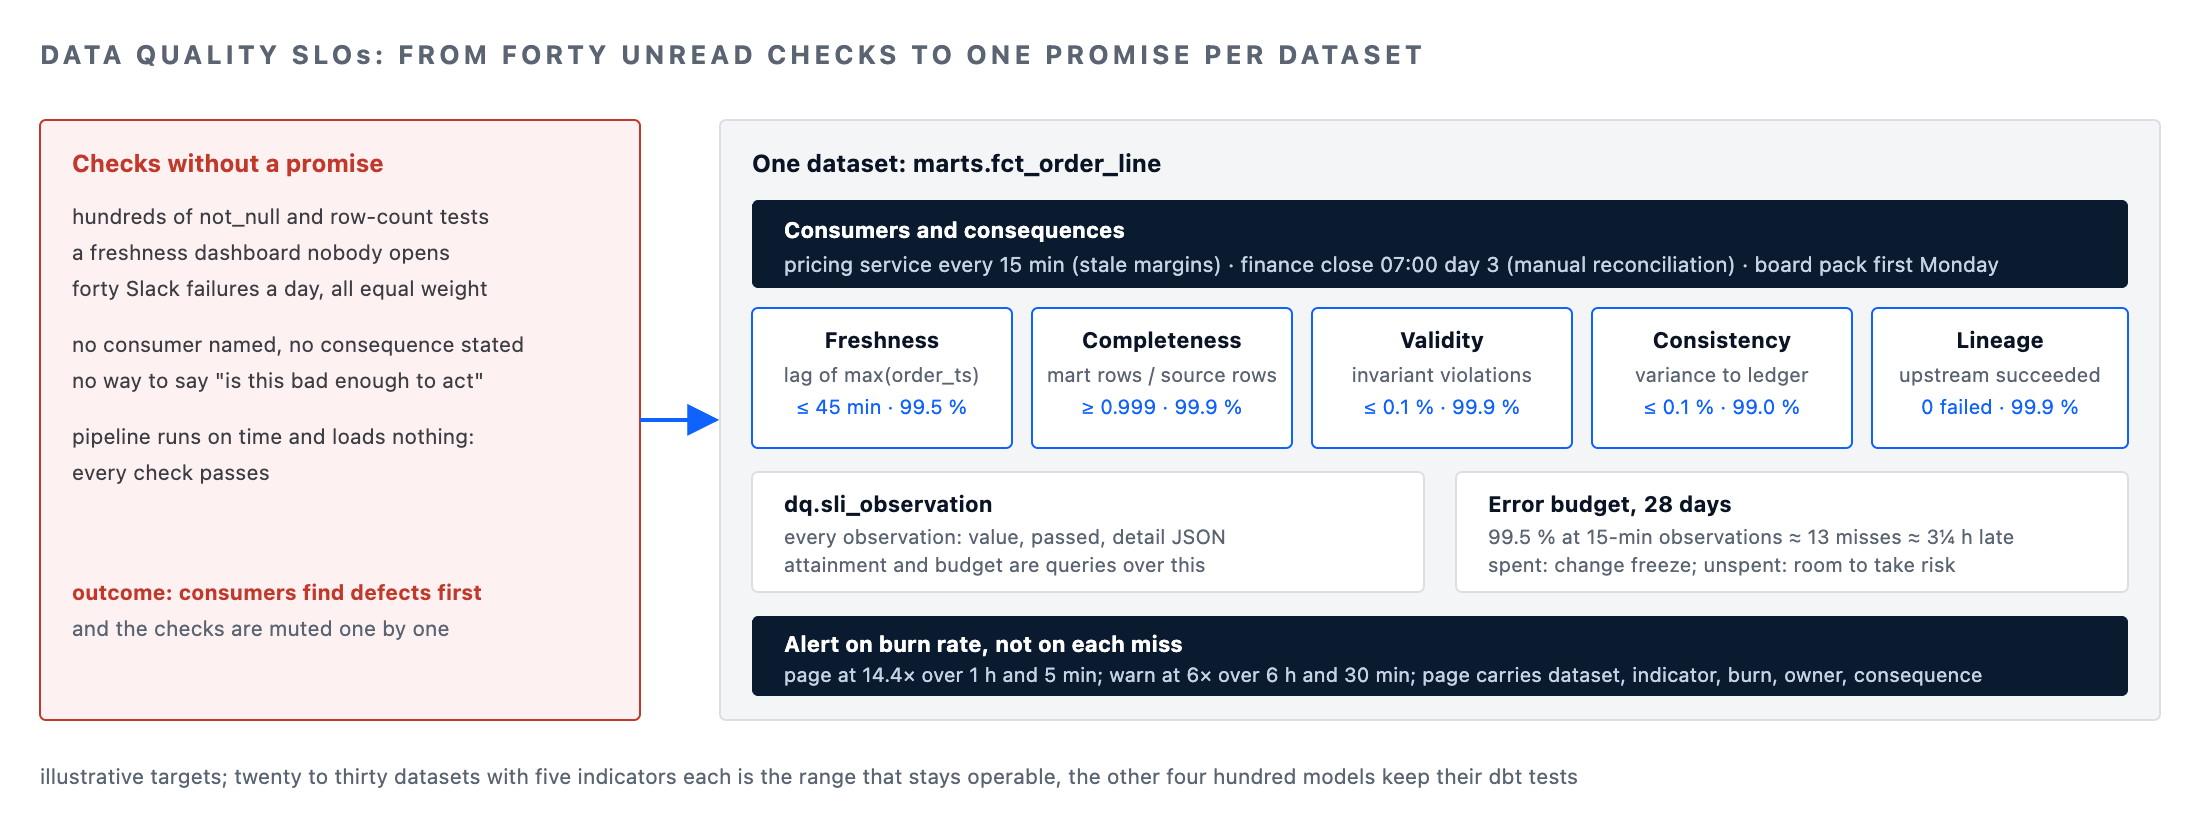
Every data platform we take over has data quality checks. Hundreds of them, usually: not_null tests on every column, row-count assertions, a freshness dashboard nobody looks at, and a Slack channel where the failures scroll past unread because there are forty a day and none of them says whether anyone should care. The checks exist; the discipline that turns them into a promise does not.
Data quality SLOs are that discipline, borrowed directly from the way SRE teams run services: a small number of measured indicators per dataset, an explicit target for each, an error budget that says how much failure is tolerable before work stops, and alerts that fire on the rate at which the budget is burning rather than on every individual miss.
This post sets out the data quality SLOs we implement for customers running dbt and Airflow on PostgreSQL, ClickHouse, Snowflake, BigQuery or Databricks. It takes one dataset, an order-line fact table, and follows it through the five indicators we measure, the SQL that produces each, the SLO table that stores the targets and their owners, the burn-rate alerts that replace per-test noise, and the incident and review loop that keeps the targets honest. All the code runs on PostgreSQL 16 or later and dbt Core 1.8 or later; the ClickHouse variants are noted where they differ. Targets and figures are illustrative unless a measurement source is named.
An SLO is a promise to a consumer, so start with the consumer
The first mistake in data quality SLOs is writing them for the pipeline rather than for the people who depend on it. A freshness target of "loaded by 06:00" means nothing until someone says what breaks at 06:01. So each dataset gets a named consumer and a stated consequence: finance closes on fct_order_line at 07:00 on the third working day; the pricing service reads it every fifteen minutes; the board pack is built from it on the first Monday.
Those three consumers want different things, and the SLO records the strictest requirement each dimension actually has, with the consumer and the consequence written beside it. That is what makes the target defensible when the on-call engineer is woken at 03:00.
-- Data quality SLOs live in a table, per dataset and indicator, with owner and consequence
CREATE TABLE dq.slo (
    dataset            TEXT        NOT NULL,          -- 'marts.fct_order_line'
    indicator          TEXT        NOT NULL
                       CONSTRAINT dq_slo_indicator_chk
                       CHECK (indicator IN ('freshness','completeness','validity','consistency','lineage')),
    target             NUMERIC(6,4) NOT NULL,         -- 0.9950 = 99.5 % of evaluation windows meet the SLI
    window_days        SMALLINT    NOT NULL DEFAULT 28,
    sli_threshold      TEXT        NOT NULL,          -- '45 minutes', '0.999', '0.0010'
    consumer           TEXT        NOT NULL,          -- 'finance close', 'pricing service'
    consequence        TEXT        NOT NULL,          -- what breaks when the SLI misses
    owner_email        TEXT        NOT NULL,
    set_at             TIMESTAMPTZ NOT NULL DEFAULT now(),
    CONSTRAINT dq_slo_pk PRIMARY KEY (dataset, indicator)
);

INSERT INTO dq.slo VALUES
  ('marts.fct_order_line','freshness',   0.9950, 28, '45 minutes', 'pricing service',
   'pricing falls back to yesterday''s margins; measurable revenue impact per hour', 'data-platform-lead@example.com', now()),
  ('marts.fct_order_line','completeness',0.9990, 28, '0.999',      'finance close',
   'close reconciliation fails; controllers work manually', 'fpa-lead@example.com', now()),
  ('marts.fct_order_line','validity',    0.9990, 28, '0.0010',     'all',
   'downstream models produce nulls in margin', 'data-platform-lead@example.com', now()),
  ('marts.fct_order_line','consistency', 0.9900, 28, '0.0010',     'finance close',
   'ledger variance above tolerance blocks sign-off', 'fpa-lead@example.com', now()),
  ('marts.fct_order_line','lineage',     0.9990, 28, 'all upstream succeeded', 'all',
   'silently stale or partial upstream; every consumer affected', 'data-platform-lead@example.com', now());
Five rows of data quality SLOs for the most important table in the warehouse, and that is deliberate. Data quality SLOs are meant to be few: the twenty or thirty datasets that consumers actually depend on, five indicators each, and nothing else promised. The other four hundred models keep their dbt tests, but a failing test on an intermediate model is a build failure for the engineer, not a page, and not a breach of anything.
Five data quality SLOs indicators, and the query behind each
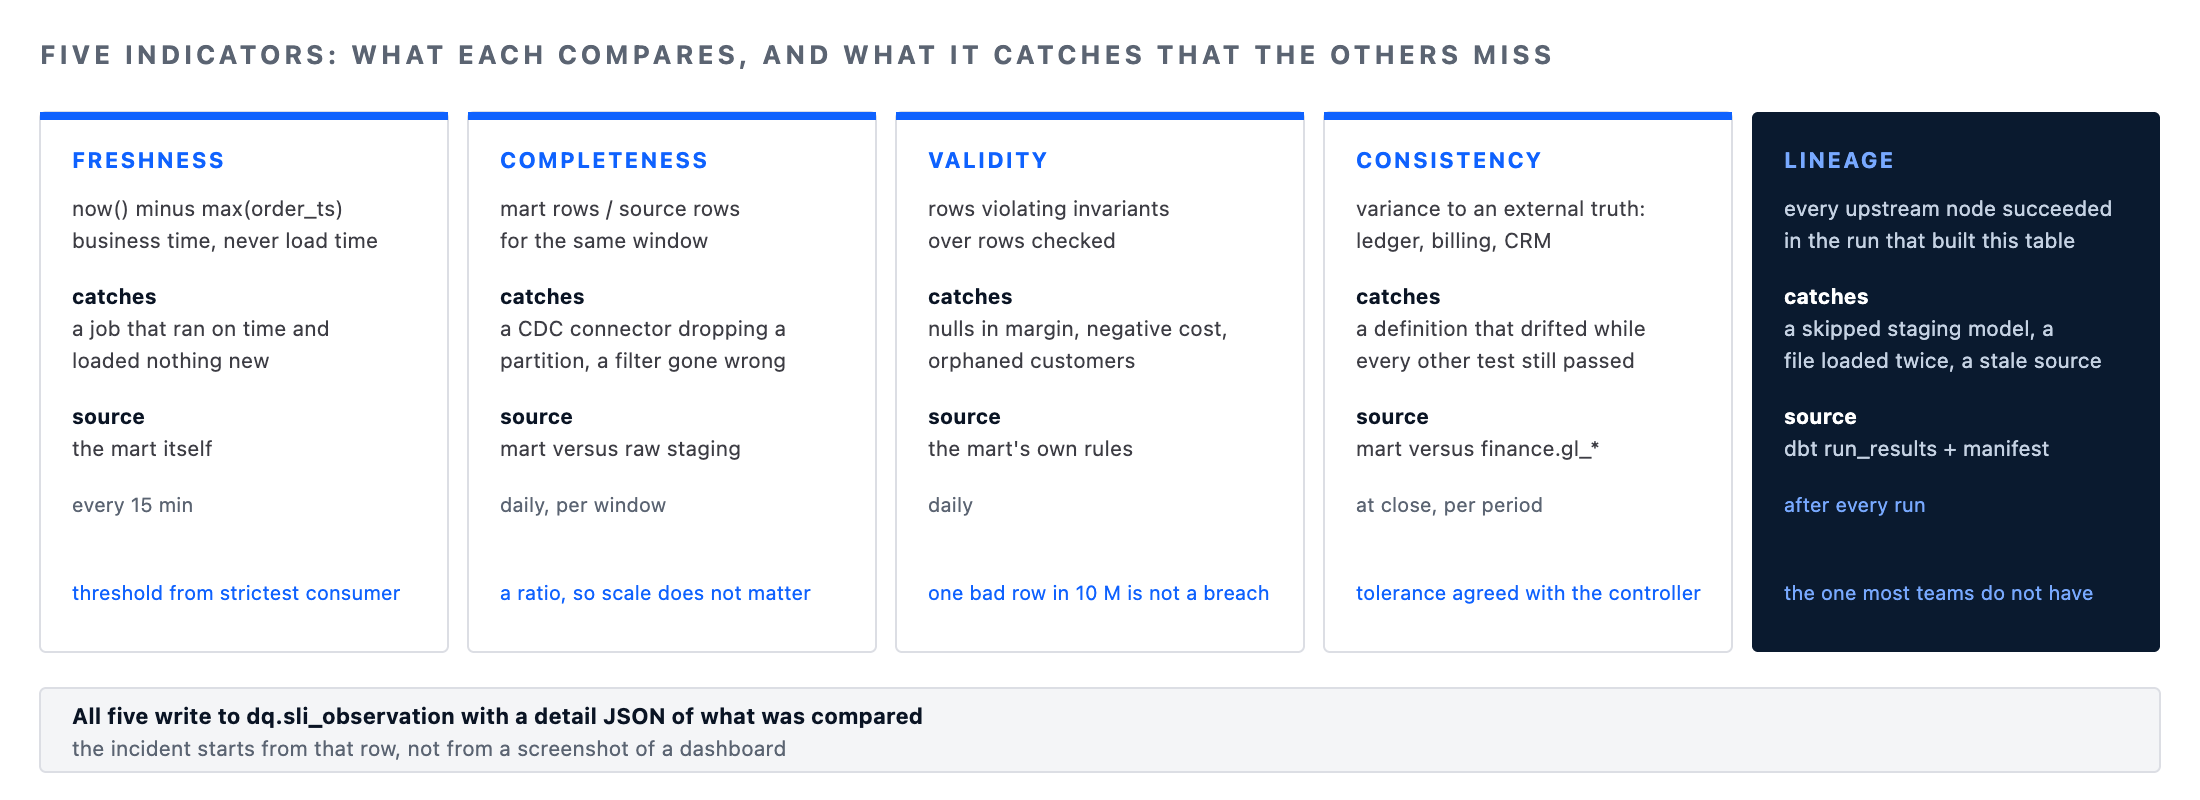
An SLI behind data quality SLOs is a measurement, taken on a schedule, that yields a pass or fail against a threshold. Data quality SLOs collapse the hundreds of possible checks on a dataset into five that between them cover what a consumer can be harmed by: the data is late, incomplete, malformed, inconsistent with another source of truth, or built on something that did not succeed. Each is computed by the platform from its own tables and written to one evaluation log, so the SLO attainment and the error budget are queries over that log rather than a dashboard someone assembles.
-- One evaluation log for every SLI observation
CREATE TABLE dq.sli_observation (
    dataset            TEXT        NOT NULL,
    indicator          TEXT        NOT NULL,
    observed_at        TIMESTAMPTZ NOT NULL DEFAULT now(),
    value              NUMERIC,                       -- minutes of lag, ratio, count
    passed             BOOLEAN     NOT NULL,
    detail             JSONB,                         -- what was compared, for the incident
    CONSTRAINT dq_sli_observation_pk PRIMARY KEY (dataset, indicator, observed_at)
);

-- 1. Freshness: age of the newest business event versus its own expected cadence
INSERT INTO dq.sli_observation (dataset, indicator, value, passed, detail)
SELECT 'marts.fct_order_line', 'freshness',
       EXTRACT(EPOCH FROM (now() - MAX(order_ts))) / 60                       AS lag_minutes,
       EXTRACT(EPOCH FROM (now() - MAX(order_ts))) / 60 <= 45                 AS passed,
       jsonb_build_object('max_order_ts', MAX(order_ts))
FROM marts.fct_order_line;

-- 2. Completeness: rows landed versus rows the source system says it emitted for the window
INSERT INTO dq.sli_observation (dataset, indicator, value, passed, detail)
SELECT 'marts.fct_order_line', 'completeness',
       m.n::NUMERIC / NULLIF(s.n, 0)                                           AS ratio,
       m.n::NUMERIC / NULLIF(s.n, 0) >= 0.999                                  AS passed,
       jsonb_build_object('mart_rows', m.n, 'source_rows', s.n, 'window', 'yesterday')
FROM (SELECT count(*) AS n FROM marts.fct_order_line
      WHERE order_ts >= CURRENT_DATE - 1 AND order_ts < CURRENT_DATE) AS m,
     (SELECT count(*) AS n FROM staging.oms_order_line_raw
      WHERE event_ts >= CURRENT_DATE - 1 AND event_ts < CURRENT_DATE) AS s;

-- 3. Validity: share of rows violating the dataset's own invariants
INSERT INTO dq.sli_observation (dataset, indicator, value, passed, detail)
SELECT 'marts.fct_order_line', 'validity',
       count(*) FILTER (WHERE net_amount IS NULL OR landed_cost < 0 OR (customer_id IS NULL AND channel <> 'guest'))::NUMERIC
         / NULLIF(count(*), 0)                                                 AS invalid_ratio,
       count(*) FILTER (WHERE net_amount IS NULL OR landed_cost < 0 OR (customer_id IS NULL AND channel <> 'guest'))::NUMERIC
         / NULLIF(count(*), 0) <= 0.001                                        AS passed,
       jsonb_build_object('rows_checked', count(*))
FROM marts.fct_order_line
WHERE order_ts >= CURRENT_DATE - 1;
In data quality SLOs, freshness is measured against the business timestamp, not the load timestamp; a pipeline that runs on time and loads nothing new is late, and only the business timestamp shows it. Completeness compares against the source's own count for the same window, which is the only comparison that catches a CDC connector silently dropping a partition. Validity checks the dataset's invariants as a ratio rather than a boolean, so a single bad row in ten million does not fail the SLI while a thousand do.
-- 4. Consistency: reconciliation to an external truth, here the finance ledger for the last closed month
INSERT INTO dq.sli_observation (dataset, indicator, value, passed, detail)
SELECT 'marts.fct_order_line', 'consistency',
       ABS(m.net - g.net) / NULLIF(g.net, 0)                                   AS variance_ratio,
       ABS(m.net - g.net) / NULLIF(g.net, 0) <= 0.001                          AS passed,
       jsonb_build_object('mart_net', m.net, 'ledger_net', g.net, 'period', date_trunc('month', CURRENT_DATE - INTERVAL '1 month'))
FROM (SELECT SUM(net_amount) AS net FROM marts.fct_order_line
      WHERE order_ts >= date_trunc('month', CURRENT_DATE - INTERVAL '1 month')
        AND order_ts <  date_trunc('month', CURRENT_DATE)) AS m,
     (SELECT SUM(amount) AS net FROM finance.gl_revenue_by_period
      WHERE period = date_trunc('month', CURRENT_DATE - INTERVAL '1 month')
        AND account_class = 'NET_REVENUE') AS g;

-- 5. Lineage integrity: every upstream model in this dataset's DAG succeeded in the run that produced it
-- (dq.run_result is loaded from dbt's run_results.json after every run)
INSERT INTO dq.sli_observation (dataset, indicator, value, passed, detail)
SELECT 'marts.fct_order_line', 'lineage',
       count(*) FILTER (WHERE status <> 'success')                            AS failed_upstream,
       count(*) FILTER (WHERE status <> 'success') = 0                        AS passed,
       jsonb_build_object('run_id', MAX(run_id),
                          'failed', jsonb_agg(node_name) FILTER (WHERE status <> 'success'))
FROM dq.run_result
WHERE run_id = (SELECT MAX(run_id) FROM dq.run_result WHERE node_name = 'marts.fct_order_line')
  AND node_name IN (SELECT upstream FROM dq.lineage WHERE downstream = 'marts.fct_order_line');
Lineage integrity is the data quality SLOs indicator most teams do not have and most incidents trace back to. A mart can build successfully from a staging model that failed silently and was skipped, or from a source that loaded yesterday's file twice. Loading dbt's run_results.json and manifest.json into two small tables after every run makes "did everything this table depends on actually succeed this time" a query, and it is the query that runs first when a consumer reports a wrong number.
Data quality SLOs attainment and error budget are queries, not opinions
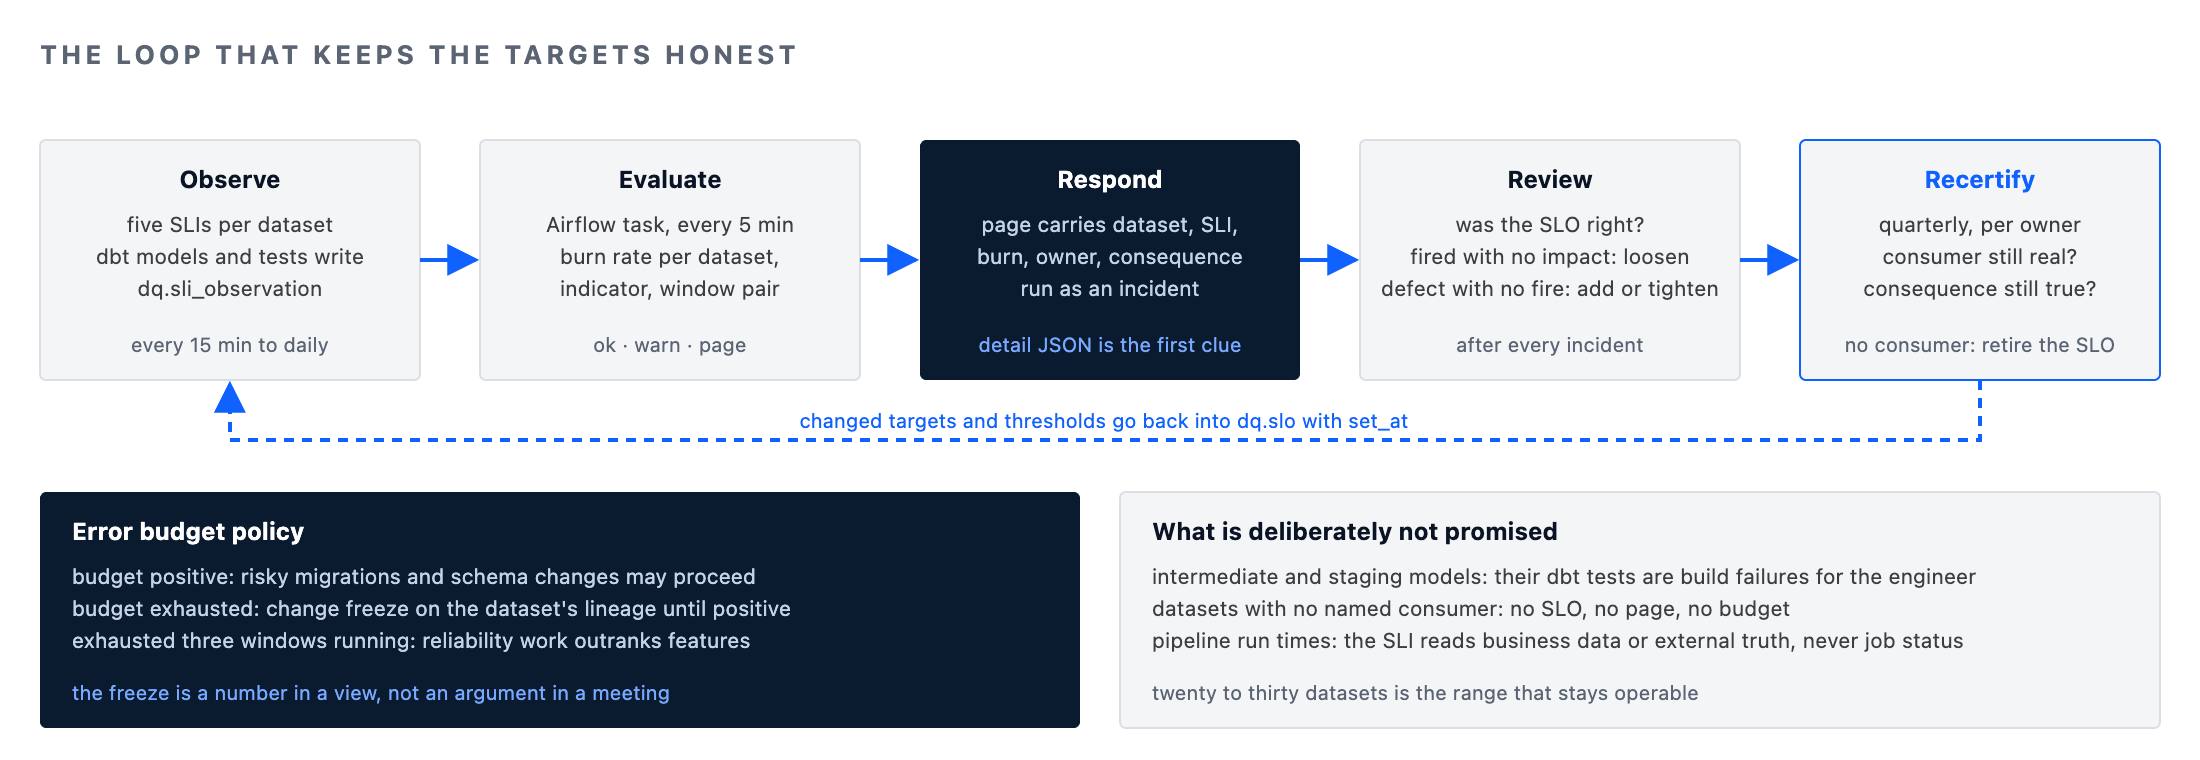
With targets in one table and observations in another, data quality SLOs become arithmetic. Attainment over the window is the share of observations that passed. The error budget is the shortfall the target permits, and the budget remaining is how much of it has been spent. A freshness SLO of 99.5 percent over 28 days with an observation every fifteen minutes allows about thirteen failed observations, roughly three and a quarter hours of lateness, in the window. Once that is spent, the dataset is in breach and the policy in the next section applies.
-- Attainment and error budget remaining, per dataset and indicator, over each SLO's own window
SELECT
    s.dataset,
    s.indicator,
    s.target,
    count(o.*)                                                    AS observations,
    count(o.*) FILTER (WHERE o.passed)                            AS passed,
    round(count(o.*) FILTER (WHERE o.passed)::NUMERIC / NULLIF(count(o.*), 0), 5) AS attainment,
    round((1 - s.target) * count(o.*))                            AS budget_total_obs,
    round((1 - s.target) * count(o.*)) - count(o.*) FILTER (WHERE NOT o.passed) AS budget_remaining_obs,
    s.owner_email
FROM dq.slo AS s
LEFT JOIN dq.sli_observation AS o
       ON o.dataset = s.dataset AND o.indicator = s.indicator
      AND o.observed_at >= now() - make_interval(days => s.window_days)
GROUP BY s.dataset, s.indicator, s.target, s.owner_email
ORDER BY budget_remaining_obs ASC;
That view is the weekly data quality SLOs review. A dataset with budget to spare can take a risky migration this sprint; one with none cannot, and the change freeze is a number rather than an argument. On ClickHouse the same two tables and the same query work unchanged apart from make_interval, which becomes INTERVAL s.window_days DAY.
Alert on burn rate, not on every miss
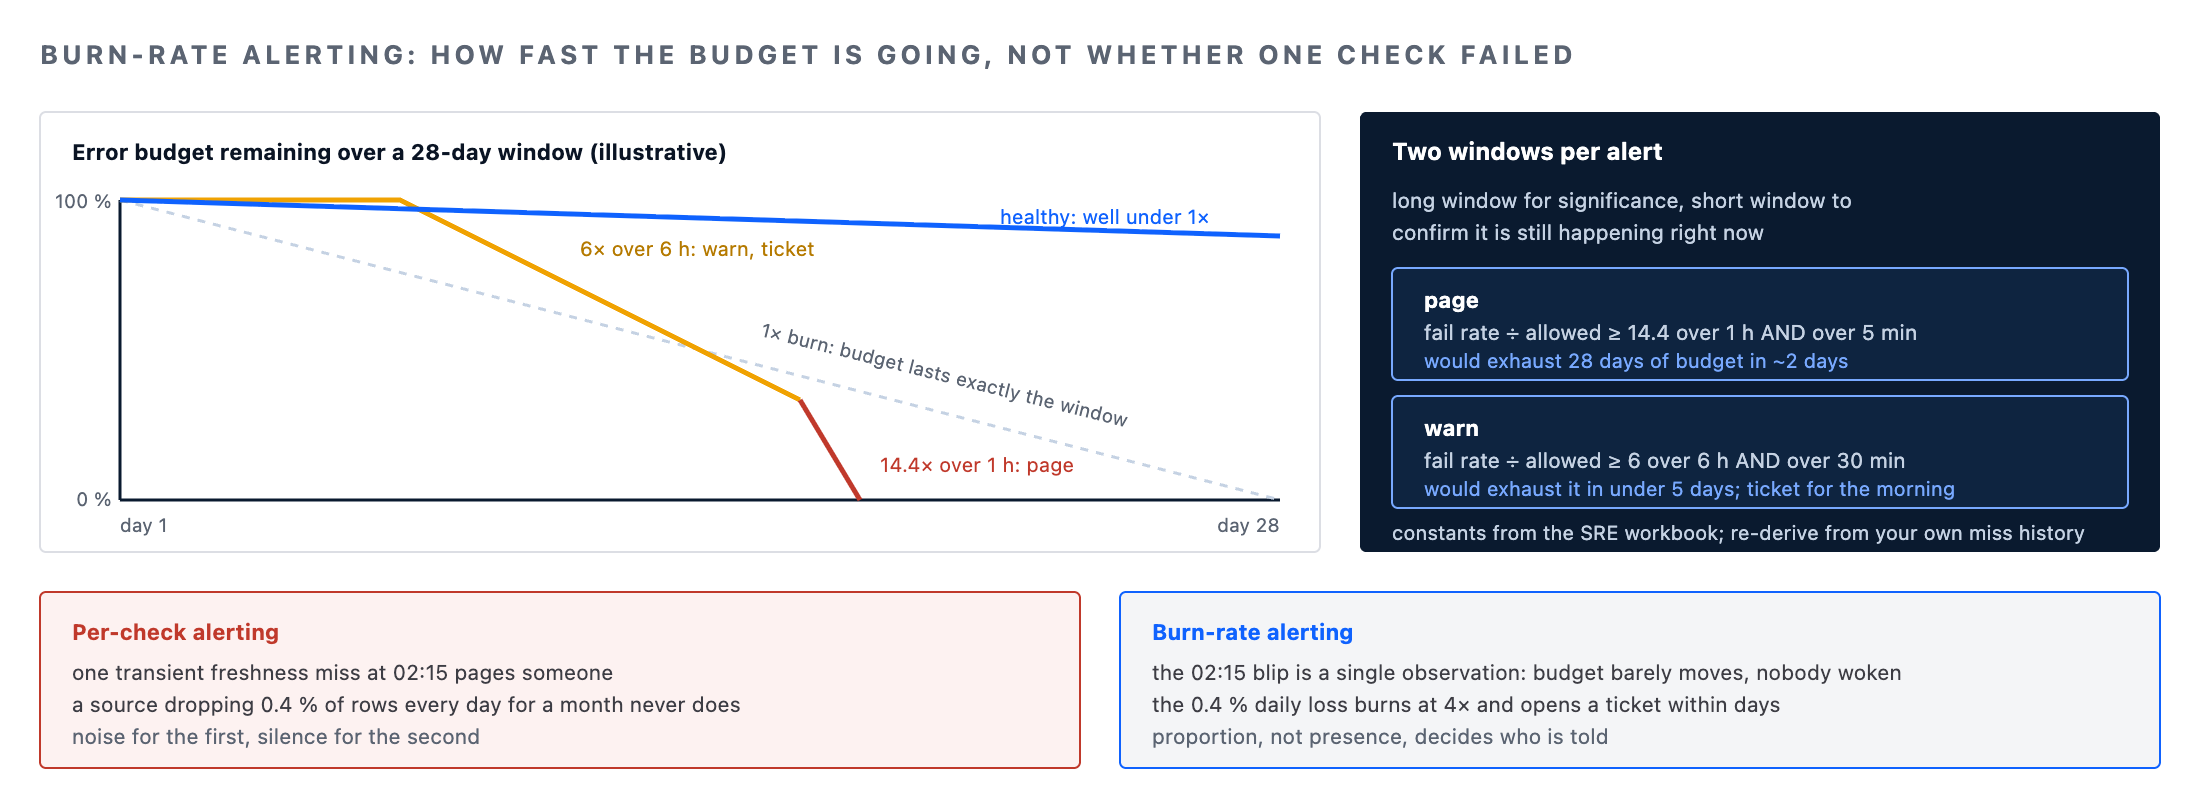
The reason forty data quality Slack messages a day go unread is that each one is a single failed check with no sense of proportion. Data quality SLOs replace that with the SRE multi-window burn-rate alert: page when the budget is being consumed fast enough that it will be exhausted long before the window ends, and warn when it is being consumed steadily faster than the target allows. Two windows per alert, a long one for significance and a short one to confirm the problem is still happening, keep a transient blip from paging anyone and a slow bleed from being ignored.
-- Multi-window burn-rate alert for the freshness SLO (illustrative: page at 14.4x over 1h and 5m; warn at 6x over 6h and 30m)
WITH s AS (
    SELECT dataset, indicator, target, window_days FROM dq.slo
    WHERE dataset = 'marts.fct_order_line' AND indicator = 'freshness'
),
rates AS (
    SELECT
        (SELECT (1 - target) FROM s)                                                   AS allowed_fail_rate,
        AVG((NOT passed)::int) FILTER (WHERE observed_at >= now() - INTERVAL '1 hour')   AS fail_1h,
        AVG((NOT passed)::int) FILTER (WHERE observed_at >= now() - INTERVAL '5 minutes') AS fail_5m,
        AVG((NOT passed)::int) FILTER (WHERE observed_at >= now() - INTERVAL '6 hours')  AS fail_6h,
        AVG((NOT passed)::int) FILTER (WHERE observed_at >= now() - INTERVAL '30 minutes') AS fail_30m
    FROM dq.sli_observation
    WHERE dataset = 'marts.fct_order_line' AND indicator = 'freshness'
      AND observed_at >= now() - INTERVAL '6 hours'
)
SELECT
    CASE
        WHEN fail_1h / allowed_fail_rate >= 14.4 AND fail_5m  / allowed_fail_rate >= 14.4 THEN 'page'
        WHEN fail_6h / allowed_fail_rate >= 6.0  AND fail_30m / allowed_fail_rate >= 6.0  THEN 'warn'
        ELSE 'ok'
    END AS level,
    round(fail_1h / allowed_fail_rate, 1) AS burn_1h,
    round(fail_6h / allowed_fail_rate, 1) AS burn_6h
FROM rates;
For data quality SLOs, a burn rate of 14.4 over an hour means the dataset is failing at a pace that would exhaust a 28-day budget in about two days; that is worth waking someone for. A burn rate of six over six hours exhausts it in under five days and is worth a ticket in the morning. The constants are the ones Google's SRE workbook popularised and they are a starting point, not a law; the right ones for a dataset come from looking at its own history of misses and asking which of them the consumer would have wanted to know about at 03:00.
Wiring data quality SLOs into dbt and Airflow
Data quality SLOs need no new platform. The five data quality SLOs queries are dbt models or singular tests that write to dq.sli_observation; the attainment view is a dbt model; the burn-rate query is an Airflow task that runs every five minutes and routes on its result. The one addition that matters is loading dbt's run artefacts into the warehouse after every run, because that is what makes the lineage indicator and the incident investigation possible.
# Airflow 2.9+: burn-rate check every five minutes, routed by level; run artefacts loaded after every dbt run
from datetime import timedelta
from airflow.decorators import dag, task
from airflow.providers.postgres.hooks.postgres import PostgresHook

@dag(schedule=timedelta(minutes=5), catchup=False, max_active_runs=1, tags=["dq", "slo"])
def dq_burn_rate():

    @task
    def evaluate() -> list[dict]:
        hook = PostgresHook(postgres_conn_id="warehouse")
        rows = hook.get_records(open("/opt/airflow/sql/dq_burn_rate_all.sql").read())
        return [dict(dataset=r[0], indicator=r[1], level=r[2], burn_1h=r[3], owner=r[4]) for r in rows]

    @task
    def route(results: list[dict]) -> None:
        for r in results:
            if r["level"] == "page":
                page_oncall(service="data-platform", summary=f"{r['dataset']} {r['indicator']} burn {r['burn_1h']}x", owner=r["owner"])
            elif r["level"] == "warn":
                open_ticket(queue="data-quality", summary=f"{r['dataset']} {r['indicator']} burning {r['burn_1h']}x", owner=r["owner"])

    route(evaluate())

dq_burn_rate()
# After every dbt run: load run_results.json and manifest.json so lineage integrity is a query
dbt run --select +marts.fct_order_line
python load_dbt_artifacts.py --target-path target/ --schema dq   # writes dq.run_result and dq.lineage
The pager and ticket functions are whatever the estate already uses for data quality SLOs; the point is that the page carries the dataset, the indicator, the burn rate and the owner from the SLO table, so the person woken knows in the first line whether the pricing service is about to fall back to stale margins or a controller will have a bad morning.
The incident and the review are part of the SLO
A page on data quality SLOs is an incident and is run as one: acknowledged, mitigated, resolved, reviewed. The review has one question the pipeline-check world never asks, which is whether the SLO was right. If the freshness page fired and nobody downstream noticed the lateness, the target is stricter than the consumer needs and it should loosen.
If a consumer reported a wrong number and no indicator fired, an indicator is missing or a threshold is too loose, and the review adds or tightens it. Quarterly, the owner of every one of the data quality SLOs confirms the consumer and consequence still hold, and datasets nobody depends on any longer lose their SLOs rather than accumulating.
| Review finding | What it says about the SLO | Action |
|---|---|---|
| Page fired, no consumer impact | Target stricter than the consequence justifies | Loosen target or threshold; record the consumer's real tolerance |
| Consumer reported a defect, nothing fired | Missing indicator or threshold too loose | Add the indicator that would have caught it; backfill observations to confirm |
| Budget exhausted three months running | Pipeline cannot meet the promise as built | Reliability work takes priority over features until budget is positive |
| Budget never touched | Either excellent, or the SLI is not measuring what breaks | Check the SLI against a known past incident; tighten if it would have missed it |
| Owner cannot name the consumer | SLO has outlived its purpose | Retire it; keep the dbt tests |
Where data quality SLOs go wrong
Three data quality SLOs failure modes recur. Over-instrumentation: a team promises SLOs on every model, the budget arithmetic becomes noise, and the pager fires for datasets nobody reads. Twenty to thirty datasets with data quality SLOs is the range we see work. Measuring the pipeline instead of the data: a freshness SLI on "last job run time" passes while the job loads nothing, which is why every SLI here reads the business data or an external truth. And SLOs without consequences: a target with no named consumer and no stated impact will be argued down the first time it pages, so the consequence column is not optional.
Working with MinervaDB on data quality SLOs
Data quality SLOs are the operating discipline inside our data governance consulting practice and the Data SRE layer of our data engineering work: a typical engagement selects the datasets that matter with their consumers, writes the five indicators and targets for each, wires the observation log and burn-rate alerts into the existing dbt and Airflow estate, and runs the first quarterly review with the owners. The same data quality SLOs evaluation-log pattern underpins the reconciliation tests in our metrics layer post and the freshness SLIs in our feature store architecture.
Under managed operations the burn-rate pager routes to our 24×7 teams under the standard S1 to S4 commitments, with an exhausted error budget on a finance-close dataset treated as an S2 and a lineage-integrity failure on a production model as an S1. As always: test every query, threshold and constant here against your own datasets and history before applying them to production, and keep the observation log itself under a restore posture; it is the evidence behind every promise.
Running this in production?
MinervaDB provides Data Engineering Consulting and Data Analytics Platform Engineering with 24x7 coverage and a 15-minute S1 response. Talk to an engineer.