Every DBaaS contract is the same trade written in different words: the provider takes over a list of operational duties and, in exchange, takes away a list of controls. The mistake most teams make is reading only the first list. The second list is where the performance ceilings, the migration lock-in and the surprise invoices live, and it differs enough between Amazon RDS, Aurora, Azure Database, Cloud SQL, MongoDB Atlas, Snowflake, Redshift and the vector-database services that a general opinion about “the cloud” is worthless.
This page is a ledger of that trade. The first half lists what a managed database service takes off the operator’s plate and what that is worth. The second half lists what it takes out of the operator’s hands, service by service, and how MinervaDB works around each gap when supporting an estate that runs on DBaaS. The last part is the decision method we use before a workload is committed to a service, or repatriated from one.
The archive it introduces spans RDS and Aurora selection, Aurora Serverless, Azure Database for MySQL and Cosmos DB, Redshift cost and permissions, Snowflake query performance, MongoDB Atlas, Milvus sizing, the BYOC security standard, and the engine-level posts that explain why a managed setting behaves the way it does.
What a DBaaS takes off your plate, and what it is worth
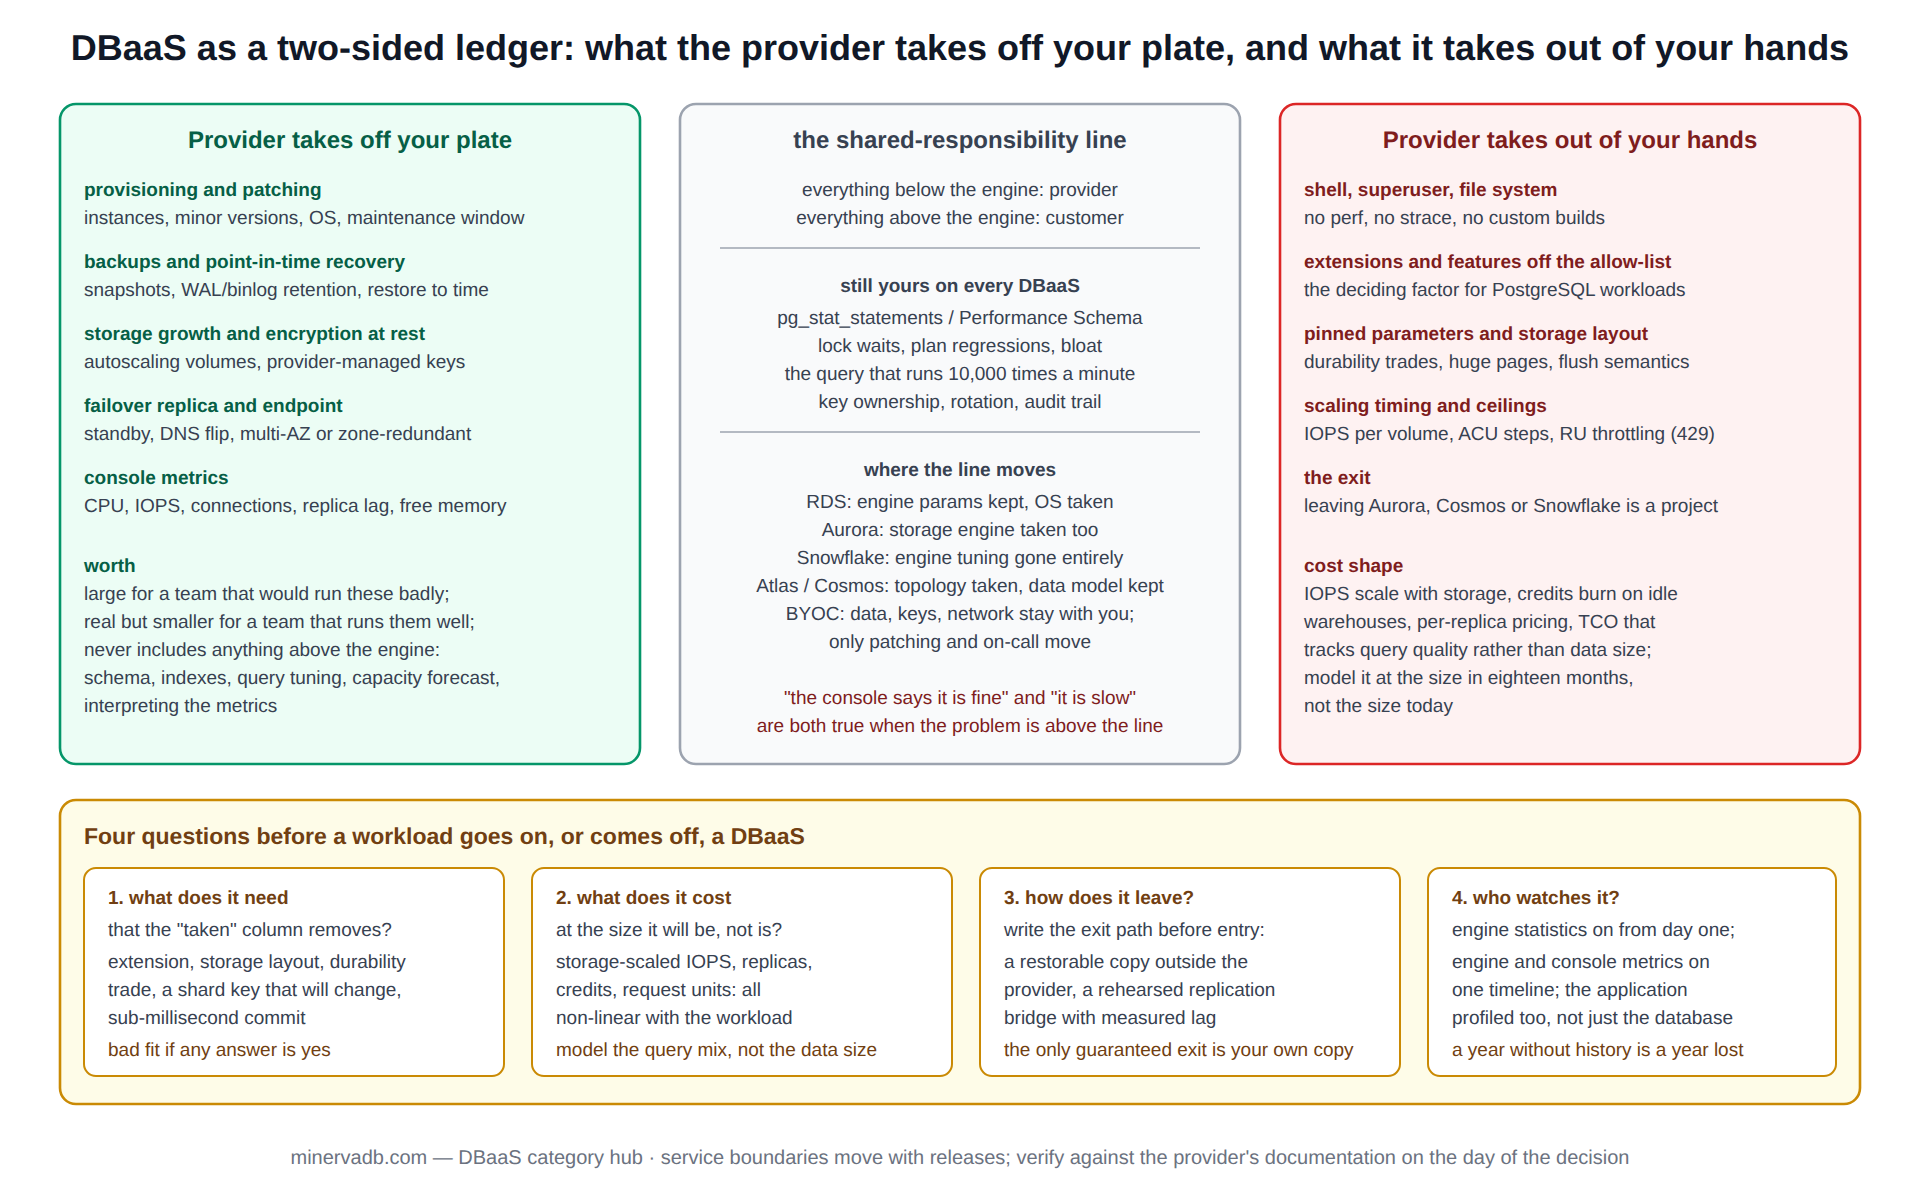
The provider’s side of the ledger is real and it is the reason DBaaS exists. Provisioning, patching, automated backups with point-in-time recovery, storage growth, a failover replica with a managed endpoint, and encryption at rest are all delivered by every major service without a database engineer touching them. For a team that would otherwise run these badly, the value is large; for a team that runs them well, the value is smaller but the opportunity cost of the engineers is still real.
The archive’s introductory posts set that context: understanding cloud-native databases, next-generation data management, the future of database technologies, what distributed SQL is, and understanding vector databases. from chaos to clarity and scalability for CTOs are the executive framing, and unlocking growth in CPG is one industry’s version of the same argument.
What the provider’s list does not include is anything above the engine: schema design, index strategy, query tuning, capacity forecasting, and the interpretation of the metrics the console shows. Those remain the customer’s, on every service, and they are where most DBaaS performance problems live.
What a DBaaS takes out of your hands: the relational services
The operator’s side of the ledger is service-specific, and the relational services differ more than their marketing suggests. On RDS for PostgreSQL and MySQL, the engine is the community engine with parameter groups exposing most settings, but there is no shell, no superuser, no custom extensions beyond the approved list, and no control over the storage layer beyond IOPS and volume type.
On Aurora the DBaaS trade goes further, because the storage engine is replaced: no innodb_flush_log_at_trx_commit trade, no double-write buffer, a 15-replica read tier, and a different failure model, which is why choosing between Amazon RDS and Aurora is a workload question, not a price one. RDS versus Aurora versus Aurora Serverless adds the capacity-unit model, where the cost of a scale-up is measured in seconds of latency during the resize.
-- what the managed service will not let you see, and what to ask for instead (PostgreSQL on RDS/Aurora)
-- no superuser: rds_superuser lacks file-system and some catalog rights
SELECT rolname, rolsuper, rolcreaterole, rolreplication FROM pg_roles WHERE rolname = current_user;

-- extension allow-list: anything not here needs a different service or a self-managed node
SELECT name, default_version, installed_version FROM pg_available_extensions ORDER BY name;

-- the parameters you can change are in the parameter group; the ones you cannot are pinned:
SELECT name, setting, context, source
FROM   pg_settings
WHERE  name IN ('shared_buffers', 'wal_level', 'max_wal_size', 'huge_pages', 'archive_mode', 'ssl');
Horizontal scale on a relational DBaaS is the customer’s problem, which building horizontally scalable RDS infrastructure covers with read replicas, connection routing and the application-side sharding that the service does not provide.
The replication mechanics underneath are unchanged from self-managed PostgreSQL, so mastering PostgreSQL replication still applies, as do the engine posts the archive includes for that reason: PostgreSQL 16 new features, PostgreSQL 18 asynchronous I/O, PostgreSQL VACUUM, bloom indexes, non-covering indexes, high-throughput bulk loading, ALTER TABLE ADD COLUMN and the “current transaction is aborted” error. A DBaaS PostgreSQL that is slow is still PostgreSQL that is slow.
On the MySQL side the same holds: optimizing Azure Database for MySQL is mostly InnoDB tuning through the server-parameters blade, and troubleshooting InnoDB write performance, MySQL transaction isolation levels, JSON functions in MySQL 8.0 and vectorized query processing in MySQL HeatWave are engine posts that apply on the managed service exactly as they do off it.
For MariaDB estates on a DBaaS, strategic MariaDB solutions and MariaDB thread contention troubleshooting cover the version and threading questions that the managed offerings expose differently. troubleshooting ProxySQL is the routing layer that a self-managed fleet uses in place of the provider’s endpoint.
What a DBaaS takes out of your hands: warehouses, document and vector services
Snowflake and Redshift move the ledger further toward the provider. There is no engine tuning in Snowflake at all; the levers are warehouse size, clustering keys, materialized views and the query itself, and optimizing query performance in Snowflake and the Snowflake performance consulting page set out what that leaves an engineer to do.
Redshift keeps more of the classic surface, distribution and sort keys, WLM queues and vacuum, which is why how suboptimal SQL inflates Redshift TCO is a cost post as much as a performance one, and mastering Redshift permissions covers the access model. MySQL to Redshift replication with Tungsten and using Kafka to replicate data are the ingestion paths, and Vertica index usage and troubleshooting is the comparison point for teams weighing a self-managed columnar store against the services.
MongoDB Atlas and Cosmos DB take the cluster topology and the backups, and leave the data model and the shard key, which is where their performance is decided. backing up and restoring collections in MongoDB Atlas covers what the managed backup does and does not restore, troubleshooting fragmented MongoDB platforms covers the estate that grew one cluster at a time, and the MongoDB wire protocol explains why a driver setting can matter more than a server one.
MongoDB versus PostgreSQL sharding and mastering Cassandra replication are the comparison posts, and Azure Cosmos DB performance covers the request-unit model, where throughput is bought per second and throttling is a 429 rather than a slow query.
Vector services are the newest column of the ledger and the least settled. sizing Milvus for performance, troubleshooting Milvus performance and custom Milvus plugins cover the index types, memory sizing and the plugin surface that a managed vector service typically hides, and memory contention in Redis is the in-memory-tier version of the same sizing question.
The DBaaS ledger, side by side
The table is the ledger for the services the archive covers most. “Kept” is what the operator still controls; “Taken” is what moves to the provider and cannot be changed; “Watch” is the item that most often surprises a team after migration. Entries are general to the service class and should be checked against the provider’s current documentation before a decision, since the boundaries move with each release.
| Service | Kept by the operator | Taken by the provider | Watch |
|---|---|---|---|
| RDS (PostgreSQL, MySQL) | Most engine parameters, schema, indexes, extensions from the allow-list | OS, shell, superuser, storage layer, patch timing within the window | IOPS ceiling per volume type; extension not on the list |
| Aurora | Schema, indexes, reader endpoint routing | Storage engine internals, redo/flush semantics, replica lag model | Behaviour differs from community engine under write-heavy load |
| Aurora Serverless v2 | ACU range, schema | Instance sizing, scaling timing | Latency during scale events; minimum ACU cost |
| Azure Database (MySQL, PostgreSQL) | Server parameters, schema | OS, storage tier, HA implementation | IOPS scaled with storage size; burstable tiers |
| Snowflake | Warehouse size, clustering, SQL | Engine, storage, caching, statistics | Credits consumed by idle warehouses and bad SQL |
| Redshift | Distribution/sort keys, WLM, SQL | Hardware, patching, backups | Vacuum and analyze still needed; TCO tracks query quality |
| MongoDB Atlas | Data model, shard key, indexes | Cluster topology, backups, upgrades | Shard key is permanent in practice |
| Cosmos DB | Partition key, RU allocation | Everything below the API | 429 throttling under RU pressure; per-partition limits |
| Managed vector (Milvus-class) | Collection schema, index type | Memory sizing, segment management | Recall versus latency trade is set by index parameters you may not see |
Reading DBaaS metrics: the console is the provider’s view
The second most common DBaaS support ticket we receive, after “it is slow”, is “the console says it is fine”. Both are true at once because the console reports what the provider is responsible for: CPU, storage throughput, connection count, replica lag, free memory. It does not report lock waits, plan regressions, bloat, or the query that runs ten thousand times a minute, because those are on the customer’s side of the line. The engine’s own instruments still exist on every DBaaS and are the only place those answers live.
-- what the console cannot tell you, on any managed PostgreSQL: the workload by total time
SELECT queryid,
       calls,
       round(total_exec_time::numeric / 1000, 1)        AS total_s,
       round(mean_exec_time::numeric, 2)                AS mean_ms,
       rows,
       left(query, 80)                                  AS query
FROM   pg_stat_statements
ORDER  BY total_exec_time DESC
LIMIT  15;

-- and the same on managed MySQL, from Performance Schema
SELECT digest_text, count_star, ROUND(sum_timer_wait / 1e12, 1) AS total_s,
       ROUND(avg_timer_wait / 1e9, 2) AS avg_ms
FROM   performance_schema.events_statements_summary_by_digest
ORDER  BY sum_timer_wait DESC
LIMIT  15;
Two DBaaS-specific habits follow from that. Enable the engine’s statement statistics on day one (pg_stat_statements is a parameter-group change on RDS and Aurora; Performance Schema is on by default on managed MySQL but its consumers are not), because a service that was fine for a year has no history when it stops being fine. And export the engine metrics to the same place as the console metrics, so a replica-lag alarm from the provider and a lock-wait alarm from the engine can be read on one timeline.
A DBaaS migration checklist
Moving a database onto a DBaaS, or between two of them, fails in predictable places, and the archive’s migration posts cluster around them. Parameter drift is first: the self-managed my.cnf or postgresql.conf holds settings the service pins or forbids, and the list of differences has to be produced and signed off before cutover, not discovered from a slow query afterwards. Extension and feature gaps are second, for PostgreSQL in particular.
Connection handling is third, because a DBaaS endpoint that fails over changes IP, and an application that caches DNS or holds long-lived pools reconnects late or not at all; ProxySQL-style routing on the application side is the usual answer.
The fourth failure is the replication bridge itself. Kafka-based replication and Tungsten to Redshift both need a rehearsed cutover with a measured lag and a rollback direction that has been tested, since the DBaaS side cannot be reached with the tools a self-managed rollback would use. The fifth is cost, which should be modelled on the post-migration query mix rather than the pre-migration data size; the Redshift TCO post above is the archive’s worked example of that gap.
Security and compliance on DBaaS: the shared-responsibility line
Every DBaaS provider publishes a shared-responsibility model and every audit finds the customer side of it under-served. Encryption at rest is the provider’s; key ownership, rotation and the audit trail of who read what are the customer’s, and transparent data encryption explains what TDE does and does not protect against. PostgreSQL threat modelling for FinTech is the method for deciding which controls matter for a regulated workload before the service is chosen.
For organisations whose regulator or customer will not accept a multi-tenant control plane at all, the answer is Bring Your Own Cloud: the database runs in the customer’s account and the operator runs it there. The BYOC database security standard sets out the controls MinervaDB applies in that model, which is the same model our managed services use, so the ledger’s “taken” column shrinks to patching and on-call while the data, keys and network stay with the customer.
The DBaaS decision method we use
Before a workload goes onto a DBaaS, or comes off one, we run the same four questions, and the archive has a post behind each.
First, what does the workload need that the service’s “taken” column removes? A workload that needs a specific extension, a custom storage layout, sub-millisecond commit latency with a durability trade, or a shard key that will change is a bad fit for the service that removes those. SQL performance anti-patterns is the checklist for the query-side needs that no service fixes.
Second, what will it cost at the size it will be in eighteen months, not today? Storage-scaled IOPS, per-replica pricing, credits and request units all grow non-linearly with the workload, and the Redshift TCO post above is the worked example of cost following query quality rather than data volume.
Third, how does it leave? A migration off Aurora, Cosmos DB or Snowflake is a project, not a restore, and the exit path should be written before entry. Kafka-based replication is the usual bridge for a live migration in either direction.
Fourth, who watches it? The console’s metrics are the provider’s view. profiling with Python 3.12 perf support is a reminder that the application side of a DBaaS latency problem is often where the time is, and it is invisible from the database console.
Version notes: the service boundaries above change with provider releases, and any specific claim about an extension list, a parameter’s availability or a scaling behaviour should be verified against the provider’s documentation on the day of the decision. Test the workload on the target service with production-shaped data before committing, and keep a DR posture that does not depend solely on the provider’s snapshot: a copy of the data in a form you can restore elsewhere is the only exit that is guaranteed to exist.
Where this DBaaS archive sits
This archive is the managed-service layer of minervadb.com. The cloud databases archive and cloud database infrastructure archive cover the platform work around the services, the Amazon RDS archive goes deeper on the largest of them, and the data warehousing archive covers Snowflake and Redshift on their own terms. The provider’s own statement of the boundary is the reference for each service; for AWS it is the Amazon RDS User Guide.
For a DBaaS selection, a cost review of an estate that has grown onto several services, or 24×7 support that covers the customer side of the shared-responsibility line, the MinervaDB database consulting practice runs this ledger against the real workload, and states for every recommendation which column of the table it comes from.