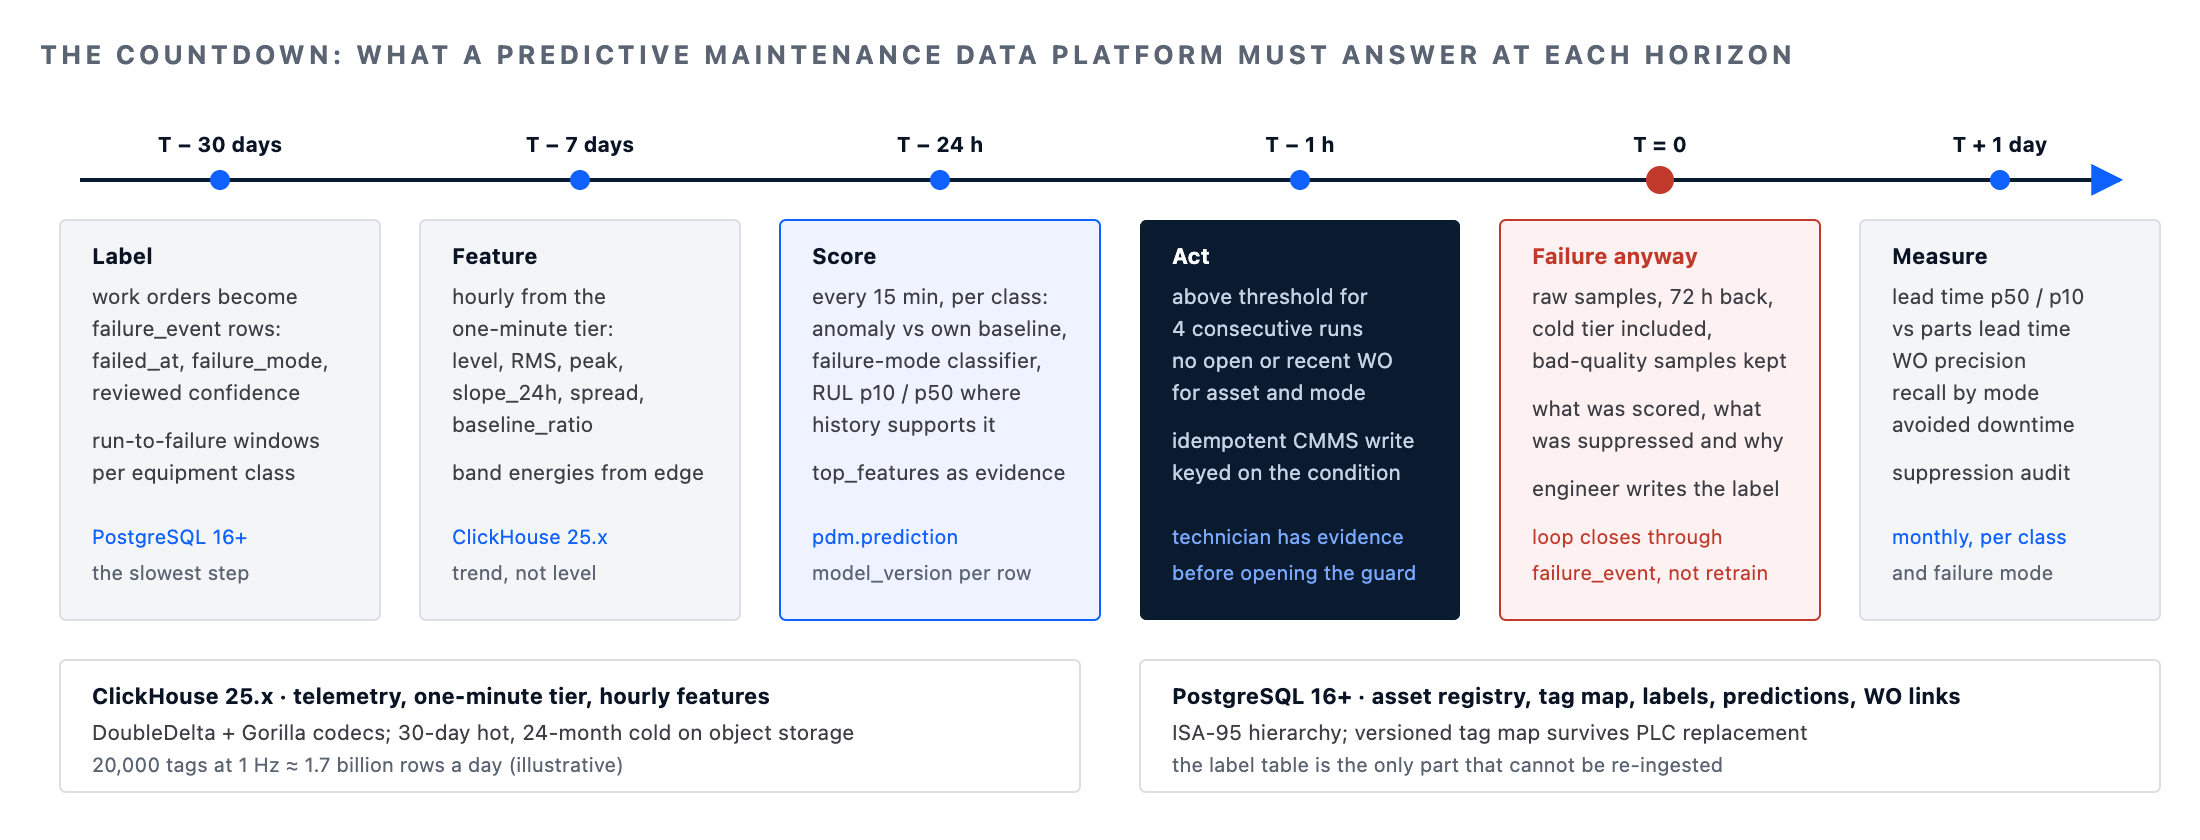
Every bearing that fails on a production line fails on a schedule the plant did not choose. The vibration signature starts to change weeks before, the temperature trend follows days before, the current draw spikes hours before, and then the line stops. A predictive maintenance data platform exists to move the plant's knowledge of that schedule earlier than the failure, and the honest way to describe one is as a countdown: what the platform must be able to answer thirty days out, a week out, a day out, an hour out, at the moment of failure, and the morning after.
This post walks a predictive maintenance data platform through that countdown. It is written for manufacturers who already have sensors, a historian and a maintenance system, and who have discovered that a model trained on a laptop from a CSV export does not become a production capability by being deployed. The gap is the platform: the asset model, the telemetry store, the failure labels, the feature pipeline, the scoring and work-order loop, and the measurement that says whether any of it earns its cost.
The reference stack is ClickHouse 25.x for sensor telemetry and feature computation, PostgreSQL 16 or later for the asset registry, failure labels, predictions and work-order integration, Kafka or MQTT for ingestion from the OT network, and Python for training and scoring. All figures are illustrative unless a measurement source is named, and every schema here is a starting point to be tested against your own historian before it goes near a production line.
Before the countdown: what a predictive maintenance data platform actually stores
Four kinds of data, in two stores. The asset registry, the failure and work-order history and the predictions are relational, low-volume and heavily joined, and live in PostgreSQL. The telemetry is high-rate, append-only and queried by time range and asset, and lives in ClickHouse. Putting telemetry in PostgreSQL is the most common way a predictive maintenance data platform stalls at pilot scale: twenty thousand tags at one hertz is 1.7 billion rows a day, and a row-store with a B-tree per index does not survive that for long.
The asset registry follows the ISA-95 equipment hierarchy, because that is how the plant already names things and because features and models are trained per equipment class, not per individual machine. A pump model learns from every pump of that class across every line; a per-machine model has too few failures to learn anything.
-- Predictive maintenance data platform asset registry: ISA-95 hierarchy with the equipment class models are keyed on
CREATE TABLE pdm.asset
(
    asset_id          TEXT      NOT NULL,
    site_id           TEXT      NOT NULL,
    area_id           TEXT      NOT NULL,
    line_id           TEXT      NOT NULL,
    equipment_class   TEXT      NOT NULL,     -- 'centrifugal_pump', 'gearbox', 'conveyor_motor'
    manufacturer      TEXT,
    model_code        TEXT,
    commissioned_on   DATE,
    cmms_equipment_no TEXT      NOT NULL,     -- the id the maintenance system knows it by
    CONSTRAINT asset_pk PRIMARY KEY (asset_id),
    CONSTRAINT asset_cmms_uq UNIQUE (cmms_equipment_no)
);

-- Tag map: which historian tag is which physical measurement on which asset, with validity
CREATE TABLE pdm.tag_map
(
    tag_name          TEXT      NOT NULL,     -- historian or OPC UA node id
    asset_id          TEXT      NOT NULL REFERENCES pdm.asset (asset_id),
    measurement       TEXT      NOT NULL,     -- 'vib_de_h', 'vib_nde_v', 'bearing_temp', 'motor_current'
    unit              TEXT      NOT NULL,
    sample_rate_hz    NUMERIC(8, 3) NOT NULL,
    valid_from        TIMESTAMPTZ NOT NULL,
    valid_to          TIMESTAMPTZ NOT NULL DEFAULT 'infinity',
    CONSTRAINT tag_map_pk PRIMARY KEY (tag_name, valid_from)
);
The tag map is the table everyone forgets and everyone needs. Historian tags get renamed when a PLC is replaced, and a predictive maintenance data platform that keys features on the raw tag name loses three years of history the day P-101_VIB_DE becomes PMP101.VibDE. Keying on asset and measurement, with the tag as a versioned alias, is what survives the PLC upgrade.
-- Predictive maintenance data platform telemetry: raw samples, time-series codecs, tiered by age, downsampled by MV
CREATE TABLE pdm.telemetry
(
    asset_id       LowCardinality(String),
    measurement    LowCardinality(String),
    ts             DateTime64(3, 'UTC') CODEC(DoubleDelta, ZSTD(1)),
    value          Float32              CODEC(Gorilla, ZSTD(1)),
    quality        UInt8                CODEC(ZSTD(1))         -- OPC quality code; bad samples are kept, flagged
)
ENGINE = MergeTree
PARTITION BY toYYYYMMDD(ts)
ORDER BY (asset_id, measurement, ts)
TTL toDateTime(ts) + INTERVAL 30 DAY TO VOLUME 'cold',      -- object storage after 30 days
    toDateTime(ts) + INTERVAL 24 MONTH DELETE
SETTINGS storage_policy = 'hot_cold', index_granularity = 8192;

-- One-minute aggregates that most features and every dashboard read instead of raw samples
CREATE TABLE pdm.telemetry_1m
(
    asset_id       LowCardinality(String),
    measurement    LowCardinality(String),
    minute         DateTime('UTC'),
    st             AggregateFunction(avg, Float32),
    mx             AggregateFunction(max, Float32),
    rms            AggregateFunction(avg, Float32),          -- avg of value squared; sqrt at read time
    n              AggregateFunction(count, UInt32)
)
ENGINE = AggregatingMergeTree
PARTITION BY toYYYYMM(minute)
ORDER BY (asset_id, measurement, minute);

CREATE MATERIALIZED VIEW pdm.telemetry_1m_mv TO pdm.telemetry_1m AS
SELECT
    asset_id, measurement,
    toStartOfMinute(ts)         AS minute,
    avgState(value)             AS st,
    maxState(value)             AS mx,
    avgState(value * value)     AS rms,
    countState()                AS n
FROM pdm.telemetry
WHERE quality = 0
GROUP BY asset_id, measurement, minute;
The codecs matter at this volume. DoubleDelta on a regular timestamp and Gorilla on a slowly changing float bring sensor telemetry to well under a byte per sample in our measurements on system.parts, which is what makes two years of raw retention affordable. The materialised view is what keeps the raw table out of most queries: a predictive maintenance data platform serves its features and dashboards from the one-minute tier and goes to raw samples only for forensics.
Thirty days out: labels, the hardest source a predictive maintenance data platform has
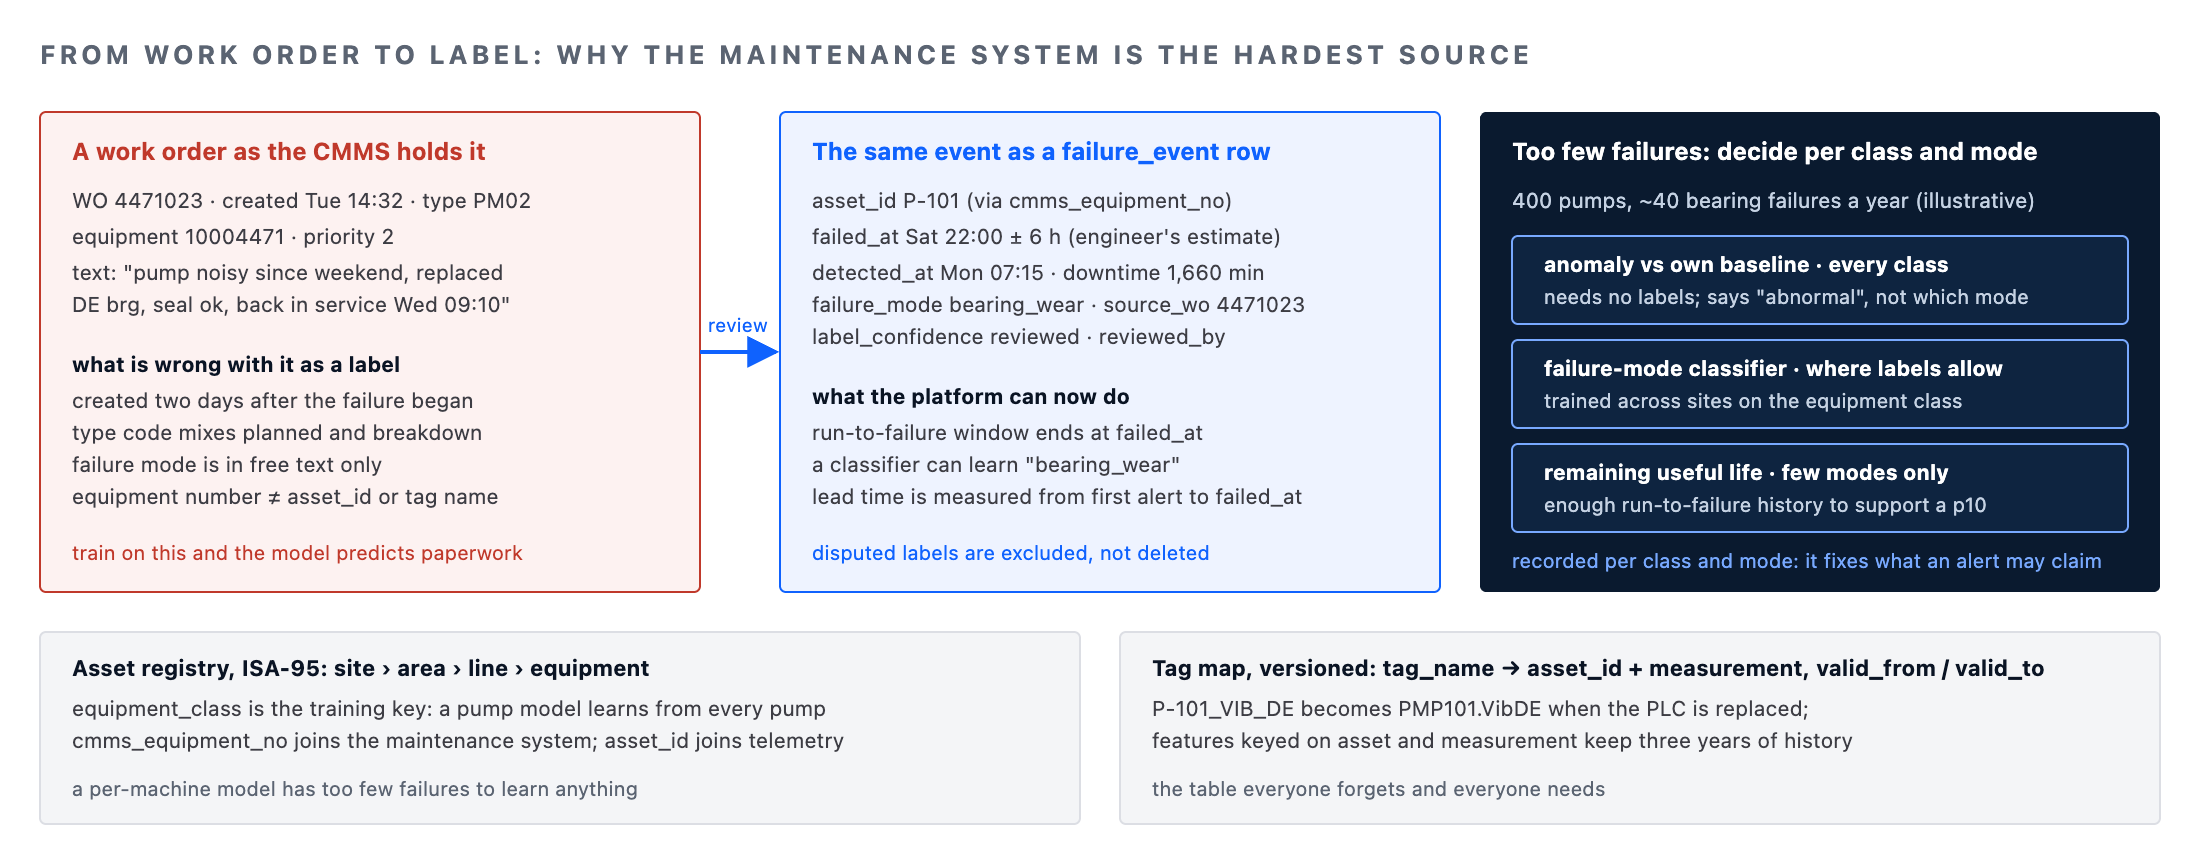
A month before a failure the platform's job is not prediction but preparation, and the preparation is labelling. Every model in a predictive maintenance data platform learns from the failures that have already happened, and the record of those failures lives in the CMMS as work orders: free-text, logged late, coded inconsistently and mixing planned replacements with breakdowns. Turning work orders into failure labels is the longest task in every engagement we have run, and no amount of modelling compensates for skipping it.
-- Predictive maintenance data platform labels: only unplanned, functional failures from work orders
CREATE TABLE pdm.failure_event
(
    event_id          BIGINT GENERATED ALWAYS AS IDENTITY,
    asset_id          TEXT        NOT NULL REFERENCES pdm.asset (asset_id),
    failed_at         TIMESTAMPTZ NOT NULL,     -- best estimate of functional failure, not the WO creation time
    detected_at       TIMESTAMPTZ NOT NULL,     -- when operations noticed
    failure_mode      TEXT        NOT NULL,     -- 'bearing_wear', 'seal_leak', 'winding_insulation', 'unknown'
    source_wo         TEXT        NOT NULL,     -- CMMS work order number
    label_confidence  TEXT        NOT NULL DEFAULT 'reviewed',
    downtime_minutes  INTEGER,
    reviewed_by       TEXT,
    CONSTRAINT failure_event_pk PRIMARY KEY (event_id),
    CONSTRAINT failure_event_conf_chk CHECK (label_confidence IN ('reviewed','inferred','disputed'))
);

-- Run-to-failure windows: the interval each asset was in service between consecutive failures
CREATE VIEW pdm.run_to_failure AS
SELECT
    asset_id,
    LAG(failed_at) OVER (PARTITION BY asset_id ORDER BY failed_at) AS run_start,
    failed_at                                                      AS run_end,
    failure_mode
FROM pdm.failure_event
WHERE label_confidence <> 'disputed';
Two columns carry the weight in a predictive maintenance data platform. failed_at is the engineer's estimate of when the equipment actually stopped doing its job, which is often hours or days before the work order was raised; training on the work-order timestamp teaches the model to predict paperwork. And failure_mode is what makes the platform useful rather than merely accurate: a prediction that says "something is wrong with pump P-101" sends a technician to look, a prediction that says "bearing wear on the drive end" sends a technician with a bearing.
Thirty days out is also when the class imbalance is confronted. A fleet of four hundred pumps produces perhaps forty labelled bearing failures a year. A predictive maintenance data platform therefore trains on equipment classes across sites, treats the problem as anomaly detection against each asset's own baseline where labels are too few, and only attempts remaining-useful-life estimation for the failure modes with enough history to support it. That decision is recorded per equipment class and failure mode, because it determines what an alert can honestly claim.
Seven days out: predictive maintenance data platform features that see the trend first
A week before failure, the signal is in the trend, not the level. Bearing vibration climbs slowly and the overall RMS may still be inside the alarm band the historian was configured with; what has changed is the slope, the spread and the energy in particular frequency bands. Features in a predictive maintenance data platform are therefore computed over rolling windows from the one-minute tier, per asset and measurement, and compared with the asset's own baseline rather than with a fleet-wide threshold.
-- Predictive maintenance data platform hourly features: level, spread, trend and baseline ratio over rolling windows
INSERT INTO pdm.features_hourly
WITH hourly AS
(
    SELECT
        asset_id, measurement,
        toStartOfHour(minute)          AS hour,
        avgMerge(st)                   AS level_1h,
        sqrt(avgMerge(rms))            AS rms_1h,
        maxMerge(mx)                   AS peak_1h,
        countMerge(n)                  AS samples_1h
    FROM pdm.telemetry_1m
    WHERE minute >= now() - INTERVAL 8 DAY
    GROUP BY asset_id, measurement, hour
)
SELECT
    h.asset_id, h.measurement, h.hour,
    h.level_1h, h.rms_1h, h.peak_1h, h.samples_1h,
    avg(h.level_1h) OVER (w ROWS BETWEEN 23  PRECEDING AND CURRENT ROW)   AS level_24h,
    avg(h.level_1h) OVER (w ROWS BETWEEN 167 PRECEDING AND CURRENT ROW)   AS level_7d,
    stddevPop(h.level_1h) OVER (w ROWS BETWEEN 23 PRECEDING AND CURRENT ROW) AS spread_24h,
    -- trend in units per hour over the last day: the earliest usable signal
    (h.level_1h - lagInFrame(h.level_1h, 23) OVER w) / 23                 AS slope_24h,
    -- ratio to the asset's healthy baseline, recomputed after its last overhaul
    h.level_1h / nullIf(b.baseline_level, 0)                              AS baseline_ratio
FROM hourly AS h
LEFT JOIN pdm.asset_baseline AS b
       ON b.asset_id = h.asset_id AND b.measurement = h.measurement
WINDOW w AS (PARTITION BY h.asset_id, h.measurement ORDER BY h.hour);
Spectral features in a predictive maintenance data platform, the band energies that distinguish an inner-race defect from an outer-race one, are computed at the edge from the raw waveform and arrive as their own measurements in the tag map, because shipping kilohertz waveforms to a central store is neither affordable nor necessary. The platform stores the band energies as it stores temperature: a measurement, a value, a timestamp, a quality.
The baseline is the underrated part. Every asset has a healthy signature that depends on its mounting, its load and its age, and the same RMS reading is alarming on one pump and normal on its neighbour. A predictive maintenance data platform keeps a per-asset baseline recomputed after every overhaul, and the feature that matters most in our experience is the ratio to that baseline, not the absolute level. The versioned feature table follows the same discipline as our feature store architecture post, with the offline table in ClickHouse and the latest values served from PostgreSQL.
Twenty-four hours out: scoring, and the table that lets a technician trust it
A day before failure the predictive maintenance data platform is scoring. The models are per equipment class: an anomaly score against the asset baseline for every class, a failure-mode classifier where labels allow it, and a remaining-useful-life estimate for the few modes with enough run-to-failure history. Scoring runs every fifteen minutes from the hourly features plus the latest one-minute values, and writes predictions to PostgreSQL, where the work-order integration and the technician's evidence view read them.
-- Predictive maintenance data platform predictions: model version plus the evidence a technician will ask for
CREATE TABLE pdm.prediction
(
    prediction_id     BIGINT GENERATED ALWAYS AS IDENTITY,
    asset_id          TEXT        NOT NULL REFERENCES pdm.asset (asset_id),
    scored_at         TIMESTAMPTZ NOT NULL,
    model_version     TEXT        NOT NULL,
    anomaly_score     NUMERIC(6, 4) NOT NULL,        -- 0..1 against the asset baseline
    failure_mode      TEXT,                          -- NULL when the class has no mode classifier
    mode_probability  NUMERIC(6, 4),
    rul_hours_p10     NUMERIC(10, 1),                -- remaining useful life, lower bound; NULL when not estimated
    rul_hours_p50     NUMERIC(10, 1),
    top_features      JSONB       NOT NULL,          -- the three features that drove the score, with values
    CONSTRAINT prediction_pk PRIMARY KEY (prediction_id),
    CONSTRAINT prediction_score_chk CHECK (anomaly_score BETWEEN 0 AND 1)
) PARTITION BY RANGE (scored_at);

CREATE INDEX prediction_asset_recent_idx ON pdm.prediction (asset_id, scored_at DESC);
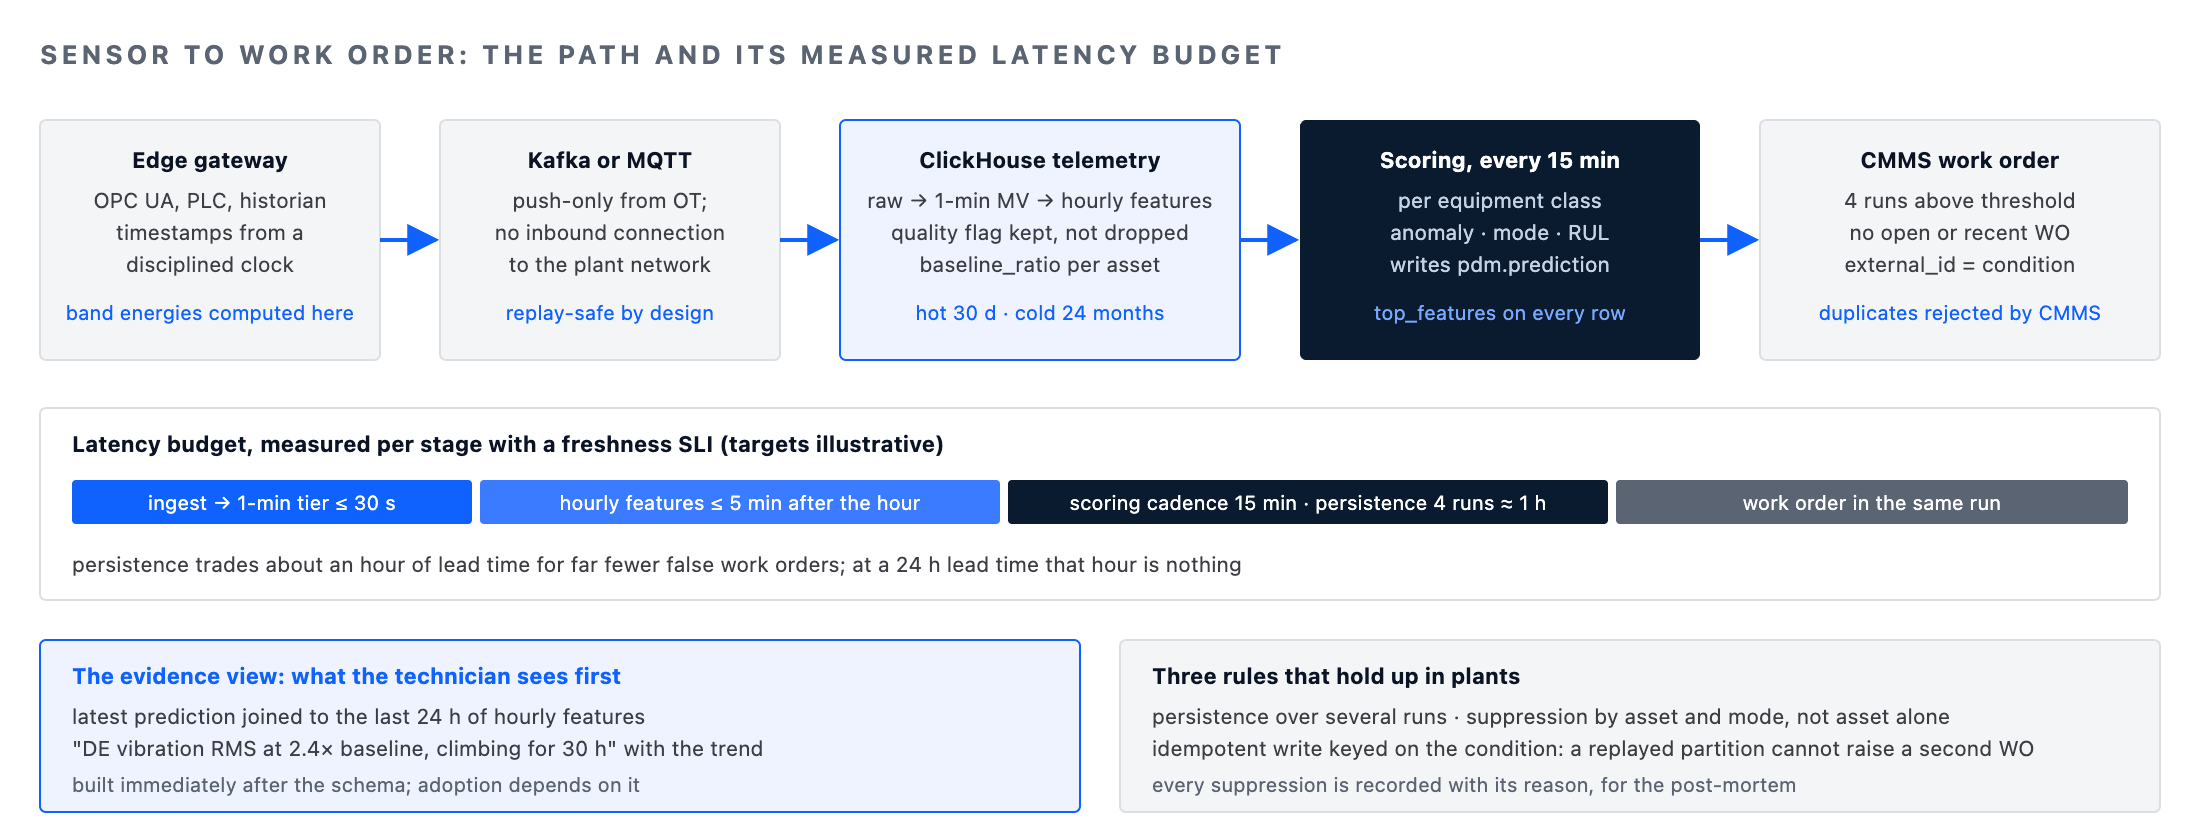
top_features is the column that decides whether the plant adopts the predictive maintenance data platform or ignores it. A technician sent to a pump on the strength of a 0.91 anomaly score wants to know that drive-end vibration RMS is at 2.4 times baseline and has been climbing for thirty hours, and wants to see that trend on the screen before opening the guard. The evidence view is a join of the latest prediction with the last twenty-four hours of hourly features, and it is the first thing we build after the schema.
One hour out: the predictive maintenance data platform raises a work order, once
An hour before failure, if the platform has done its job, the work order already exists and a technician is on the way. The step from prediction to work order is where a predictive maintenance data platform meets the plant's real operating constraints: a score above threshold on four consecutive runs is a stronger signal than one, a work order raised twice for the same condition wastes a planner's morning, and a work order raised for an asset already under maintenance is noise. The integration is therefore stateful and idempotent.
# Predictive maintenance data platform: prediction to work order with persistence, suppression and an idempotent write
from datetime import timedelta

THRESHOLD        = 0.85
PERSIST_RUNS     = 4                      # consecutive scoring runs above threshold before acting
SUPPRESS_WINDOW  = timedelta(days=14)     # no second WO for the same asset and mode inside this window

def evaluate(asset_id: str) -> None:
    recent = latest_predictions(asset_id, n=PERSIST_RUNS)
    if len(recent) < PERSIST_RUNS or min(p.anomaly_score for p in recent) < THRESHOLD:
        return
    mode = recent[0].failure_mode or "unclassified"
    condition_key = f"{asset_id}:{mode}:{recent[0].scored_at.date()}"

    if open_work_order_exists(asset_id) or recent_pdm_work_order(asset_id, mode, SUPPRESS_WINDOW):
        record_suppressed(asset_id, mode, reason="existing_or_recent_wo")
        return

    wo = create_cmms_work_order(                       # CMMS API; the external id makes the write idempotent
        equipment_no=cmms_equipment_no(asset_id),
        external_id=condition_key,
        priority=priority_for(recent[0].rul_hours_p10),
        description=f"PdM: {mode} indicated on {asset_id}; "
                    f"anomaly {recent[0].anomaly_score:.2f} for {PERSIST_RUNS} runs; "
                    f"evidence: {evidence_url(asset_id)}",
    )
    link_prediction_to_wo(recent[0].prediction_id, wo.number)
Three of those rules are worth defending. Persistence over several runs trades a few minutes of lead time for a large reduction in false work orders, and at a twenty-four-hour lead time a few minutes is nothing. Suppression by asset and failure mode, not by asset alone, lets a second, different condition still raise a work order. And the external id derived from the condition means a retried job, a replayed Kafka partition or a restarted scheduler cannot raise the same work order twice; the CMMS rejects the duplicate rather than the platform having to remember.
The latency budget through this section is measured, not assumed: ingest to the one-minute tier within thirty seconds, hourly features within five minutes of the hour, scoring every fifteen minutes, work order within the same run. The freshness indicators from our data quality SLOs post sit on each stage, because a predictive maintenance data platform whose features are six hours stale is quietly predicting the past.
The failure itself: forensics from the raw tier
Some failures happen anyway: a mode the model has never seen, a sensor that dropped out, a prediction that was suppressed by an open work order for something else. When they do, the platform's job is to make the post-mortem fast and the label correct. That is what the raw telemetry tier and its two-year retention are for: pulling every sample from every measurement on the asset for the seventy-two hours before failed_at, including the samples with bad quality codes, and putting them in front of the reliability engineer.
-- Predictive maintenance data platform forensics: raw samples before a labelled failure, cold tier included
SELECT measurement, ts, value, quality
FROM pdm.telemetry
WHERE asset_id = {asset:String}
  AND ts BETWEEN {failed_at:DateTime64} - INTERVAL 72 HOUR AND {failed_at:DateTime64} + INTERVAL 1 HOUR
ORDER BY measurement, ts
SETTINGS max_threads = 8;

-- What the platform said during that window, and whether anything was suppressed
SELECT p.scored_at, p.anomaly_score, p.failure_mode, p.rul_hours_p10, s.reason AS suppressed_reason
FROM pdm.prediction p
LEFT JOIN pdm.suppression s ON s.prediction_id = p.prediction_id
WHERE p.asset_id = {asset:String}
  AND p.scored_at BETWEEN {failed_at:TIMESTAMPTZ} - INTERVAL '72 hours' AND {failed_at:TIMESTAMPTZ}
ORDER BY p.scored_at;
The second query is the one that improves the predictive maintenance data platform over time. A failure the model scored high and the rules suppressed is a rules problem. A failure the model never scored is a features or labels problem, and the forensic samples become the next training example once the engineer has written the failure mode and the estimated failed_at into the event table. The loop closes through the label table, not through a retraining run.
The morning after: what a predictive maintenance data platform is measured on
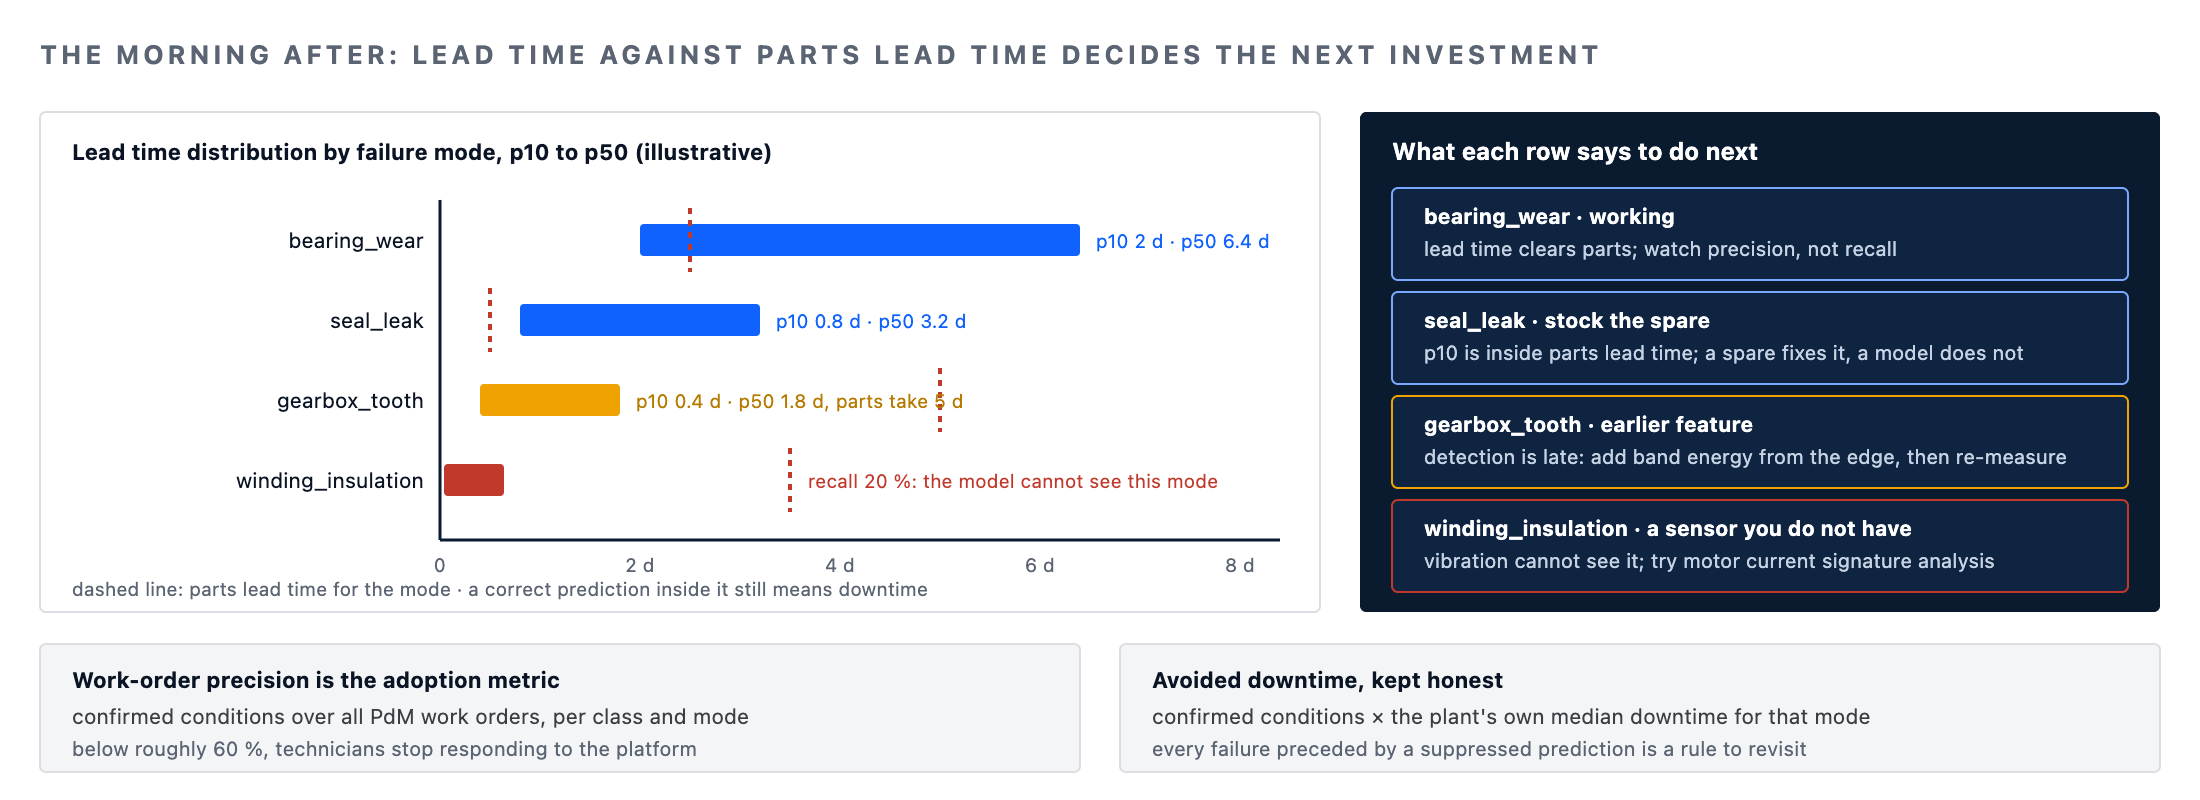
Accuracy metrics from the model registry do not persuade a plant manager of a predictive maintenance data platform. What persuades is lead time, precision at the work-order level and the cost of the two kinds of mistake, all computed monthly from the prediction, work-order and failure tables, per equipment class and failure mode.
| Measure | Computed from | Why it is the one the plant watches |
|---|---|---|
| Lead time, p50 and p10 | First persistent prediction above threshold to failed_at, per failure mode | Below the parts lead time, a correct prediction still means downtime |
| Work-order precision | PdM work orders where the technician confirmed the condition, over all PdM work orders | Below roughly 60 % technicians stop responding to the platform |
| Recall by mode | Failures with a persistent prediction in the 7 days before, over labelled failures | Reported per mode; a fleet-wide recall hides the modes the model cannot see |
| Avoided downtime | Confirmed conditions × historical median downtime for that mode | The number in the business case; kept honest by using the plant's own downtime history |
| Suppression audit | Failures preceded by a suppressed prediction | Every one is a rule to revisit, not a model to retrain |
Lead time is reported as a distribution and against the parts lead time for the mode, because a predictive maintenance data platform that predicts a gearbox failure eighteen hours out when the replacement takes five days to arrive has moved the downtime, not prevented it. That comparison, per mode, is what decides whether the next investment is a better model, a stocked spare, or a sensor the platform does not yet have.
Where a predictive maintenance data platform goes wrong
The failures we are brought in to fix are seldom in the model. Sensor clock drift across PLCs puts the vibration and temperature series minutes apart and destroys every cross-measurement feature; the fix is timestamping at the edge gateway from a disciplined clock, and a quality flag on samples whose clock offset is out of tolerance. Tag renames after a PLC replacement silently split an asset's history; the versioned tag map is the fix. Work orders logged days late with the creation time used as the failure time teach the model to predict paperwork; failed_at as a reviewed estimate is the fix.
An OT network that permits no inbound connections is not an obstacle if the predictive maintenance data platform is designed for a push-only edge from day one; it becomes one when that decision is made in month six.
Ongoing degradation after go-live, as machines age, loads change and sensors are replaced, is the territory of our model drift monitoring post; the per-asset baseline recomputed after every overhaul is the platform-side half of that discipline.
Working with MinervaDB on a predictive maintenance data platform
A predictive maintenance data platform is the central build in our manufacturing data analytics practice and draws on our data engineering and MLOps consulting teams: a typical engagement starts with the asset registry and tag map, lands the historian and OT feeds into the tiered telemetry store, spends the weeks it takes to turn work orders into reviewed failure labels, and delivers the first equipment class end to end, from features to work order, with the monthly measurement in place before the second class is started. The ISA-95 hierarchy is the naming we adopt unless the plant already has a better one.
Under managed operations the ingestion, feature and scoring stages run under our 24×7 teams with the standard S1 to S4 commitments, with a stalled telemetry feed on a scored equipment class treated as an S2. As always: test every schema, codec, feature and rule here against your own historian and maintenance history before applying them to production, keep the telemetry tiers and the label table under a tested restore posture, and treat the label table as the most valuable data the predictive maintenance data platform holds; it is the only part that cannot be re-ingested.
Running PostgreSQL in production? MinervaDB provides PostgreSQL consulting, 24×7 PostgreSQL support and PostgreSQL remote DBA services as part of its database consulting services.
Running this in production?
MinervaDB provides ClickHouse Consulting, Data Engineering Consulting, Data Analytics Platform Engineering and PostgreSQL Consulting with 24x7 coverage and a 15-minute S1 response. Talk to an engineer.