PostgreSQL slow query troubleshooting is rarely about a single bad query. In most production incidents we investigate at MinervaDB, the symptom — p95 latency creeping from 40 ms to 900 ms, application timeouts, connection pile-ups — is the visible edge of a measurable chain: a plan flip after a statistics change, an index that stopped being selective as data grew, or a workload shift that pushed the working set out of shared buffers.
This guide walks through the exact diagnostic sequence our remote DBA team uses on PostgreSQL 14 through 17: identify the offenders with pg_stat_statements, dissect them with EXPLAIN (ANALYZE, BUFFERS), fix the root cause, and verify the fix with the same instrumentation that found it.
PostgreSQL Slow Query Troubleshooting at a Glance
- Begin PostgreSQL slow query troubleshooting from aggregate evidence in
pg_stat_statements, never from anecdotes. - Turn the suspect statement into a measured plan with
EXPLAIN (ANALYZE, BUFFERS). - Separate plan problems from wait problems before changing anything.
- Apply one reversible change at a time, then re-measure with the same instrumentation.
- Effective PostgreSQL slow query troubleshooting ends with evidence, not with a hunch.
Step 1: Identify the Real Offenders with pg_stat_statements
Do not start from the query the application team blames. Start from aggregate evidence. pg_stat_statements normalizes queries and accumulates execution statistics, so it answers the question that matters: which statements consume the most total database time?
SELECT
    queryid,
    calls,
    ROUND(total_exec_time::NUMERIC, 1)          AS total_ms,
    ROUND(mean_exec_time::NUMERIC, 2)           AS mean_ms,
    ROUND(stddev_exec_time::NUMERIC, 2)         AS stddev_ms,
    rows,
    shared_blks_hit,
    shared_blks_read,
    ROUND(100.0 * shared_blks_hit /
        NULLIF(shared_blks_hit + shared_blks_read, 0), 2) AS hit_pct,
    LEFT(query, 80)                             AS query_head
FROM pg_stat_statements
ORDER BY total_exec_time DESC
LIMIT 20;
Read three signals together. High total_exec_time with low mean_exec_time means a cheap query called millions of times — an application-side caching or N+1 problem, not a plan problem. High mean_exec_time with high stddev_exec_time means bimodal behavior: the same statement is sometimes fast and sometimes slow, which points at plan instability, lock waits, or parameter-sensitive plans. A low hit_pct (below ~99% for OLTP) with high shared_blks_read tells you the query is doing real I/O, so the fix space includes indexing and shared_buffers sizing, not just SQL rewrites.
If pg_stat_statements is not yet installed, it requires shared_preload_libraries = 'pg_stat_statements' — a restart, not a reload. Schedule it in the next maintenance window; running production PostgreSQL without it is flying blind.
Step 2: Capture the Slow Plan with EXPLAIN (ANALYZE, BUFFERS)
Plan capture is the second pillar of PostgreSQL slow query troubleshooting: aggregate statistics tell you which statement hurts, while the plan tells you why.
Once you have a suspect queryid, reproduce it with realistic parameters and capture the executed plan, not the estimated one:
EXPLAIN (ANALYZE, BUFFERS, SETTINGS, WAL, FORMAT TEXT)
SELECT o.order_id, o.total_amount, c.customer_name
FROM orders AS o
JOIN customers AS c
    ON c.customer_id = o.customer_id
WHERE o.created_at >= NOW() - INTERVAL '7 days'
  AND o.status = 'pending'
ORDER BY o.created_at DESC
LIMIT 50;
BUFFERS is non-negotiable: it separates "slow because of I/O" from "slow because of CPU and row volume." On PostgreSQL 15+, SETTINGS prints any non-default planner settings in effect, which catches session-level overrides that make production behave differently from your psql session.
The four highest-yield findings in a plan, in the order we look for them:
Estimate skew. Compare rows= (estimate) against actual rows= at each node. A 100x mismatch is a statistics problem: run ANALYZE on the table, then raise per-column granularity where distributions are skewed:
ALTER TABLE orders
    ALTER COLUMN status SET STATISTICS 1000;
ANALYZE orders;
For correlated columns (e.g., country and city), PostgreSQL 10+ extended statistics fix cross-column estimate errors: CREATE STATISTICS stat_orders_geo (dependencies) ON country, city FROM orders;
Sequential scans on selective predicates. A Seq Scan with Rows Removed by Filter in the millions and a few hundred rows returned is an indexing gap. Confirm selectivity before creating anything — an index on a column where the predicate matches 30% of the table will be ignored, correctly.
Sort spills. Sort Method: external merge Disk: 148728kB means work_mem was insufficient for this node. Do not raise work_mem globally by reflex — it is allocated per sort/hash node per query, so 500 connections × several nodes can exhaust RAM. Raise it per role or per session for the reporting workload that needs it:
ALTER ROLE reporting_user SET work_mem = '256MB'; -- takes effect on next login, no reload needed
Nested Loop over a large outer set. A Nested Loop whose outer node produced 400,000 actual rows against an estimate of 12 is the classic plan-flip signature. Fix the estimate (statistics), and the join method fixes itself.
Step 3: Distinguish Plan Problems from Wait Problems
Most failed PostgreSQL slow query troubleshooting attempts stop here, tuning a plan that was never the real bottleneck.
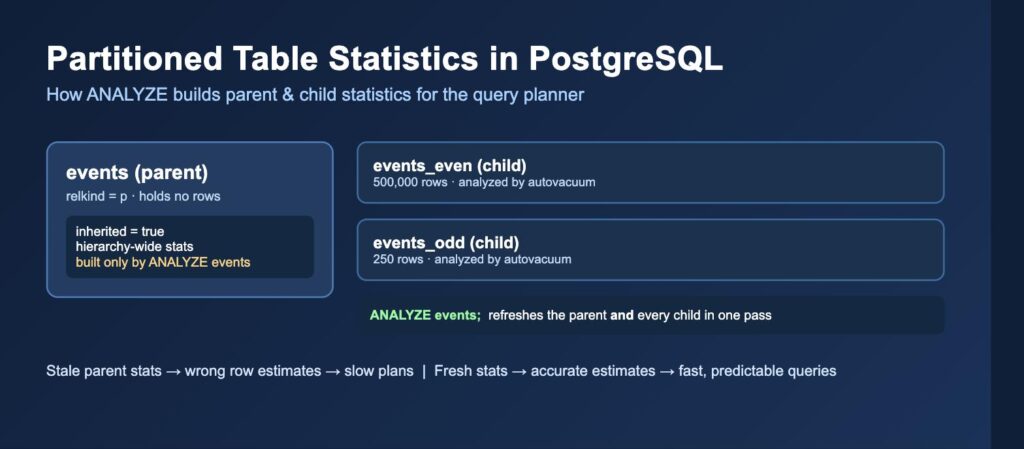
If EXPLAIN ANALYZE in isolation is fast but production is slow, the query is waiting, not working. Sample pg_stat_activity during the incident window:
SELECT
    pid,
    wait_event_type,
    wait_event,
    state,
    NOW() - query_start AS query_age,
    LEFT(query, 60) AS query_head
FROM pg_stat_activity
WHERE state <> 'idle'
ORDER BY query_start;
wait_event_type = 'Lock' points at blocking (chase it through pg_blocking_pids(pid)); 'IO' with DataFileRead confirms storage pressure; 'LWLock' on buffer_content or WALWriteLock under heavy write load is a checkpoint/WAL tuning conversation, not a SQL rewrite. Each of these has a different owner and a different fix — attributing lock waits to "slow SQL" wastes days.
Step 4: Apply the Fix — Staged and Reversible
PostgreSQL slow query troubleshooting only pays off when the fix is applied in small, reversible increments.
Every corrective action on a production database needs a blast-radius statement and a rollback path. The three most common fixes, done safely:
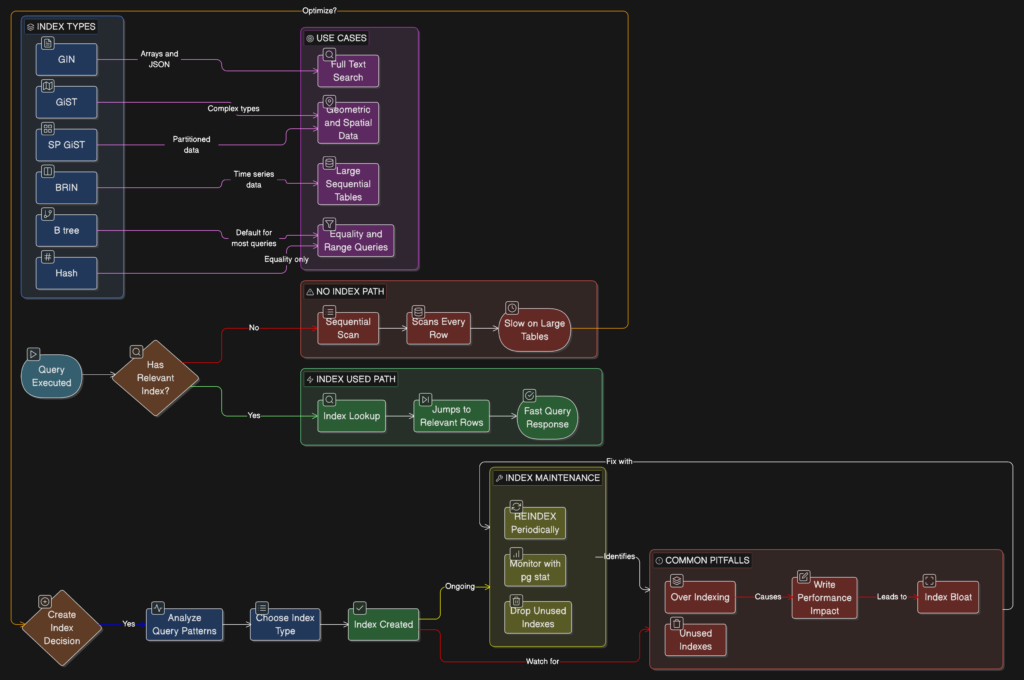
Index creation. Always CONCURRENTLY in production — it avoids the exclusive lock at the cost of a longer build and cannot run inside a transaction block:
CREATE INDEX CONCURRENTLY idx_orders_status_created_at
    ON orders (status, created_at DESC)
    WHERE status = 'pending';
The partial-index predicate keeps the index small when the hot query always filters on one status value. Verify it is actually used before declaring victory (Step 5), and check pg_stat_user_indexes.idx_scan after a week; an unused index is pure write amplification. Rollback path: DROP INDEX CONCURRENTLY idx_orders_status_created_at; — non-blocking, safe at any time.
Statistics changes. ALTER ... SET STATISTICS plus ANALYZE is cheap, immediate, and reversible by resetting to the previous target. It should almost always be attempted before any SQL rewrite when estimates are the problem.
Planner parameters. On SSD/NVMe storage, the default random_page_cost = 4 systematically biases the planner against index scans. Proposed change: random_page_cost from 4 (default) to 1.1, unitless, reload-only (SELECT pg_reload_conf();). Test the specific regressed queries under the new value with SET random_page_cost = 1.1; in a session first — this is a global bias adjustment and can shift plans you were not looking at.
Step 5: Verify with the Same Instrumentation
Verification closes the loop: PostgreSQL slow query troubleshooting is not finished until the same counters that exposed the problem confirm the improvement.
A fix is not done until the metric that identified the problem confirms it is gone. Reset the counters for a clean before/after window:
SELECT pg_stat_statements_reset();
-- wait one representative traffic cycle, then:
SELECT calls,
       ROUND(mean_exec_time::NUMERIC, 2) AS mean_ms,
       shared_blks_read
FROM pg_stat_statements
WHERE queryid = 8437221592817264921;
You are looking for three confirmations: mean_exec_time down to target, shared_blks_read collapsed (the new index turned reads into hits), and — in the fresh EXPLAIN (ANALYZE, BUFFERS) — the estimate and actual row counts within the same order of magnitude. If you tuned work_mem, confirm the sort node now reports Sort Method: quicksort Memory: instead of external merge.
Reading BUFFERS Like a Storage Engineer
Buffer accounting is where PostgreSQL slow query troubleshooting turns from guesswork into measurement.
The Buffers: lines in an ANALYZE plan carry more diagnostic content than most teams extract. shared hit versus read is the cache story per node — but note that read means "not in shared_buffers," which on Linux often still lands in the OS page cache; genuinely cold reads reveal themselves only in I/O Timings (enable track_io_timing = on, reload, low overhead on modern clocks), where 40,000 reads at 0.02 ms each is page-cache warm and the same count at 0.8 ms each is real disk.
temp read/written is the spill ledger — any non-zero value means work_mem was exceeded by a sort, hash, or materialize node, and on PostgreSQL 15+ you can watch live spill activity fleet-wide in pg_stat_statements.temp_blks_written and per-database in pg_stat_database.temp_bytes.
dirtied and written in a read query surprise people: a SELECT that dirties thousands of buffers is setting hint bits on freshly loaded rows — the signature of querying a large table shortly after bulk load before vacuum has passed, and the fix is a post-load VACUUM (ANALYZE) step in the pipeline, not query tuning.
For parallel plans, remember buffer counts aggregate across workers while actual time is per-worker wall time multiplied out at the Gather node; a plan that "reads 2 GB" across six workers is doing 340 MB each, which reframes whether the I/O volume is actually the problem. When a plan's numbers don't add up, check loops= — every per-node figure is a per-loop average, and a node showing 3 ms × 12,000 loops is your 36 seconds, hiding in plain sight inside an innocuous-looking Nested Loop inner side.
When Slow Queries Are a Symptom, Not the Disease
Sometimes PostgreSQL slow query troubleshooting ends in a configuration or capacity decision rather than a query rewrite.
Recurring slow-query incidents across unrelated statements usually indicate a system-level cause: autovacuum falling behind (dead-tuple ratios inflate every scan), checkpoint storms (correlate latency spikes with checkpoints_timed vs checkpoints_req in pg_stat_bgwriter), or connection churn overwhelming the backend fork model (fix with PgBouncer transaction pooling, not more max_connections). If your slow-query list changes every week, stop tuning queries and profile the platform.
Catching Intermittent Slowness: auto_explain in Production
Intermittent regressions are the hardest case in PostgreSQL slow query troubleshooting, because the slow execution is gone before anyone can inspect it.
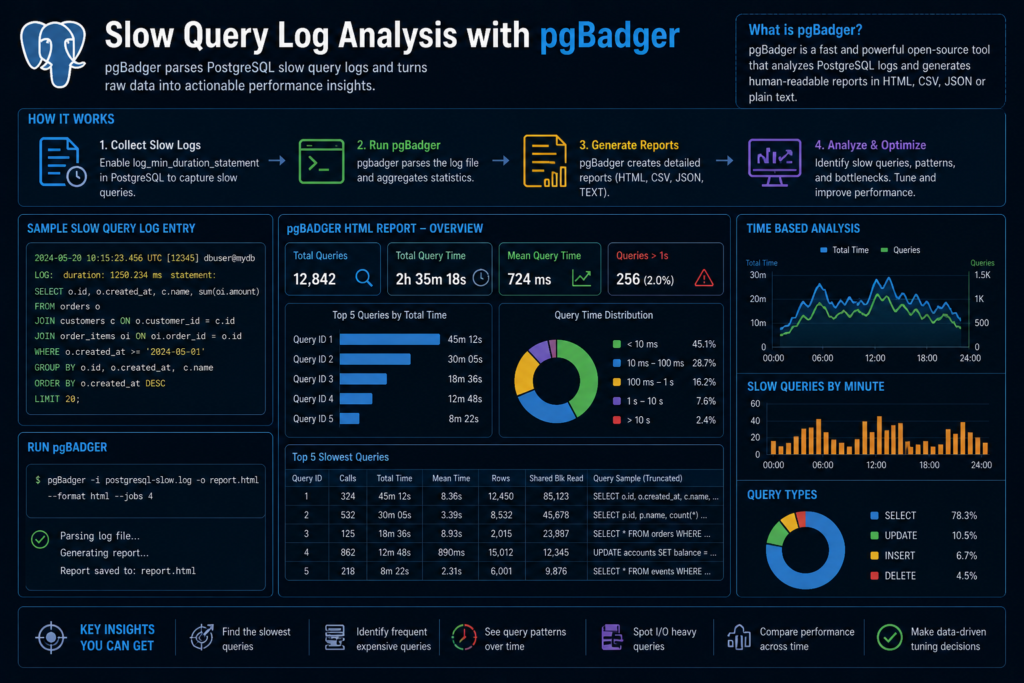
The hardest class of slow query is the one you cannot reproduce: fast in psql, fast in staging, slow for ninety seconds at 14:07 yesterday. Interactive EXPLAIN is useless there because the plan you get now is not the plan that ran then. auto_explain closes that gap by logging the actual executed plan of any statement crossing a duration threshold:
-- postgresql.conf (reload if loaded via session_preload_libraries;
-- restart if added to shared_preload_libraries)
session_preload_libraries = 'auto_explain'
auto_explain.log_min_duration = '500ms'
auto_explain.log_analyze      = on
auto_explain.log_buffers      = on
auto_explain.log_timing       = on
auto_explain.log_nested_statements = on
auto_explain.sample_rate      = 1.0
Two operational cautions. log_analyze with log_timing adds per-node clock overhead to every statement that qualifies for logging consideration on some platforms — on high-throughput OLTP, start with auto_explain.sample_rate = 0.1 and a threshold well above your p99 so only genuine outliers pay the cost, then tighten during the investigation window. And log_nested_statements is essential when the slow unit is a PL/pgSQL function: without it you see the function call, not the statement inside it that regressed.
When the intermittent plan lands in the log, diff it against the interactive plan: in the majority of cases we investigate, the difference is a parameter value (skewed key), a generic plan, or a statistics window — each with a distinct fix below.
Plan Cache Pathologies: Generic Plans and plan_cache_mode
Prepared-statement behaviour is a frequently missed branch of PostgreSQL slow query troubleshooting.
Prepared statements — which include everything an ORM or JDBC driver prepares implicitly — follow PostgreSQL's custom-vs-generic plan heuristic: the first five executions use custom plans built for the actual parameters, after which the planner may switch to a cached generic plan if its estimated cost compares favorably. When parameter skew is high (one tenant owns 40% of rows; a status value matches half the table), the generic plan is catastrophically wrong for the skewed values, and you get the signature bimodal latency: identical statement, 3 ms for most parameters, 4 s for the whale. Diagnose by comparing plans for both parameter classes:
PREPARE q (BIGINT) AS
SELECT order_id, total_amount
FROM orders
WHERE customer_id = $1
  AND status = 'pending';

EXPLAIN (ANALYZE, BUFFERS) EXECUTE q (42);        -- typical customer
EXPLAIN (ANALYZE, BUFFERS) EXECUTE q (1817);      -- whale customer
-- PostgreSQL 12+: check which plan type ran
SELECT name, generic_plans, custom_plans
FROM pg_prepared_statements;
Fixes, least invasive first: raise statistics targets so the generic-plan cost estimate reflects the skew; set plan_cache_mode = force_custom_plan for the affected role (PostgreSQL 12+, per-role via ALTER ROLE ... SET, effective next login) accepting re-plan CPU on every execution; or restructure the hot path so whale tenants take a dedicated query shape. Fleet-wide force_custom_plan is rarely justified — measure the re-planning overhead in pg_stat_statements (rising plan-time share on 17+, which separates total_plan_time) before and after.
Join Order, CTE Materialization, and the Limits of Hints
PostgreSQL slow query troubleshooting works with the planner rather than against it, because PostgreSQL deliberately omits query hints.
When estimates are correct but the plan is still poor, the usual suspects are search-space limits and materialization barriers. Above join_collapse_limit / from_collapse_limit (default 8 relations), the planner stops exhaustively ordering joins — ten-table reporting queries can land in a mediocre order simply because the good one was never considered. Raising both to 12 for the reporting role is a contained experiment (session or role scope, no reload); watch planning time, which grows combinatorially.
Since PostgreSQL 12, CTEs are inlined by default rather than materialized, which removed the old optimization-fence folklore — but the fence is still available and occasionally correct: WITH heavy AS MATERIALIZED (...) forces one evaluation of an expensive subquery referenced multiple times, while NOT MATERIALIZED guarantees inlining when the planner's heuristic guesses wrong. Both directions are legitimate tools; both belong in code review with a captured plan justifying them, because they hard-code today's data shape into tomorrow's query.
PostgreSQL ships no optimizer hints by design; pg_hint_plan exists and works, and our position after years of production use is narrow: acceptable as a tourniquet during an incident, with a tracked ticket to remove it by fixing statistics or schema — never as a standing architecture. Hinted plans silently rot as data grows, and they mask the estimation defect you actually need to fix.
Parallel Query: When the Planner Won’t, and When It Shouldn’t
Parallelism is a late-stage lever in PostgreSQL slow query troubleshooting, useful only after the plan shape is already correct.
"Why isn't this scan parallel?" has a short checklist.
The planner declines parallelism when the table is under min_parallel_table_scan_size (default 8 MB — rarely the issue), when the estimated total cost falls under parallel_setup_cost + parallel_tuple_cost math (raise neither casually; they encode real worker startup and tuple-transfer overhead), when the query touches anything parallel-restricted (writes into the query itself pre-15, certain functions not marked PARALLEL SAFE — audit yours in pg_proc.proparallel), or when the worker pool is exhausted: max_parallel_workers_per_gather caps per query, max_parallel_workers caps the instance, and EXPLAIN ANALYZE shows the truth in Workers Planned: 4 Workers Launched: 1 — a launch shortfall means concurrent queries drained the pool, and the fix is capacity arithmetic, not per-query settings.
The inverse failure is subtler and more expensive: OLTP systems where mid-sized index scans go parallel under load, each query seizing workers and multiplying context switches for a 15% single-query win that becomes a fleet-wide throughput loss. For transactional roles we routinely set max_parallel_workers_per_gather = 0 at the role level and reserve parallelism for the reporting role — per-role planner posture via ALTER ROLE is one of the most underused tuning surfaces in PostgreSQL.
Verify either direction the same way: pg_stat_statements mean time for the affected statement family, plus instance-level context-switch and CPU-run-queue trends from node metrics across the change window.
PostgreSQL Slow Query Troubleshooting Quick Reference
| Symptom | Evidence Source | Likely Root Cause | First Fix |
|---|---|---|---|
| High total_exec_time, low mean | pg_stat_statements | N+1 / excessive call volume | Application caching, batching |
| Estimate vs actual off by 100x | EXPLAIN ANALYZE | Stale or insufficient statistics | ANALYZE; raise statistics target |
| Seq Scan, millions removed by filter | EXPLAIN (ANALYZE, BUFFERS) | Missing/partial index gap | CREATE INDEX CONCURRENTLY |
| External merge sort on disk | EXPLAIN (ANALYZE, BUFFERS) | work_mem too small for node | Per-role work_mem raise |
| Fast in psql, slow in production | pg_stat_activity wait events | Lock waits / I/O saturation | pg_blocking_pids; storage review |
PostgreSQL Slow Query Troubleshooting FAQ
Where should PostgreSQL slow query troubleshooting start? Always with aggregate evidence. PostgreSQL slow query troubleshooting that starts from a single anecdotal statement usually optimises the wrong thing.
How long does PostgreSQL slow query troubleshooting take? With pg_stat_statements and auto_explain already enabled, most cases resolve in one session; without instrumentation, expect to spend the first day just collecting evidence.
Is PostgreSQL slow query troubleshooting different on managed services? The method is identical on RDS, Aurora, Cloud SQL and Azure Database for PostgreSQL; only the way you enable extensions and read logs changes.
Does EXPLAIN ANALYZE run the query for real? Yes — including writes. Wrap DML in BEGIN; EXPLAIN ANALYZE ...; ROLLBACK; when analyzing UPDATE/DELETE statements on production.
Why does the planner ignore my new index? Three usual reasons: the predicate is not selective enough (a Seq Scan is genuinely cheaper), stale statistics hide the selectivity, or random_page_cost is overpricing index access on SSD storage. Check in that order.
What overhead does pg_stat_statements add? Typically low single-digit percent CPU; measured overhead in most OLTP fleets we operate is under 2%. The diagnostic value outweighs it in every production system we have assessed.
How is pg_stat_statements different from log_min_duration_statement? The log threshold captures individual slow executions with full parameter values; pg_stat_statements aggregates normalized statements over time. Use logs for forensic detail on one incident, the extension for identifying systemic offenders. Run both.
Should I use auto_explain? Yes for intermittent slowness: auto_explain.log_min_duration captures the actual plan of the slow execution — the only reliable way to catch a plan flip that you cannot reproduce interactively. It requires loading via shared_preload_libraries or session_preload_libraries.
PostgreSQL Slow Query Troubleshooting Checklist
Run through this list before escalating. It covers the prerequisites that make PostgreSQL slow query troubleshooting possible at all:
pg_stat_statementsloaded and reset timestamps recorded — the baseline every PostgreSQL slow query troubleshooting session compares against.auto_explainconfigured with a sanelog_min_durationso intermittent cases are captured.- Wait-event sampling available, so PostgreSQL slow query troubleshooting can separate plan cost from contention.
- Statistics targets and autovacuum health reviewed before any index is added.
- One change per iteration, with a rollback path written down.
- Post-change verification captured in the same tooling that started the PostgreSQL slow query troubleshooting investigation.
Wrapping Up: A Repeatable PostgreSQL Slow Query Troubleshooting Method
Treat PostgreSQL slow query troubleshooting as a measurement loop rather than a bag of tricks. Aggregate statistics point at the statement, the plan explains the cost, wait events reveal contention, and a single reversible change followed by re-measurement proves the outcome.
Teams that write this loop down turn PostgreSQL slow query troubleshooting into a routine operational task instead of an emergency. Keep pg_stat_statements and auto_explain enabled, record a baseline before every change, and revisit the loop after each major version upgrade so your PostgreSQL slow query troubleshooting runbook stays accurate.
Further Reading on PostgreSQL Slow Query Troubleshooting
The official documentation is the authoritative reference for every tool used in this PostgreSQL slow query troubleshooting workflow:
- Using EXPLAIN — how the planner reports estimated and actual costs.
- pg_stat_statements — the aggregate statement statistics extension.
- auto_explain — capturing plans for intermittently slow queries.
- Cumulative Statistics and Wait Events — separating plan problems from contention.
- PostgreSQL Wiki: Slow Query Questions — the checklist the community expects before triage.
Get Expert PostgreSQL Performance Help
MinervaDB's PostgreSQL consulting and 24×7 remote DBA teams troubleshoot production slow-query incidents daily across PostgreSQL 12 through 17, on-premises and on every major cloud. If your team is fighting recurring latency regressions, plan instability, or capacity questions, talk to us: minervadb.com/contact-us or contact@minervadb.com.
As with all performance changes: validate every index, parameter, and statistics change in a staging environment that mirrors production data volumes before applying it to production, and ensure your backup and disaster-recovery posture is tested and current before any maintenance activity.
Running this in production?
MinervaDB provides PostgreSQL Consulting, PostgreSQL Support and PostgreSQL Remote DBA with 24x7 coverage and a 15-minute S1 response. Talk to an engineer.