Every InnoDB performance problem that reaches a support queue is a transaction waiting somewhere it should not be. The statement was parsed, the plan was fine, and yet the commit took forty milliseconds instead of two. The forty milliseconds are not spread evenly across the engine: they sit at one of eight wait points between the moment a row is touched and the moment its bytes are durable on disk, and each wait point has its own counter, its own configuration knobs and its own failure signature.
This page walks the InnoDB write path as a sequence of those eight wait points, in the order a transaction meets them. For each one it names the metric that shows the wait, the setting that governs it, and the archive post that goes deeper. It is the map MinervaDB engineers use when an InnoDB support ticket says “MySQL is slow” and nothing more, because the first job on such a ticket is to find which of the eight points the time is being spent at, and the second job is to prove it with a counter before changing anything.
The archive it introduces covers the engine from the buffer pool and its eviction algorithm through row locks, the history list, the redo and binary logs, the doublewrite buffer, checkpoints, the flush method and the I/O subsystem, together with the Performance Schema instrumentation that makes each of them visible.
Wait point 1 of InnoDB: the buffer pool page is not in memory
The first thing a statement needs is the page holding the row, and the first wait is a buffer pool miss. InnoDB reads the page from the tablespace into the pool, evicting another page if the pool is full. The counter is Innodb_buffer_pool_reads against Innodb_buffer_pool_read_requests; a miss ratio above one percent on a warm server means the working set does not fit or the eviction policy is being defeated by scans.
The archive’s treatment of this layer starts with how InnoDB implements buffer pool eviction, the midpoint-insertion LRU that keeps a full-table scan from flushing hot pages, and continues with why a bigger buffer pool is not always better for recovery, which is the trade most teams miss: a larger pool means more dirty pages to flush at a checkpoint and a longer crash recovery. reducing block access and the InnoDB high water mark cover the read side of the same pool.
Data types decide how many rows fit on a 16 KB page and therefore how many pages a query touches; choosing InnoDB data types for performance is the archive’s post on that, and InnoDB data structures: B-trees and the adaptive hash index explains what a page actually holds.
Wait point 2 of InnoDB: the row is locked by another transaction
Once the page is in memory, the statement needs the row, and the second wait is a lock. InnoDB row locks are held until commit under REPEATABLE READ, gap locks extend them to ranges, and a long-running transaction can block a queue of short ones behind it. The evidence is Innodb_row_lock_waits and Innodb_row_lock_time_avg, and the live picture is in performance_schema.data_lock_waits (MySQL 8.0+; information_schema.INNODB_LOCK_WAITS in 5.7).
This is the archive’s largest cluster. InnoDB locking: balancing performance and consistency is the entry point; the InnoDB lock mechanism across DML, DDL and internal locks separates row locks from metadata locks and the internal mutexes; InnoDB concurrency control mechanisms covers MVCC and the read view. the transaction isolation levels deep dive explains why READ COMMITTED removes most gap-lock waits at the cost of phantom reads.
Deadlocks are the lock wait that ends in an error rather than a delay. resolving error 1213 and error 1205 is the operational guide, and user-level locks to prevent deadlocks shows the application-side pattern that serialises the hot rows before InnoDB has to. troubleshooting flush locks covers the lock that FLUSH TABLES WITH READ LOCK takes and the backups that hold it too long.
Wait point 3 of InnoDB: the undo log and the history list
Every row change writes an undo record so that older read views can still see the previous version. The third wait is not a wait in the transaction’s own path but a debt it leaves behind: undo records accumulate in the history list until the purge threads clear them, and a long-open read view stops purge entirely. The metric is the history list length in SHOW ENGINE INNODB STATUS or information_schema.INNODB_METRICS (trx_rseg_history_len); a history list in the millions means secondary index lookups are walking long version chains and every query is slower.
tuning InnoDB history list performance is the archive’s post on purge lag and innodb_purge_threads, and COMMIT, ROLLBACK and SAVEPOINT in InnoDB explains why a rollback of a large transaction is more expensive than its commit: the undo records have to be applied in reverse.
Wait point 4 of InnoDB: the redo log and log_sys mutex
The change is written to the redo log buffer, and at commit the buffer is written and, depending on innodb_flush_log_at_trx_commit, fsynced. This is the fourth wait, and on a write-heavy server it is often the largest. The counters are Innodb_os_log_fsyncs, Innodb_log_waits (the buffer was too small and a transaction waited for a flush), and in the Performance Schema the wait/synch/mutex/innodb/log_sys_mutex and log_flush_order_mutex instruments (MySQL 8.0 reworked the log writer into dedicated threads, so the mutex names differ from 5.7).
log file synchronisation in InnoDB is the archive’s post on the durability setting and its latency cost, and InnoDB log growth and CPU spikes covers the case where a redo log too small for the write rate forces aggressive flushing and the checkpoint age stays pinned near the limit. innodb_redo_log_capacity (MySQL 8.0.30+) replaced the fixed two-file layout and should be sized so that an hour of peak writes fits.
-- where a write-heavy InnoDB server is waiting, from the counters it keeps (MySQL 8.0+)
SELECT name, count
FROM   information_schema.innodb_metrics
WHERE  name IN ('buffer_pool_reads', 'buffer_pool_read_requests',
                'lock_row_lock_waits', 'lock_row_lock_time_avg',
                'trx_rseg_history_len',
                'log_waits', 'os_log_fsyncs',
                'buffer_flush_adaptive_total_pages', 'buffer_flush_background_total_pages',
                'os_data_fsyncs', 'os_data_writes')
ORDER  BY name;

-- the same story from the wait instruments, ranked by time (enable the instruments first)
SELECT event_name,
       count_star,
       ROUND(sum_timer_wait / 1e12, 3) AS total_s,
       ROUND(avg_timer_wait / 1e9, 3)  AS avg_ms
FROM   performance_schema.events_waits_summary_global_by_event_name
WHERE  event_name LIKE 'wait/synch/%innodb%'
   OR  event_name LIKE 'wait/io/file/innodb/%'
ORDER  BY sum_timer_wait DESC
LIMIT  15;
Reading the two result sets side by side is the diagnostic: a high log_waits with a high os_log_fsyncs is the redo path; high lock_row_lock_waits with a low fsync count is contention; high buffer_pool_reads is the working set. The archive’s posts on the instrumentation itself are monitoring wait events in MySQL 8 with the Performance Schema, unravelling query execution with the Performance Schema, and InnoDB performance monitoring with statistics and forecasts.
Wait point 5 of InnoDB: the binary log and group commit
With log_bin on, the commit also writes the binary log, and the two logs are kept consistent by a two-phase commit whose serialisation point is MYSQL_BIN_LOG::LOCK_commit. Group commit batches concurrent commits behind one fsync, and binlog_group_commit_sync_delay trades a few hundred microseconds of latency for a much larger batch. The fifth wait shows in the Performance Schema as time on the LOCK_commit and LOCK_log mutexes and in Binlog_commits versus Binlog_group_commits.
the impact of the LOCK_commit mutex is the archive’s post, and the topology posts explain the versions of the same commit path that replication imposes: InnoDB Cluster write performance and InnoDB Cluster limitations and troubleshooting with the Performance Schema cover Group Replication’s certification wait, and Group Replication versus Galera compares it with Galera’s synchronous certification, which is a different wait at the same point.
Wait point 6 of InnoDB: dirty pages, the doublewrite buffer and the checkpoint
The transaction has committed, but the page it changed is still dirty in the buffer pool. The sixth wait is deferred to the flush: the page cleaner threads write dirty pages through the doublewrite buffer to the tablespace, and the checkpoint advances as they go. When the checkpoint falls too far behind the redo log head, InnoDB switches from adaptive flushing to synchronous flushing and every transaction stalls until the page cleaners catch up. That stall is the “the server freezes for two seconds every minute” ticket.
The metrics are the checkpoint age against innodb_redo_log_capacity, Innodb_buffer_pool_pages_dirty, buffer_flush_sync_total_pages in INNODB_METRICS (any non-zero growth is a stall), and innodb_io_capacity versus the IOPS the storage can actually deliver. InnoDB indirect I/O waits and the checkpoint process is the archive’s post on this wait, tuning InnoDB variables for thread performance covers the page cleaner and I/O thread settings, and how context switches influence InnoDB performance explains why more threads is not always more throughput.
Wait point 7 of InnoDB: the flush method and the file system
Every write above eventually becomes a system call, and the seventh wait is how that call reaches the disk. innodb_flush_method decides whether data files bypass the OS page cache (O_DIRECT, the usual choice, so that the buffer pool is not duplicated in kernel memory) and whether fsync is replaced by O_DSYNC for the log. The wrong choice shows as a server that is simultaneously short of memory and slow on I/O.
configuring innodb_flush_method is the archive’s post on the setting, and troubleshooting InnoDB I/O subsystem reads covers the read side, where innodb_read_ahead_threshold and the linear read-ahead can help a scan or hurt a random workload. Version note: since MySQL 8.0.4 O_DIRECT is the default on Linux when the file system supports it; earlier releases default to fsync, and a server upgraded in place keeps whatever its configuration file says.
Wait point 8 of InnoDB: the statement itself
The eighth wait point is the one that is not InnoDB’s fault: a statement that touches more rows, pages or index entries than it needs to. The engine can only be as fast as the plan asks it to be, and the archive’s query-shaped posts belong here. seek and scan costs and statistics management explains the cost model and innodb_stats_persistent; the read efficiency of SELECT queries and InnoDB INSERT performance cover the two directions of the same rule.
parallel query tuning across multiple CPUs is the reminder that a single MySQL statement runs on one thread, so the parallelism has to come from the application. recursive self-joins with CTEs (MySQL 8.0+) and handling intense and diverse SQL workloads at the parser are the two edges of the statement layer, and error 2013: connection lost is what the client sees when any of the eight waits exceeds a timeout.
The eight InnoDB wait points, side by side
| Wait point | Counter or instrument | Governing setting | Typical signature |
|---|---|---|---|
| 1. Buffer pool miss | Innodb_buffer_pool_reads / read_requests |
innodb_buffer_pool_size, old-blocks split |
Slow after restart or after a large scan; disk reads climb |
| 2. Row lock | Innodb_row_lock_waits, data_lock_waits |
Isolation level, transaction length, index on the predicate | Queue of short transactions behind one long one; 1205 / 1213 |
| 3. History list | trx_rseg_history_len |
innodb_purge_threads, open read views |
Everything slows gradually; one idle-in-transaction session |
| 4. Redo log | Innodb_log_waits, Innodb_os_log_fsyncs |
innodb_flush_log_at_trx_commit, innodb_redo_log_capacity |
Commit latency tracks disk fsync latency |
| 5. Binary log | LOCK_commit mutex, Binlog_group_commits |
sync_binlog, binlog_group_commit_sync_delay |
Commit latency with idle disk; small group commits |
| 6. Checkpoint stall | buffer_flush_sync_total_pages, checkpoint age |
innodb_io_capacity, page cleaners, log capacity |
Periodic freezes of one to several seconds |
| 7. Flush method | wait/io/file/innodb/* |
innodb_flush_method |
Memory pressure plus I/O latency at the same time |
| 8. The statement | Handler_read_*, rows examined vs sent |
Plan, index, statistics | Every wait above, multiplied by an unnecessary factor |
Figures in the signatures column are typical shapes rather than thresholds; the thresholds come from the workload’s own baseline, which is why the archive’s monitoring posts insist on keeping history.
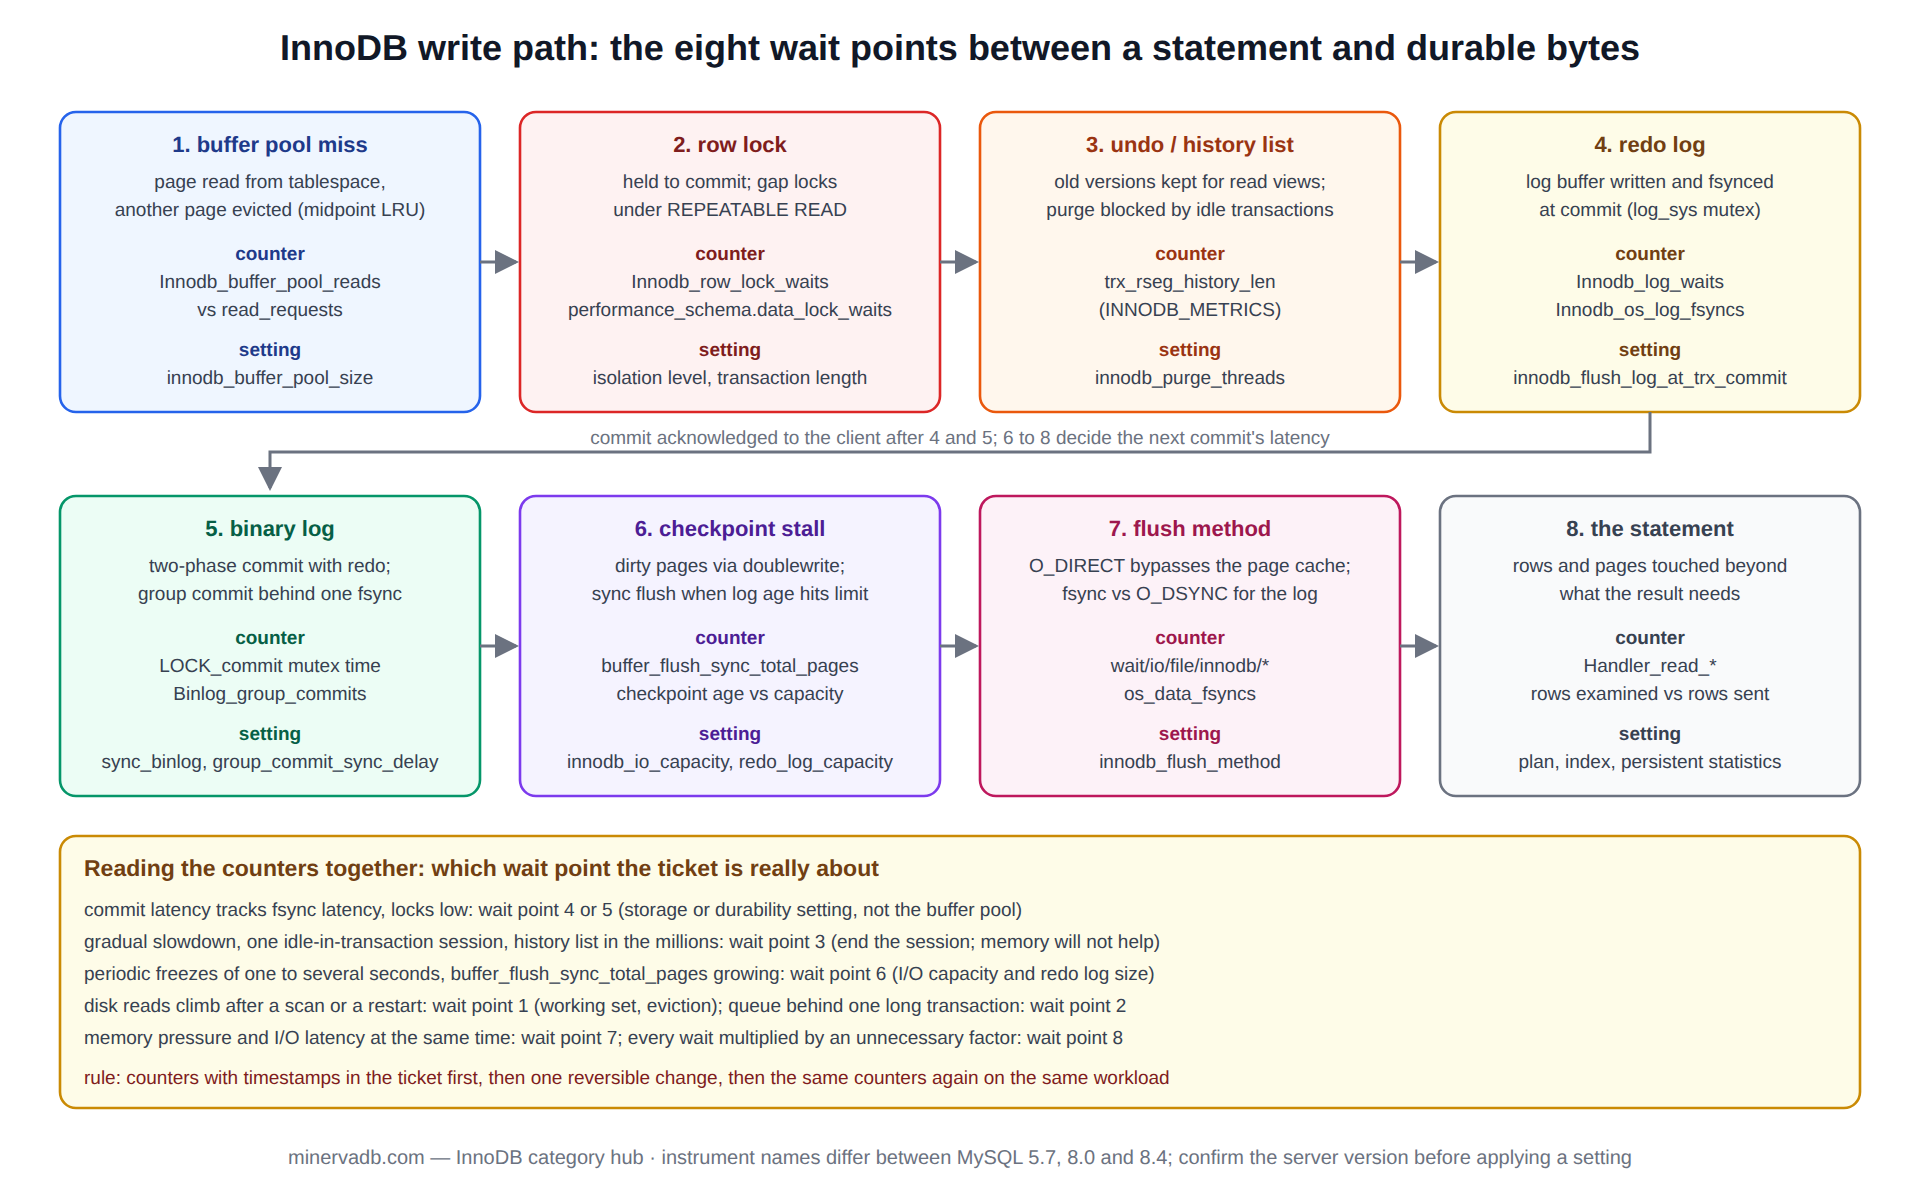
How an InnoDB support ticket is worked from this map
The order matters. A ticket is worked from the counters outward, never from a guess inward, because most of the eight waits produce the same customer-visible symptom and only the instrumentation tells them apart. The first fifteen minutes on an S1 are spent collecting: the two queries above, SHOW ENGINE INNODB STATUS, the top statements by total latency from events_statements_summary_by_digest, and the process list grouped by state. Nothing is changed until those four results are in the ticket with timestamps.
The second step is to match the pattern against the table. Commit latency that tracks fsync latency is wait point 4 or 5 and the answer is storage or the durability setting, not the buffer pool. A gradual slowdown with one idle session is wait point 3 and the answer is to end that session, not to add memory. Periodic freezes are wait point 6 and the answer is I/O capacity and redo log sizing, with the caveat from the recovery post that a bigger buffer pool makes the same stall longer.
The third step is a single reversible change, measured against the same counters. Every change to a running InnoDB server has a blast radius: innodb_flush_log_at_trx_commit and sync_binlog change what survives a crash, innodb_buffer_pool_size is resizable online (MySQL 5.7+) but the resize itself holds a latch, and innodb_flush_method needs a restart. The rollback is the previous value, written into the ticket before the change is applied, and the verification is the same query run after the change, on the same workload, not a different one.
What an InnoDB engagement with MinervaDB looks like
The InnoDB support practice at MinervaDB is built on this map rather than on a checklist of settings, because settings without a wait point to justify them are guesses. An engagement usually starts with a baseline: a week of the counters above at one-minute resolution, the digest table snapshotted daily, and the redo log and checkpoint age trended so that the flush behaviour is visible before it stalls. From there the recommendations are ranked by which wait point they remove and by how much of the total latency that point accounts for.
The posts on why that measurement discipline matters for the customer are why internet companies trust MinervaDB for open-source database operations, and the practice’s 24×7 SLA culture (S1 in 15 minutes, S2 in 12 hours, S3 in 24 hours, S4 in 48 hours) is what makes the “collect before changing” rule affordable at 3 a.m.: the collection is scripted, so it costs the engineer minutes, not the customer hours.
Version notes: the wait points are the same in MySQL 5.7, 8.0 and 8.4 and in MariaDB’s InnoDB, but the instrument names, the redo log configuration (innodb_log_file_size before 8.0.30, innodb_redo_log_capacity after) and the default flush method differ by release; confirm the exact server version before applying any setting from an archive post. Test every change on a replica or a staging copy with production-shaped load first, and keep a restore-tested backup and a DR posture in place before touching durability settings.
Where this InnoDB archive sits
This archive is the storage-engine layer under the MySQL performance archive, which covers the seven-stage latency budget of a whole query, and beside the MySQL Group Replication archive and Percona XtraDB Cluster archive, which describe what wait point 5 becomes in a cluster. The monitoring archive covers the collection discipline on the PostgreSQL side of the estate. The authoritative reference for every setting named here is the InnoDB chapter of the MySQL Reference Manual.
For an InnoDB performance review, a durability and replication audit, or 24×7 support that works tickets from counters rather than guesses, the MinervaDB database consulting practice starts from this map, and states for every recommendation which of the eight wait points it removes.