Supabase FinOps comes down to one uncomfortable fact: the Spend Cap that most teams treat as their budget control does not cover the line items that make up most of a mature Supabase bill. Compute, read replicas, preview branches, IPv4 addresses, point-in-time recovery and log drains keep billing by the hour whether the cap is on or off. Organizations that overspend on Supabase rarely do so because of one runaway meter; they do so because nobody owns the uncapped lines, nobody measures cost per user, and compute gets upsized every time a query gets slow.
This guide sets out how Supabase pricing actually assembles into an invoice, the mistakes that recur most often in production estates, the signals that tell you that you are overspending, and the ten metrics a Supabase FinOps practice should watch, with the SQL, scheduler jobs and Prometheus queries to measure each one. Prices quoted are list prices from the Supabase pricing page and usage documentation, verified in October 2026. Supabase changes its packaging regularly, so re-check them before you build a budget on them.
Supabase Pricing: How the Invoice Is Actually Built
A Supabase bill has five layers, and they behave very differently. The organization pays a plan fee (Pro from $25 a month, Team from $599). Usage quotas such as monthly active users, egress, storage, Realtime messages and Edge Function invocations are pooled across every project in that organization. Compute is not pooled: every project runs its own Postgres instance, billed per hour from Micro ($0.01344 per hour, roughly $10 a month) to 16XL ($5.12 per hour, roughly $3,730 a month). Paid plans include a $10 compute credit per organization, not per project, and on a paid organization a Nano instance is billed at the Micro rate.
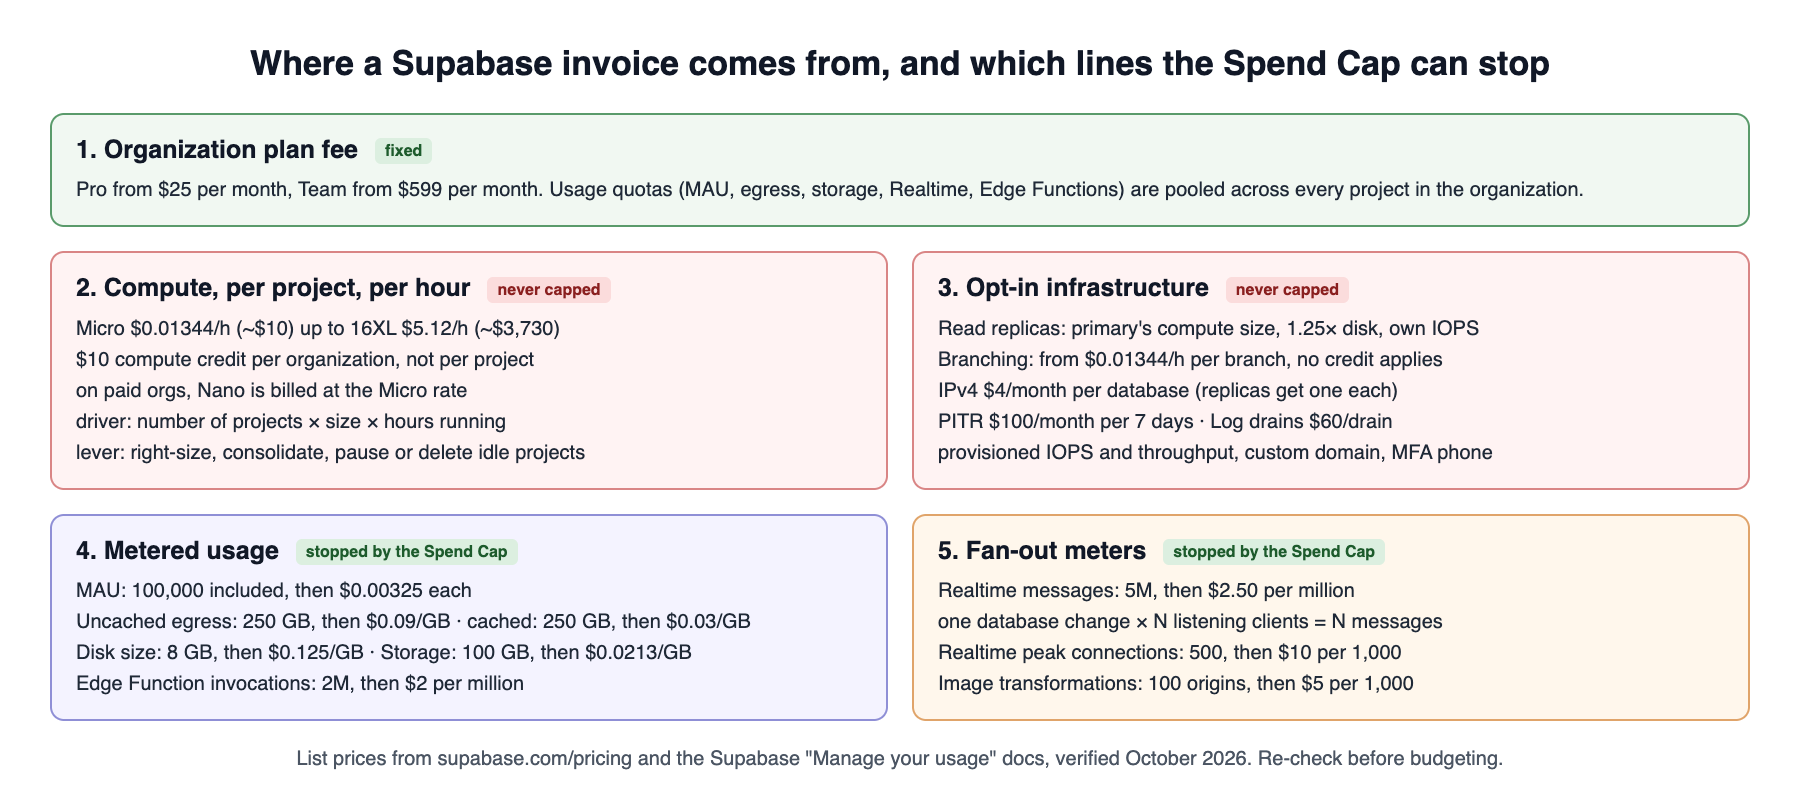
The distinction that matters for Supabase billing is the one in Figure 1. According to the Supabase cost control documentation, the Spend Cap stops metered usage (disk size, egress, MAU, Realtime, Edge Functions, storage, image transformations, log ingest). It explicitly excludes compute, branching compute, read replica compute, custom domains, provisioned IOPS and throughput, IPv4, log drains, phone MFA and point-in-time recovery, because those are items the customer opts into. The cap also offers no per-item budgets and no cost alerts. In practice, the larger the estate, the larger the share of spend that sits outside the cap.
A worked Supabase pricing example (illustrative)
Consider a common shape for a growing product team: one production project on XL compute, a staging project on Small, three persistent preview branches left running all month, one read replica, IPv4 enabled on the primary, seven days of PITR and one log drain. Using list prices:
| Line item | Basis | Monthly | Stopped by Spend Cap? |
|---|---|---|---|
| Pro plan | organization fee | $25.00 | n/a |
| Production compute (XL) | $0.2877/h × 730 h | $210.00 | No |
| Staging compute (Small) | $0.0206/h × 730 h | $15.00 | No |
| Compute credit | per organization | −$10.00 | n/a |
| Three preview branches (Micro) | 3 × 730 h × $0.01344 | $29.43 | No |
| Read replica (XL) | same size as primary, no credit | $210.00 | No |
| IPv4 | primary + replica, $4 each | $8.00 | No |
| PITR, 7 days | $100 per 7 days | $100.00 | No |
| Log drain | $60 per drain | $60.00 | No |
| Total before any usage overage | $647.43 | 96% uncapped |
Replica disk (1.25 times the primary disk, billed from the first byte) adds a little more. The point is not the total; it is that $622 of the $647 carries on regardless of the Spend Cap setting. Supabase FinOps therefore starts with ownership of the uncapped lines, not with the usage meters.
Eight Supabase FinOps Mistakes Developers Make Repeatedly
1. Treating the Spend Cap as a budget
The cap protects a hobby project from a surprise egress bill. It does nothing for a team running replicas, branches and PITR, and it cannot alert anyone. A Supabase FinOps practice therefore puts budget alerting outside the platform, fed by the usage page, the upcoming invoice estimate and your own telemetry.
2. Project sprawl and forgotten compute
Each project is its own instance, and the $10 credit is consumed by the first one. Demo projects, abandoned experiments and per-customer proof-of-concept projects each bill compute every hour they exist. Billing is hourly with partial hours rounded up, and it stops only when a project is paused or deleted. A current project inventory is therefore the first Supabase FinOps control.
3. Persistent preview branches
Branching is billed per branch hour from $0.01344, the compute credit does not apply, and the Spend Cap does not cover it. Persistent branches survive after the pull request closes. Ephemeral branches that are merged and deleted are cheap; persistent branches nobody remembers are not. Branch lifecycle belongs in the Supabase FinOps runbook, not in anyone’s memory.
4. Upsizing compute instead of fixing queries
This is the most expensive mistake in absolute dollars. When p95 latency climbs, the dashboard makes a one-click move from Large ($110) to 2XL ($410) easy, adding $300 a month per project, plus the same again on every replica. A sequential scan on a missing index, an RLS policy that calls a function per row, or an N+1 pattern from the client will usually come back after the upsize. Supabase cost optimization begins in pg_stat_statements, not in the compute picker.
5. Selecting every column, every row
The PostgREST pattern select('*') with no range returns every column, including JSONB blobs and embeddings, to every client. Supabase meters uncached egress at $0.09 per GB beyond 250 GB. The egress itself is often modest; the compute spent serializing wide rows is not. The Supabase cost optimization here is a client-side change:
// Before: wide payload, exact count forces a full COUNT(*) on every call
const { data, count } = await supabase
  .from('orders')
  .select('*', { count: 'exact' })

// After: only the columns the screen renders, bounded page, planner estimate for the pager
const { data: page, count: approx } = await supabase
  .from('orders')
  .select('id, status, total_cents, created_at', { count: 'estimated' })
  .eq('customer_id', customerId)
  .order('created_at', { ascending: false })
  .range(0, 49)
6. Realtime fan-out without filters
Supabase counts one Realtime message per client listening to a database change, and a broadcast counts once sent plus once per receiver. A table with 1,000 changes an hour and 10,000 subscribed clients generates 7.2 billion messages a month, roughly $18,000 at $2.50 per million above the 5 million quota (illustrative arithmetic, list price). For Supabase FinOps, Realtime design is a cost decision: filter Postgres Changes subscriptions to the rows a client needs, or move high-fan-out paths to Broadcast channels scoped per room or tenant.
// Subscribe to one room, not the whole messages table
const channel = supabase
  .channel('room-42')
  .on(
    'postgres_changes',
    { event: 'INSERT', schema: 'public', table: 'messages', filter: 'room_id=eq.42' },
    (payload) => render(payload.new)
  )
  .subscribe()
7. Letting disk ratchet upward
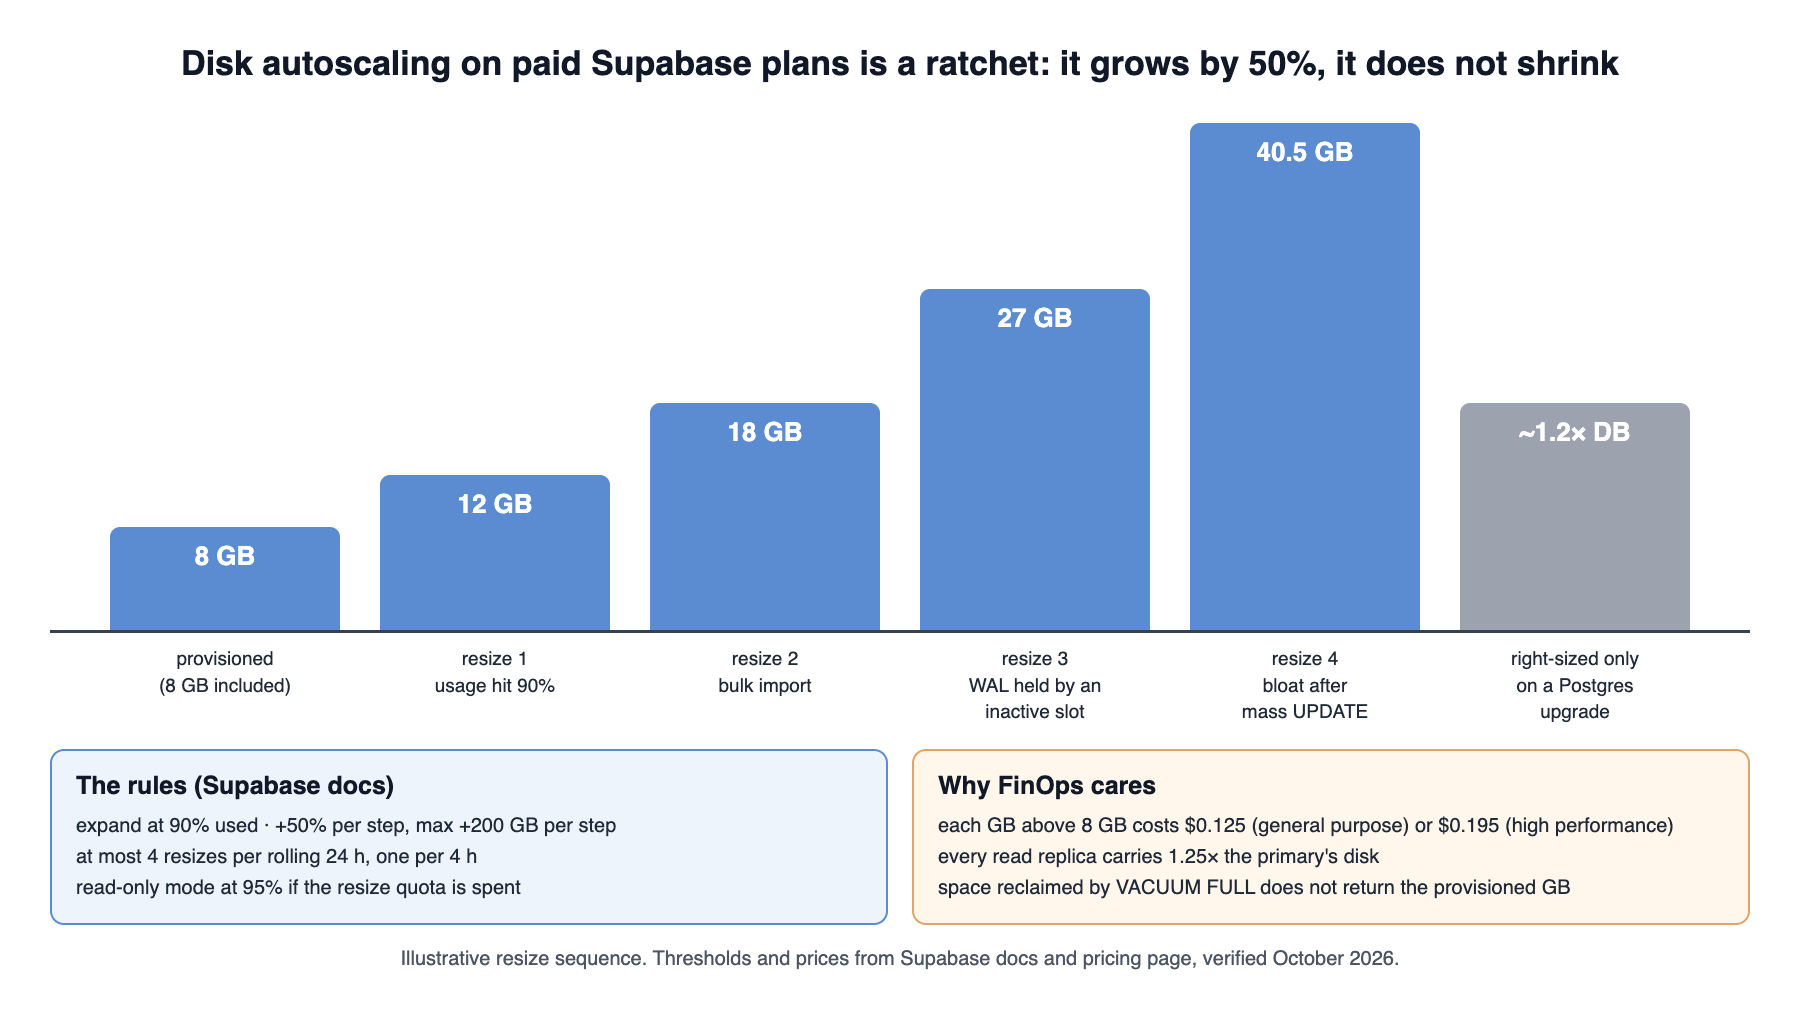
On paid plans disk expands by 50% when usage reaches 90%, up to four times in a rolling 24 hours, and it does not shrink during normal operation. It is right-sized only during a Postgres upgrade, to about 1.2 times the database size. A bulk import, a mass UPDATE that doubles a table through dead tuples, or an inactive logical replication slot holding WAL can each trigger a permanent step. Per GB the price is low ($0.125 above 8 GB on general purpose disk), but every replica carries 1.25 times the primary disk and its own provisioned IOPS, so the ratchet multiplies.
8. Enabling paid add-ons in every environment
PITR at $100 per seven days, a $60 log drain and IPv4 at $4 per database are reasonable for production. Copied into staging, preview and per-developer projects, they become a fixed tax on non-production. IPv4 is only needed for clients that cannot reach IPv6 directly; the Supavisor pooler connection strings serve IPv4 clients without the add-on.
How Do You Know You Are Overspending on Supabase?
In Supabase FinOps, overspending is a ratio, not a number. A $4,000 monthly bill can be efficient for one product and wasteful for another. These are the signals we treat as evidence of overspend in a Supabase FinOps review:
- Spend per MAU rises while MAU is flat. Unit cost growing faster than usage means cost is coming from configuration, not demand.
- Compute p95 CPU stays under roughly 30 to 40% on a Large or bigger instance for weeks. The instance is sized for a peak that no longer happens, or for connections rather than CPU.
- Allocated disk is more than twice the database size. The ratchet has fired on transient data, WAL or bloat.
- Uncapped lines exceed 80% of the invoice and no named person owns each one.
- Rows returned per call in
pg_stat_statementsruns into the thousands for user-facing queries. Clients are paging in the browser. - Branch hours exceed the number of open pull requests multiplied by their age. Persistent branches have been orphaned.
- Replica CPU stays low while the primary is busy. The replica was bought for reads that the application never routed to it.
Each of these Supabase FinOps signals maps to a metric below, and each metric names its source, so a finding can be proven before anyone changes a running system.
Supabase FinOps: The Top 10 Metrics to Monitor
The FinOps Foundation framework organizes the work into Inform, Optimize and Operate. The ten metrics below are the Inform layer for Supabase: they are the minimum evidence set we expect before any right-sizing or architecture decision. Figure 3 shows how they flow from three evidence sources into a weekly decision.
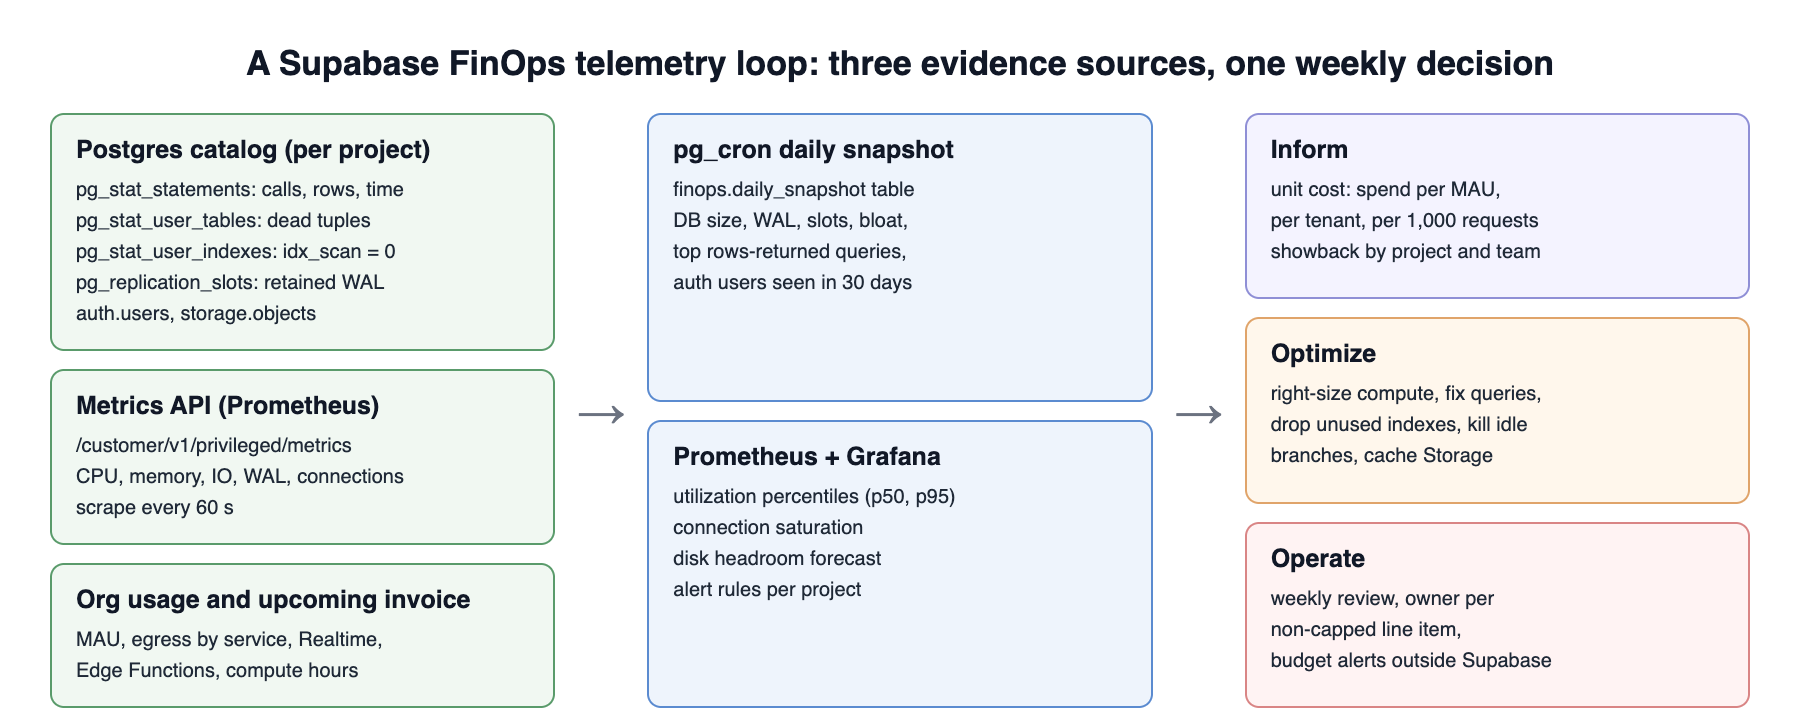
Metric 1: Unit cost (spend per MAU, per tenant, per 1,000 requests)
The north-star metric of Supabase FinOps. Divide the upcoming invoice estimate by MAU from the organization usage page, and by tenant count if you run a multi-tenant SaaS. Track it weekly. Everything else on this list explains movement in this number.
Metric 2: Compute utilization by instance size
Source: the Supabase Metrics API, a Prometheus-compatible endpoint at https://<project-ref>.supabase.co/customer/v1/privileged/metrics, authenticated with HTTP Basic auth as service_role and a secret API key, scraped every 60 seconds. It is in beta and not available on self-hosted Supabase. Right-sizing decisions should rest on p95 over at least 14 days, not on a single afternoon.
# prometheus.yml (scrape job per project; keep the key in a secret store)
scrape_configs:
  - job_name: supabase_prod
    scrape_interval: 60s
    metrics_path: /customer/v1/privileged/metrics
    scheme: https
    basic_auth:
      username: service_role
      password_file: /etc/prometheus/secrets/supabase_prod_key   # contains ${SUPABASE_SECRET_KEY}
    static_configs:
      - targets: ['${PROJECT_REF}.supabase.co']
        labels: { project: prod, env: production, team: payments }
# p95 CPU busy over 14 days. Confirm series names against one scrape first:
#   curl -s --user "service_role:${SUPABASE_SECRET_KEY}" \
#     https://${PROJECT_REF}.supabase.co/customer/v1/privileged/metrics | grep -E '^node_(cpu|memory)'
quantile_over_time(0.95,
  (1 - avg by (project) (rate(node_cpu_seconds_total{mode="idle"}[5m])))[14d:5m]
)
Metric 3: Connection saturation
Many Supabase upsizes are bought for connection limits, not CPU, because each compute size sets its own max_connections. If CPU is low and connections are near the ceiling, the Supabase cost optimization is the transaction-mode pooler, not a larger instance.
SELECT
    COALESCE(NULLIF(application_name, ''), usename::text) AS client,
    state,
    COUNT(*)                                              AS connections,
    ROUND(100.0 * COUNT(*)
          / current_setting('max_connections')::int, 1)  AS pct_of_max
FROM pg_stat_activity
WHERE backend_type = 'client backend'
GROUP BY 1, 2
ORDER BY connections DESC;
Metric 4: Disk headroom, WAL and replication slot retention
Compare database size to allocated disk (Database Settings in the dashboard), and watch for WAL held by slots, which is the most common silent cause of an unexpected resize.
-- Database size versus WAL on disk
SELECT
    pg_size_pretty(SUM(pg_database_size(datname)))           AS database_size,
    (SELECT pg_size_pretty(SUM(size)) FROM pg_ls_waldir())   AS wal_size
FROM pg_database;

-- WAL retained by each replication slot; an inactive slot with large retention is a resize waiting to happen
SELECT
    slot_name,
    slot_type,
    active,
    pg_size_pretty(pg_wal_lsn_diff(pg_current_wal_lsn(), restart_lsn)) AS retained_wal
FROM pg_replication_slots
ORDER BY pg_wal_lsn_diff(pg_current_wal_lsn(), restart_lsn) DESC NULLS LAST;
Dropping a slot is destructive: the consumer that owns it (a CDC pipeline, a replica, an ETL tool) loses its position and may need a full resync. Confirm ownership with the team that created it, take a note of the slot definition, and only then run SELECT pg_drop_replication_slot('slot_name');, followed by the retention query above to validate.
Metric 5: Dead tuples and unused index bytes
Bloat and dead indexes consume disk, inflate backup and replica storage, and slow writes. The Supabase CLI wraps several of these checks (supabase inspect db bloat, unused-indexes, table-sizes), and the catalog queries below give the same evidence in SQL.
-- Tables with the most dead tuples relative to live rows
SELECT
    schemaname || '.' || relname                         AS table_name,
    n_live_tup,
    n_dead_tup,
    ROUND(100.0 * n_dead_tup / NULLIF(n_live_tup + n_dead_tup, 0), 1) AS dead_pct,
    last_autovacuum
FROM pg_stat_user_tables
WHERE n_dead_tup > 10000
ORDER BY n_dead_tup DESC
LIMIT 20;

-- Indexes never scanned since statistics were last reset (exclude constraint-backing indexes)
SELECT
    s.schemaname || '.' || s.indexrelname                AS index_name,
    pg_size_pretty(pg_relation_size(s.indexrelid))       AS index_size,
    s.idx_scan
FROM pg_stat_user_indexes AS s
JOIN pg_index AS i
    ON i.indexrelid = s.indexrelid
WHERE s.idx_scan = 0
  AND NOT i.indisunique
  AND NOT i.indisprimary
ORDER BY pg_relation_size(s.indexrelid) DESC
LIMIT 20;
Check pg_stat_database.stats_reset before trusting idx_scan = 0, and check replicas too, because an index unused on the primary may serve reads on a replica. Drop candidates with DROP INDEX CONCURRENTLY in a change window, keeping the CREATE INDEX statement as the rollback.
Metric 6: Egress by service, cached versus uncached
Source: the organization usage page, which breaks egress down by Database, Auth, Storage, Realtime, Edge Functions and the shared pooler, with cached egress (Smart CDN hits) reported separately. The ratio to watch for Storage is cached over total: uncached egress costs three times more per GB than cached ($0.09 against $0.03). For Supabase FinOps reporting, normalize egress per MAU so growth and waste can be told apart.
Metric 7: Rows returned per call
Supabase does not expose response bytes per query in Postgres, so rows per call is the best in-database proxy for payload size. On Supabase, pg_stat_statements lives in the extensions schema.
SELECT
    LEFT(REGEXP_REPLACE(query, '\s+', ' ', 'g'), 120)        AS query_sample,
    calls,
    rows,
    ROUND(rows::numeric / NULLIF(calls, 0), 1)                AS rows_per_call,
    ROUND(total_exec_time::numeric / 1000, 1)                 AS total_exec_seconds,
    ROUND(mean_exec_time::numeric, 2)                         AS mean_ms
FROM extensions.pg_stat_statements
WHERE calls > 100
ORDER BY rows DESC
LIMIT 20;
The same view sorted by total_exec_time is the compute side of the ledger: the queries at the top are what you are paying for when you upsize.
Metric 8: Monthly active users, by type
Supabase counts an MAU as a distinct user who signs in or refreshes a token in the billing cycle; 100,000 are included on Pro, then $0.00325 each. At one million MAU that is $2,925 a month of auth alone. Third-party and SSO MAU are metered separately. Watch for bots, load-test accounts and integration tests that sign in against production, and for clients refreshing tokens for users who no longer use the product. The query below is an approximation to reconcile against the usage page, not a substitute for it.
-- Approximate users active in the last 30 days (sign-in or session refresh)
SELECT COUNT(DISTINCT u.id) AS approx_mau_30d
FROM auth.users AS u
LEFT JOIN auth.sessions AS s
    ON s.user_id = u.id
WHERE GREATEST(u.last_sign_in_at, s.updated_at) >= NOW() - INTERVAL '30 days';
Metric 9: Realtime messages, peak connections and Edge Function invocations
These are the fan-out meters of Supabase pricing. Realtime messages scale with subscribers multiplied by events, so track messages per active client per day. Peak connections above the 500 included on Pro bill at $10 per 1,000. Edge Functions are rarely the expensive line (2 million invocations included, then $2 per million), but a scheduler calling a function every few seconds per tenant can change that.
Metric 10: Uncapped resource hours
An inventory, refreshed weekly, of every project, branch, replica, IPv4 address, PITR window, log drain and custom domain, with an owner and a business reason. This is the Supabase FinOps metric that catches Mistakes 2, 3 and 8 and protects the part of the bill the Spend Cap cannot.
Automating the Evidence: a pg_cron Snapshot for Supabase Monitoring
The catalog metrics above reset on restart or statistics reset, so trends need a history. A small schema and one scheduled function give Supabase FinOps that history. Keep the schema out of the Data API: do not add it to the exposed schemas list, and revoke access from the API roles.
CREATE SCHEMA IF NOT EXISTS finops;
REVOKE ALL ON SCHEMA finops FROM anon, authenticated;

CREATE TABLE IF NOT EXISTS finops.daily_snapshot (
    snapshot_date      date        NOT NULL DEFAULT CURRENT_DATE,
    database_bytes     bigint      NOT NULL,
    wal_bytes          bigint      NOT NULL,
    max_slot_lag_bytes bigint,
    dead_tuples        bigint      NOT NULL,
    unused_index_bytes bigint      NOT NULL,
    storage_bytes      bigint,
    approx_mau_30d     bigint,
    captured_at        timestamptz NOT NULL DEFAULT NOW(),
    CONSTRAINT pk_finops_daily_snapshot PRIMARY KEY (snapshot_date)
);

CREATE OR REPLACE FUNCTION finops.take_snapshot()
RETURNS void
LANGUAGE sql
AS $$
INSERT INTO finops.daily_snapshot (
    database_bytes, wal_bytes, max_slot_lag_bytes, dead_tuples,
    unused_index_bytes, storage_bytes, approx_mau_30d
)
SELECT
    (SELECT SUM(pg_database_size(datname)) FROM pg_database),
    (SELECT SUM(size) FROM pg_ls_waldir()),
    (SELECT MAX(pg_wal_lsn_diff(pg_current_wal_lsn(), restart_lsn))::bigint
       FROM pg_replication_slots),
    (SELECT SUM(n_dead_tup) FROM pg_stat_user_tables),
    (SELECT COALESCE(SUM(pg_relation_size(s.indexrelid)), 0)
       FROM pg_stat_user_indexes AS s
       JOIN pg_index AS i ON i.indexrelid = s.indexrelid
      WHERE s.idx_scan = 0 AND NOT i.indisunique AND NOT i.indisprimary),
    (SELECT SUM((metadata ->> 'size')::bigint) FROM storage.objects),
    (SELECT COUNT(DISTINCT u.id)
       FROM auth.users AS u
       LEFT JOIN auth.sessions AS s ON s.user_id = u.id
      WHERE GREATEST(u.last_sign_in_at, s.updated_at) >= NOW() - INTERVAL '30 days')
ON CONFLICT ON CONSTRAINT pk_finops_daily_snapshot DO NOTHING;
$$;

-- Requires the pg_cron extension (Database > Extensions). Runs 00:15 UTC daily.
SELECT cron.schedule('finops-daily-snapshot', '15 0 * * *', $$SELECT finops.take_snapshot()$$);

-- Verify the job is registered and has run
SELECT jobid, jobname, schedule, active FROM cron.job WHERE jobname = 'finops-daily-snapshot';
SELECT status, start_time, return_message
FROM cron.job_run_details
WHERE jobid = (SELECT jobid FROM cron.job WHERE jobname = 'finops-daily-snapshot')
ORDER BY start_time DESC
LIMIT 5;
Week-over-week growth of database_bytes and wal_bytes forecasts the next disk resize before it happens; a jump in max_slot_lag_bytes is an alert on its own. Run the function once by hand in staging and review its cost on large storage.objects tables before scheduling it in production.
Supabase Cost Optimization: An Operating Model That Holds
Supabase FinOps metrics without decision rights become a dashboard nobody opens. The Supabase FinOps operating model we recommend is deliberately small:
- One accountable owner per uncapped line item, recorded next to the resource inventory in Metric 10.
- A weekly 30-minute review of unit cost, the top five queries by total execution time, disk headroom and branch hours. Decisions are logged with the metric that justified them.
- A rule that compute is upsized only with evidence: p95 CPU or memory pressure over 14 days and a
pg_stat_statementsreview showing no query fix would recover the headroom. Downsizes follow the same evidence in reverse. - Non-production defaults: ephemeral branches, no PITR, no log drains, no IPv4 unless a named client requires it.
- Budget alerts outside Supabase, since the platform itself provides no cost alerting today.
Compute changes on Supabase restart the instance, so schedule them in a maintenance window, confirm the rollback size in advance, and watch connection errors and p95 latency for an hour afterwards. As with every recommendation here, test on your own workload before applying it to production, and keep a tested backup and recovery path in place before changing a running database.
Frequently Asked Questions on Supabase FinOps
Does the Supabase Spend Cap stop all charges?
No. It stops metered usage such as egress, MAU, disk size and Realtime messages. Compute, read replicas, branches, IPv4, PITR, log drains, custom domains and provisioned IOPS keep billing.
Is the $10 compute credit per project?
It is per organization, per month, and it does not roll over. It does not apply to read replica or branching compute.
Will deleting data shrink my Supabase disk bill?
Not directly. Deleting data and vacuuming frees space inside the disk, but provisioned disk does not shrink until a Postgres upgrade right-sizes it to about 1.2 times the database size, or until you migrate to a new project.
What is the single biggest Supabase cost optimization lever?
In most estates it is compute: query and index fixes that let a project stay on, or return to, a smaller instance, multiplied across every replica.
Bring In a Second Pair of Eyes
Supabase is Postgres underneath, and most Supabase FinOps wins come from Postgres engineering: plans, indexes, autovacuum, connection pooling and replication. MinervaDB’s PostgreSQL consulting and 24×7 support practice runs measurement-first cost and performance reviews across managed Postgres platforms, the same discipline we apply in our AlloyDB pricing and FinOps guide. If your Supabase bill is growing faster than your users, start with the ten metrics above, and talk to us when you want the evidence reviewed.
References
Supabase pricing · Supabase cost control and Spend Cap · Manage Compute usage · Manage Branching usage · Manage Egress usage · Manage Realtime Messages usage · Manage MAU usage · Manage IPv4 usage · Database size and disk autoscaling · Supabase Metrics API · FinOps Foundation framework
Running this in production?
MinervaDB provides PostgreSQL Consulting, PostgreSQL Support and PostgreSQL Remote DBA with 24x7 coverage and a 15-minute S1 response. Talk to an engineer.