Observability is usually described as three things (metrics, logs and traces) and is actually about one: the key that joins them. A latency spike in a metric, an error line in a log and a slow span in a trace are three descriptions of the same event, and a stack is observable only when an engineer can move between them without guessing.
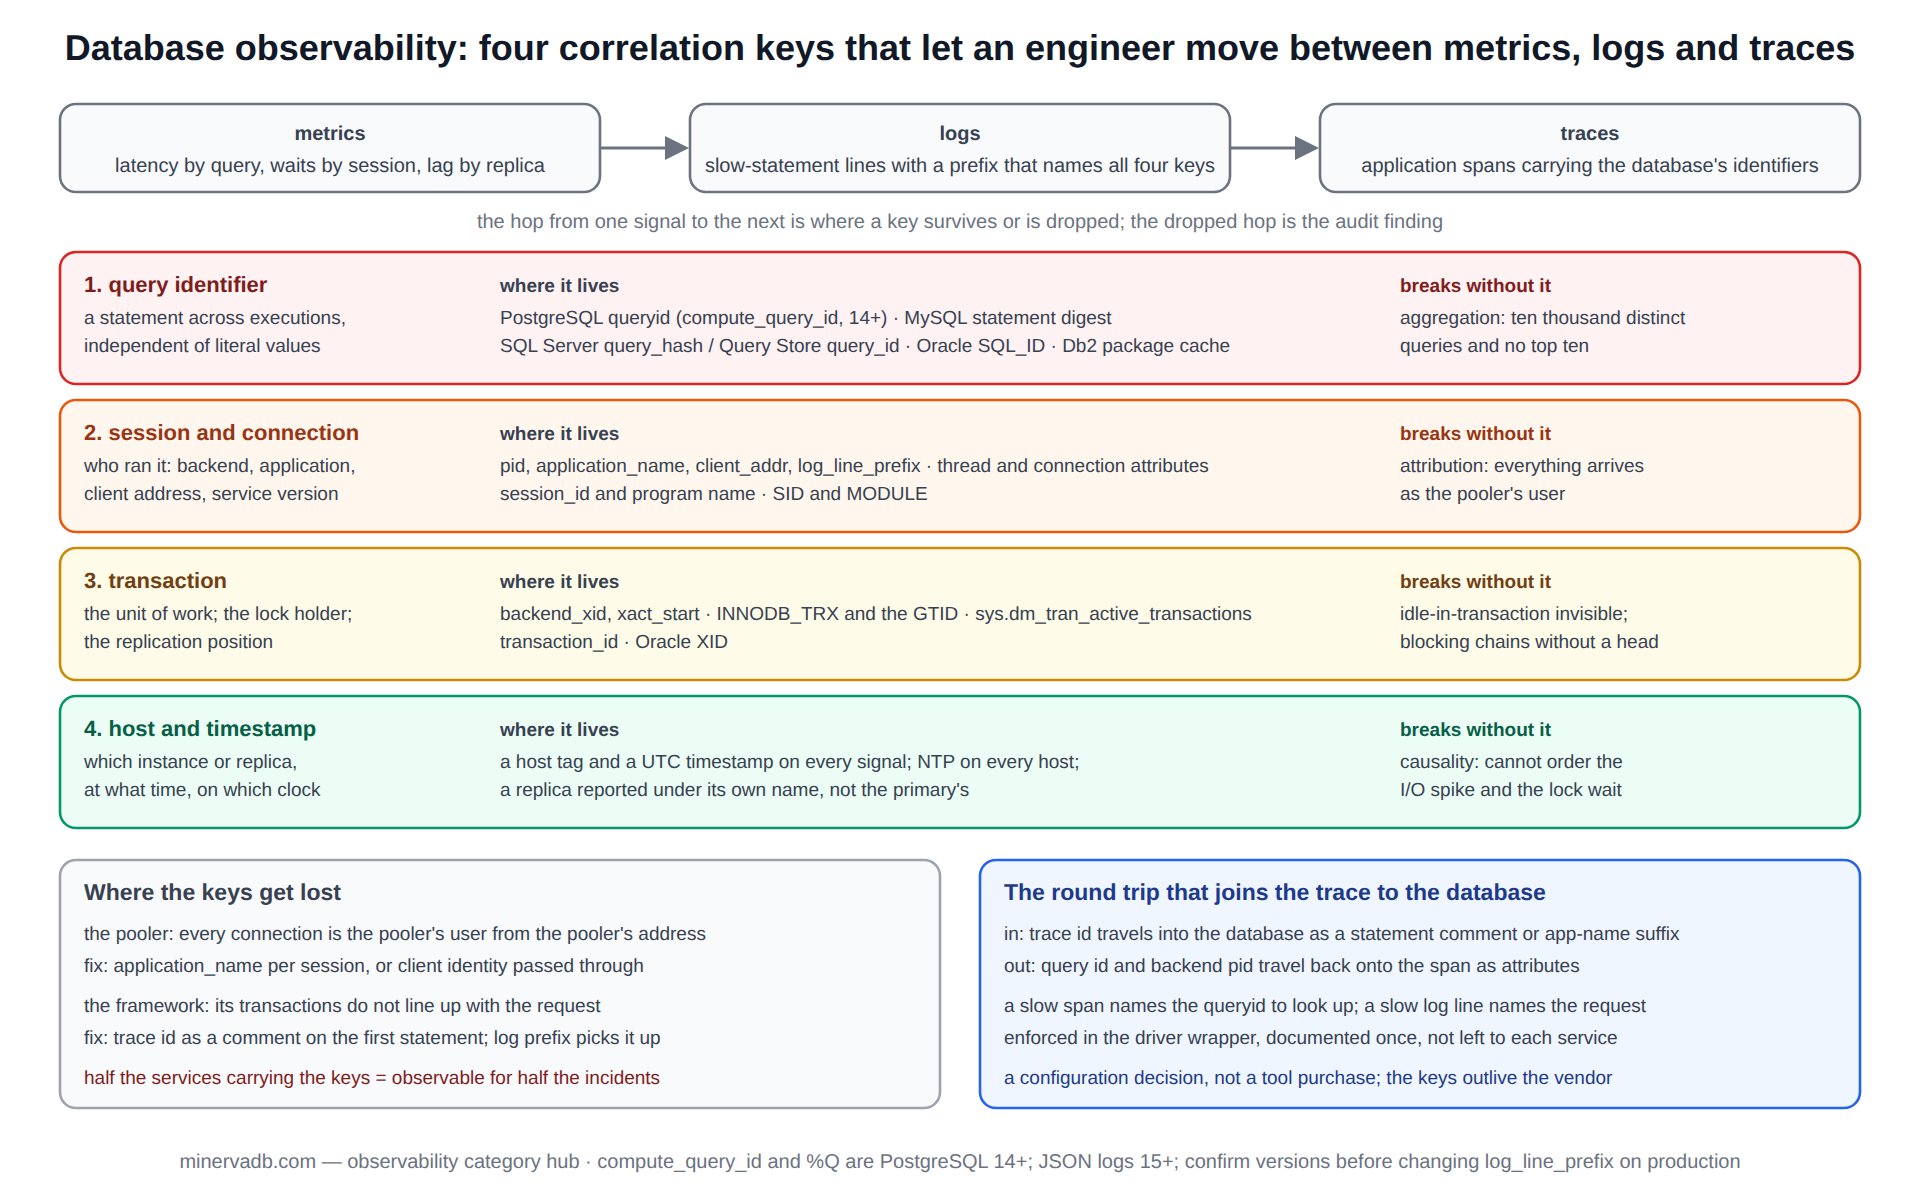
For a database that movement runs through four keys: the query identifier that names a statement across its executions, the session or connection that names who ran it, the transaction identifier that names the unit of work, and the host and timestamp that place it in the world. A stack that carries all four through every signal answers questions; a stack that drops one of them produces dashboards.
This page organises database observability around those four correlation keys. Each section states what the key identifies, where each engine exposes it in metrics, logs and traces, what breaks when it is missing, and which archive post shows the key being used to solve a real problem, from Exadata and SQL Server to Db2 for z/OS and PostgreSQL. A fifth section covers the two layers that usually lose the keys, the connection pooler and the application framework, and the last covers what observability adds beyond monitoring: the ability to ask a question that nobody thought to put on a dashboard.
Observability key 1: the query identifier
The first key names a statement independently of its literal values, so that ten thousand executions of the same query with different parameters aggregate to one row.
PostgreSQL exposes it as queryid in pg_stat_statements and, since PostgreSQL 14 with compute_query_id, in pg_stat_activity and the log; MySQL as the statement digest in the Performance Schema; SQL Server as query_hash and the Query Store’s query_id; Oracle as SQL_ID; Db2 as the statement identifier in the package cache. The key joins the metric (total time by query) to the log (the slow-query line that carries it) to the plan (the plan stored against it).
expensive SQL on Exadata 26.1: reading the offload numbers is the archive’s post on following one SQL_ID from the AWR top-SQL section through SQL Monitor to the cell offload statistics, which is the query key used across three signals on one platform.
SQL Server 2025 expensive queries: seven proven fixes does the same with query_id from the Query Store to the plan history, and Db2 13 for z/OS index efficiency: eight troubleshooting checks follows a statement from the accounting trace to its EXPLAIN access path. What breaks without this key is aggregation: a slow-query log with literal values in it has ten thousand distinct queries and no top ten.
Observability key 2: the session and the connection
The second key names who ran the statement: the backend process, the session identifier, the client address and, when the application sets it, the application name or a tag that identifies the service and its version. It joins the statement to the human or service that issued it, and it is the key an incident needs first, because the question at 3 a.m. is not “which query is slow” but “which service is being hurt and which is doing the hurting”.
PostgreSQL carries it as pid, application_name and client_addr in pg_stat_activity and, with log_line_prefix configured to include them, in every log line; MySQL as the thread and the connection attributes; SQL Server as session_id and the program name.
PostgreSQL wait-event analysis: finding bottlenecks is the archive’s post on grouping wait events by session and application name, which turns “many sessions waiting on locks” into “the reporting service is blocking the checkout service”, and building a PostgreSQL on-call runbook is where that grouping becomes the first step of the lock-wait entry. What breaks without this key is attribution: every connection arrives as the pooler’s user from the pooler’s address, and the database cannot say which service is responsible.
# the four keys carried through PostgreSQL's own signals (PostgreSQL 14+; settings, then a reload)
# postgresql.conf
compute_query_id = on                                   # key 1 in pg_stat_activity and the log
log_line_prefix  = '%m [%p] %a %u@%d %h xid=%x qid=%Q '  # time, pid, app, user@db, host, transaction id, query id
log_min_duration_statement = 250                        # ms; every slow line now carries all four keys
track_activity_query_size  = 4096

-- the join the keys make possible: the slow statement, the session running it, its transaction age, the host
SELECT a.pid,
       a.application_name,
       a.client_addr,
       a.backend_xid,
       a.query_id,
       now() - a.xact_start           AS xact_age,
       a.wait_event_type,
       a.wait_event,
       s.calls,
       ROUND(s.mean_exec_time::numeric, 2) AS mean_ms
FROM   pg_stat_activity AS a
LEFT JOIN pg_stat_statements AS s
       ON s.queryid = a.query_id
WHERE  a.state = 'active'
  AND  a.backend_type = 'client backend'
ORDER  BY xact_age DESC NULLS LAST
LIMIT  25;
The log_line_prefix above is the single most valuable observability setting on a PostgreSQL server, and the one most often left at its default: with it, every log line joins to the catalog and to the application’s trace; without it, the log is a list of statements with timestamps.
Observability key 3: the transaction
The third key names the unit of work. A statement that is fast on its own can be the fifth statement of a transaction that has held locks for a minute, and the engine’s own view of the problem is the transaction’s age, not the statement’s duration.
PostgreSQL exposes backend_xid and xact_start; MySQL the transaction identifier in information_schema.INNODB_TRX and, for replication, the GTID; SQL Server the transaction_id in sys.dm_tran_active_transactions; Oracle the XID. The key joins the lock wait to the session that holds it and the session to the statement it is stuck on, which is the whole blocking chain.
MySQL replication monitoring: enhanced features for Enterprise Edition is the archive’s post on the transaction key at the replication layer, where the GTID is what lets an operator say which transaction a replica is waiting on and how far behind that puts it in seconds rather than in bytes. What breaks without this key is the idle-in-transaction problem: a session that ran a fast statement ten minutes ago and has held its locks since is invisible in a statement-level view and obvious in a transaction-level one.
Observability key 4: the host and the timestamp
The fourth key places the event in the world: which host, which instance, which replica, at what time, in which time zone. It sounds trivial and it is the key most often broken, by clocks that drift between the database host and the application host, by log timestamps in local time joined to metrics in UTC, and by a replica that is reported under the primary’s name.
It is the key that joins the database’s signals to the host’s (the Linux tour of run queue, I/O wait and THP stalls) and to the application’s trace, whose spans carry their own clock.
Datadog PostgreSQL observability is the archive’s post on a stack that carries this key by construction, because every signal it collects is tagged with the host and normalised to one clock, and its value is precisely that the database’s slow statement, the host’s I/O wait and the application’s span line up on one timeline without the engineer doing the arithmetic. What breaks without this key is causality: an engineer who cannot say whether the I/O spike came before or after the lock wait cannot say which caused which.
Where the observability keys get lost: the pooler and the framework
Two layers between the application and the database lose the keys by default. The connection pooler (PgBouncer, ProxySQL, the application’s own pool) presents every connection as its own user from its own address, so key 2 arrives as the pooler unless the application sets application_name per session or the pooler is configured to pass the client’s identity through.
The application framework wraps statements in its own transaction handling, so key 3 on the database side does not line up with the request on the application side unless the request identifier is written into the transaction (as a comment on the first statement, or as a session variable that the log prefix picks up).
The fix for both is the same: the application’s trace identifier travels into the database as a statement comment or an application-name suffix, and the database’s query identifier travels back into the trace as a span attribute. With both in place, a slow span in the application’s trace names the queryid that caused it, and a slow statement in the database log names the request that issued it. That round trip is what observability adds over monitoring, and it is a configuration decision rather than a tool purchase.
The four observability keys, side by side
| Key | Identifies | Where it lives (PostgreSQL / MySQL / SQL Server / Oracle) | What breaks without it |
|---|---|---|---|
| 1. Query identifier | A statement across its executions, independent of literal values | queryid (compute_query_id, 14+) / statement digest / query_hash, Query Store query_id / SQL_ID |
Aggregation: no top ten, only ten thousand distinct queries |
| 2. Session and connection | Who ran it: backend, application, client address, service version | pid, application_name, client_addr, log_line_prefix / thread and connection attributes / session_id, program name / SID, MODULE |
Attribution: everything arrives as the pooler |
| 3. Transaction | The unit of work; the lock holder; the replication position | backend_xid, xact_start / INNODB_TRX, GTID / transaction_id / XID |
Idle-in-transaction sessions invisible; blocking chains without a head |
| 4. Host and timestamp | Which instance or replica, at what time, on which clock | Host tag and UTC timestamp on every signal; NTP on every host; replica reported under its own name | Causality: cannot order the I/O spike and the lock wait |
A stack is audited by taking one incident and checking that each key survives the hop from metric to log to trace; the hop where a key is dropped is the finding.
Carrying the observability keys into the application’s trace
The application side of database observability is a naming convention. Distributed tracing standards define attributes for a database span: the system, the database name, the statement text or its digest, the operation and the peer address, and an observability stack that fills them consistently has already carried keys one and four into the trace. The two that need deliberate work are the session and the transaction, because the tracing library does not know the database’s process identifier or transaction number unless the driver reports them.
The usual pattern is a round trip. On the way in, the application writes its trace identifier into the database as a short comment prefixed to the first statement of each transaction, or sets it as the application name suffix for the session’s duration; the database’s log prefix then carries it on every slow line.
On the way out, the driver reads the query identifier and the backend process from the connection (both are cheap to fetch once per session) and attaches them to the span as attributes. An engineer holding a slow span now has the query identifier to look up in the statement statistics, and an engineer holding a slow log line has the trace identifier to look up in the tracing store.
The cost is a few bytes per statement and one round trip per session, and the discipline is that the convention is documented and enforced in the driver wrapper rather than left to each service. A stack in which half the services carry the keys and half do not is observable for half the incidents.
Auditing an observability stack against the four keys
The audit is one incident, followed by hand. Take a latency spike from the last month, start at the metric that showed it, and try to reach the statement, the session, the transaction and the host from there, then from the log, then from the trace.
At each hop, record whether the key survived: the metric named a query identifier or only a host; the log line carried the session or only a timestamp; the trace span carried the database’s identifiers or only the statement text. The hop where a key was lost is a finding, and the fix is nearly always a setting (a log prefix, a query identifier flag, a driver attribute) rather than a product.
The audit is repeated after the settings change, on a new incident, and the stack passes when all four keys survive every hop. It is a shorter exercise than a tool evaluation and it produces a more durable result, because the keys outlive the tools: a stack rebuilt on a different vendor keeps its observability if the keys were designed in, and loses it if they were the vendor’s.
What observability adds beyond monitoring
Monitoring answers the questions someone thought to put on a dashboard; observability answers the one nobody did. The difference is not the tool but the keys: a stack that carries all four can be asked “which service’s transactions were holding locks on the orders table between 03:12 and 03:15 on the replica that was promoted at 03:10, and which of their statements were slow before that” and can answer from data it already has. A stack without them can show that lock waits rose at 03:12 and no more.
The archive’s monitoring posts describe the dashboards and alerts that a stack needs; this archive’s posts describe the keys that make the dashboards explainable. The two are built together: the collection layer that produces the metric is the same one that has to carry the query identifier alongside it, and the log shipping that feeds the alert is the same one that has to preserve the log prefix. An engagement that installs a monitoring stack without deciding the keys builds a stack that will have to be rebuilt.
Version notes: compute_query_id and the %Q log-prefix escape arrived in PostgreSQL 14, the JSON log format in 15, and pg_stat_io in 16; the MySQL Performance Schema digest and connection attributes are 5.6+ and 8.0 respectively; the SQL Server Query Store is 2016+ with query hints in 2022.
Confirm the running versions before applying a setting from an archive post, apply log_line_prefix and log_min_duration_statement changes on a replica first to see the log volume they produce, and keep the shipped logs and retained metrics on storage that survives the database’s own failure, since an observability stack that dies with the database cannot explain what killed it.
Where this observability archive sits
This archive is the correlation layer beside the monitoring archive, which covers the four questions a stack answers at 3 a.m., and above the Linux archive and eBPF archive, which produce the host-side signals the fourth key joins to. The database performance tuning archive is where the joined signals are read as the five bottlenecks, and the PostgreSQL archive covers the engine whose keys are the worked example above. The reference for the log prefix escapes and the query identifier is the error reporting and logging chapter of the PostgreSQL documentation.
For an observability audit that follows one incident through the four keys and reports where each is dropped, a stack build in which the keys are decided before the tools are, or 24×7 support in which the on-call engineer starts from a joined view rather than three separate ones, the MinervaDB database consulting practice runs this method, and states for every recommendation which key it restores and at which hop.