AlloyDB pricing is simple to read and easy to get wrong, because every line on the invoice is driven by a piece of the engine's internals that most teams never look at. Compute is billed per node, and the number of nodes is a function of how the HA and read-scaling architecture works. Storage is billed on bytes the storage service holds, which is a function of vacuum, WAL retention and TOAST, not of how much data you think you have. Backups, cross-region traffic and extended-support surcharges each attach to a specific mechanism. If you understand the mechanism, you can cut the line; if you do not, you end up buying a committed-use discount on waste.
This post is the FinOps companion to our earlier piece on AlloyDB architecture and internals. It walks the invoice top to bottom, maps each component to the internals that produce it, and gives the SQL, gcloud and a small Python model you can use to find where your own spend is going. All list prices are us-central1, on-demand, as published on the AlloyDB pricing page at the time of writing (September 2026); they change, and the arithmetic below is illustrative, not a quote. Whether the same money would buy more on Cloud SQL, self-managed PostgreSQL or AlloyDB Omni is a question I answer at the end, because a vendor-neutral practice has to.
AlloyDB pricing: the five lines and what drives each one
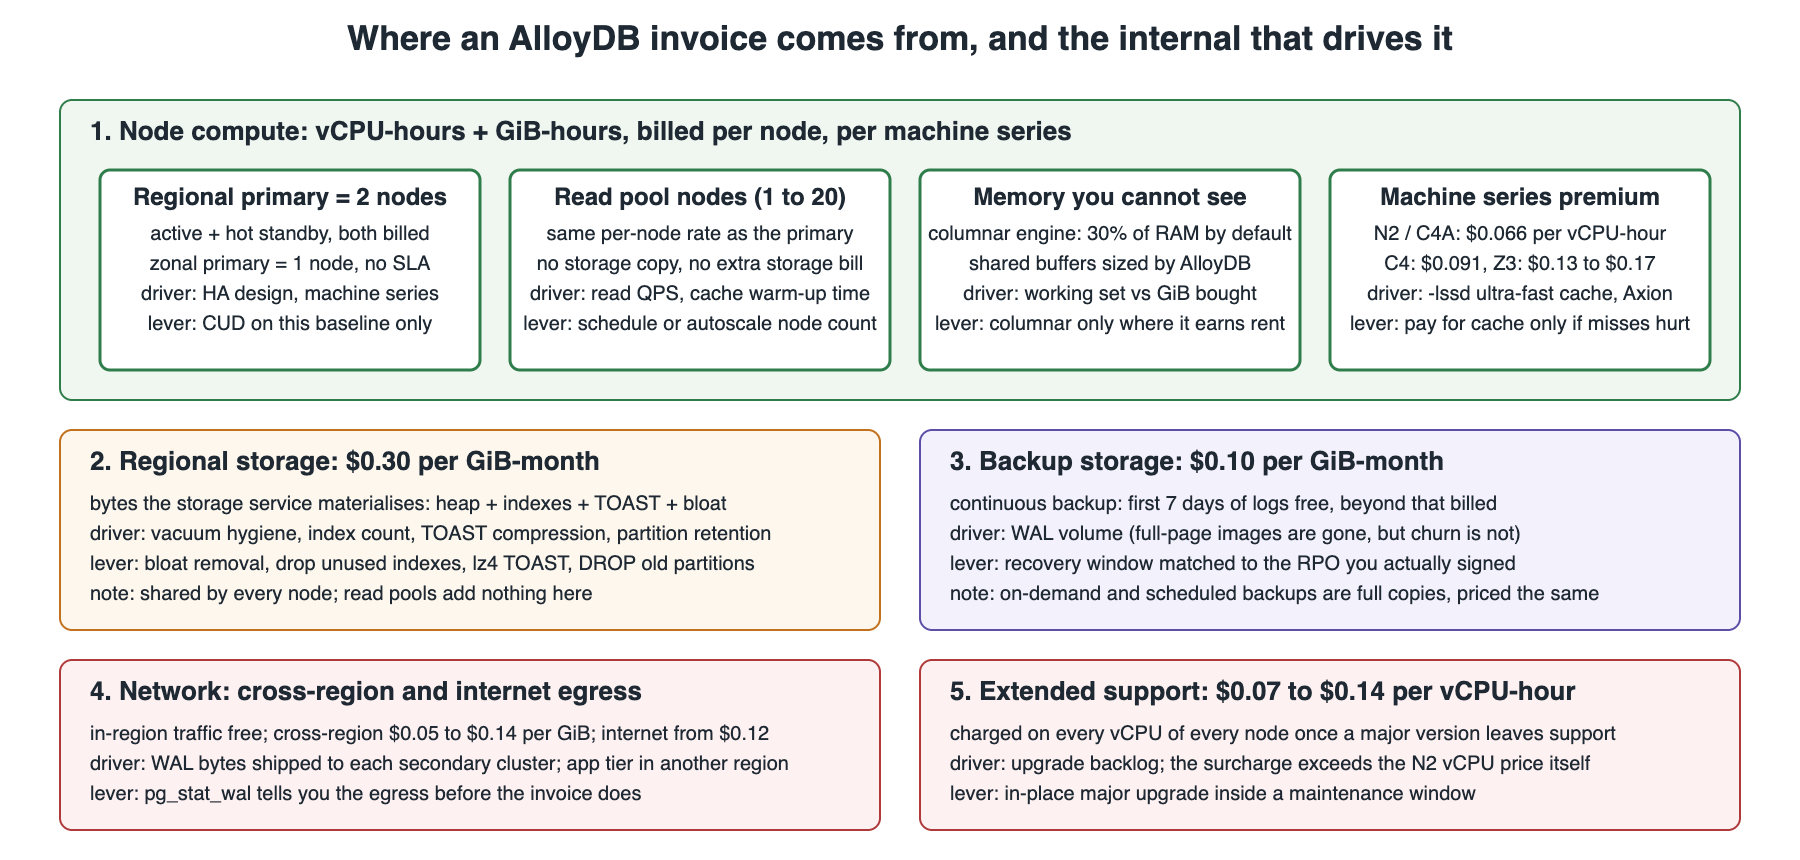
An AlloyDB bill has five material components: node compute (vCPU-hours and GiB-hours, per node), regional cluster storage (GiB-hours), backup storage (GiB-hours beyond the free window), network (cross-region and internet egress), and, if you are on an old major version, an extended-support surcharge per vCPU-hour. AlloyDB AI functions, the columnar engine, the index advisor and managed connection pooling carry no separate charge; they are paid for through the compute they consume. That last point is the one most teams miss: the columnar engine is "free", but the memory it occupies is not.
Compute is per node, and the architecture decides the node count
The unit of compute pricing is a node, priced as vCPU-hours plus GiB-hours for its machine series. On N2 and C4A that is $0.06608 per vCPU-hour and $0.0112 per GiB-hour; on C4 it is $0.091 and $0.0105; on Z3 it is $0.1315 or $0.171 per vCPU-hour depending on the local-SSD variant. A regional (HA) primary is two nodes, active and hot standby, and both are billed at full rate; a zonal primary is one node with no availability SLA. Each read pool node is billed at the same rate as a primary node. There is no charge for a node's share of storage, because storage is a cluster-level, shared resource.
Put AlloyDB pricing on a common shape. An n2-highmem-16 node (16 vCPU, 128 GiB) costs 16 × 0.06608 + 128 × 0.0112 = $2.49 per hour, about $1,818 per month at 730 hours. As a regional primary that is two of them, $3,637. Add a four-node read pool of n2-highmem-8 (each $909) and compute is $7,273 a month before any discount. Two TiB of regional storage at $0.0004109 per GiB-hour adds $614, and two TiB of backups beyond the free log window adds $205. That is roughly $8,100 a month for a mid-sized production cluster, and 90% of it is compute, which is where the FinOps effort belongs.
| Machine series | vCPU-hour | GiB-hour | 3-year CUD vCPU-hour | What you are paying for |
|---|---|---|---|---|
| N2 (default) | $0.06608 | $0.0112 | $0.0317 | Baseline; no ultra-fast cache on plain shapes |
| C4A (Axion, Arm) | $0.06608 | $0.0112 | $0.0317 | Same list price as N2, newer cores, -lssd variants |
| C4 | $0.091 | $0.0105 | $0.0437 | Fastest x86 cores, up to 288 vCPU, -lssd cache |
| Z3 standard LSSD | $0.1315 | $0.0175 | $0.0631 | Large local SSD for working sets far beyond RAM |
| Z3 high LSSD | $0.171 | $0.023 | $0.0821 | Largest ultra-fast cache per vCPU |
Two conclusions about AlloyDB pricing fall out of that table. The C4A series is the quiet win: it is priced identically to N2, has the newer cores, and comes in -lssd shapes, so it is the first thing to test for any workload whose extensions build cleanly on Arm. And C4 is a 38% premium per vCPU that buys you the fastest cores and the ultra-fast cache; that is worth paying when a measured cache-miss latency is what is holding your p99, and it is money on fire when the working set already fits in shared buffers.
AlloyDB internals that set the compute line of AlloyDB pricing
The reason AlloyDB is not "PostgreSQL on a faster disk" is its disaggregated storage: the primary writes only WAL to a regional log service, a log processing service materialises pages into three-zone block storage, and every node reads blocks from that shared layer through a cache hierarchy of shared buffers, an optional local-SSD ultra-fast cache, and the storage service's own cache. Three consequences of that design decide how many vCPUs and how much memory you actually need, and therefore what the compute line should be.
The write path spends no compute on checkpoints
On self-managed PostgreSQL a meaningful share of I/O capacity and a smaller share of CPU is consumed by the checkpointer and background writer flushing dirty pages and by full-page writes inflating WAL. On AlloyDB none of that happens on your node: data blocks are never written from compute, and full-page images are not needed on the storage path.
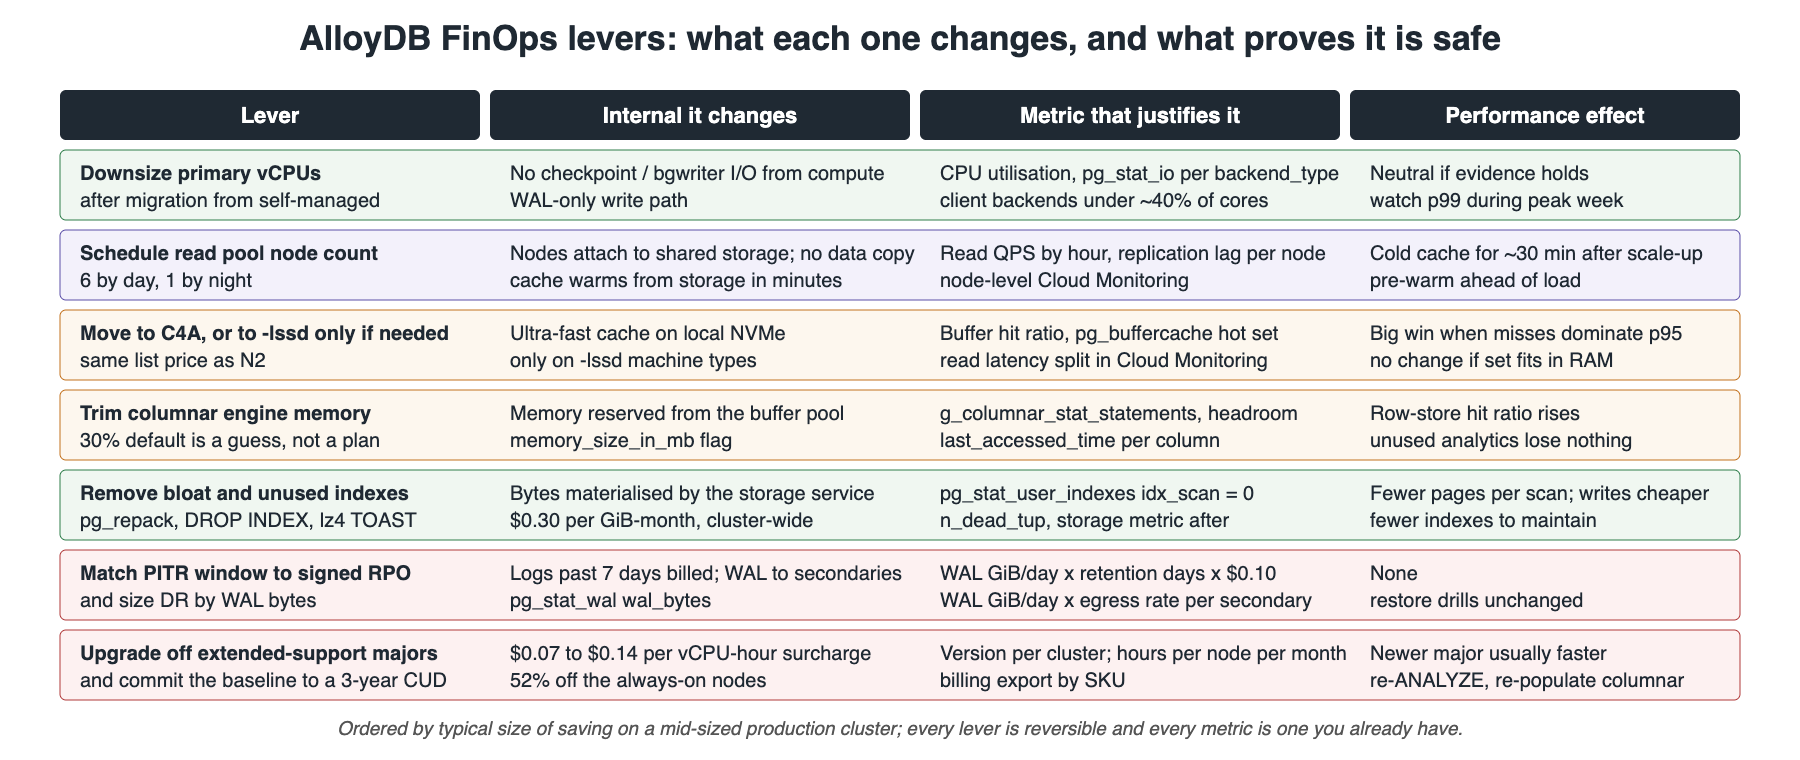
When you migrate a write-heavy OLTP workload, the vCPU count you carry over from a machine that was sized for checkpoint storms is too high. The measurement that tells you so is CPU utilisation in Cloud Monitoring and the split between backend_type rows in pg_stat_io: if the checkpointer and background writer rows are doing nothing and the client backends are under 40% of the cores, the node is a resize candidate.
The read path decides whether memory or local SSD is the cheaper cache
A read that misses shared buffers is served from the ultra-fast cache on -lssd machine types, otherwise from the storage service over the network. The FinOps question is which of the two is cheaper for your working set. GiB of RAM cost $0.0112 per hour on N2, so 64 extra GiB of memory is $523 a month. A C4 -lssd shape costs 38% more per vCPU but brings hundreds of GiB of local NVMe cache.
For a working set that exceeds RAM by a small margin, more memory on N2 or C4A is cheaper; for one that exceeds RAM by several times, a smaller -lssd node with a large ultra-fast cache is cheaper than buying enough RAM to hold it. You find out which case you are in with pg_buffercache and the buffer-hit ratio, not by guessing.
-- AlloyDB right-sizing evidence, part 1: how much of shared buffers is actually hot?
-- pg_buffercache is on the AlloyDB extension list. Run on the primary and on one read pool node.
CREATE EXTENSION IF NOT EXISTS pg_buffercache;

SELECT COUNT(*)                                        AS buffers_total,
       COUNT(*) FILTER (WHERE usagecount >= 3)         AS buffers_hot,
       pg_size_pretty(COUNT(*) FILTER (WHERE usagecount >= 3) * 8192::bigint) AS hot_working_set,
       ROUND(100.0 * COUNT(*) FILTER (WHERE usagecount >= 3) / COUNT(*), 1)  AS hot_pct
FROM   pg_buffercache;

-- Part 2: buffer hit ratio per database over the stats window (reset the window first to get a clean read)
SELECT datname,
       blks_hit,
       blks_read,
       ROUND(100.0 * blks_hit / NULLIF(blks_hit + blks_read, 0), 2) AS hit_pct,
       stats_reset
FROM   pg_stat_database
WHERE  datname NOT IN ('template0', 'template1', 'postgres')
ORDER  BY blks_read DESC;

-- Part 3: which relations are generating the misses (PostgreSQL 16+ pg_stat_io for the totals,
-- pg_statio_user_tables for the per-table view)
SELECT relname,
       heap_blks_read, heap_blks_hit,
       idx_blks_read,  idx_blks_hit,
       toast_blks_read
FROM   pg_statio_user_tables
ORDER  BY heap_blks_read + idx_blks_read DESC
LIMIT  15;
How to read it: a hot working set well under shared buffers with a hit ratio above 99% means the node is memory-rich; you can step down a size or move to a machine series with less RAM per vCPU. A hot working set that fills shared buffers, a hit ratio in the low 90s and a handful of large tables generating most of the misses means you are paying network latency for reads, and the choice is between more memory and a -lssd shape. The way I settle it is to run the same query mix on both for a day each and compare p95 read latency against the monthly price difference.
The columnar engine pays rent in memory
Enabling the columnar engine costs nothing on the invoice, but by default it reserves 30% of the instance's memory (google_columnar_engine.memory_size_in_mb), and that memory is taken from what would otherwise cache row-store pages. On a 128 GiB node that is roughly 38 GiB, about $310 a month at N2 rates, which is fine if the columnar scans that use it replace a read pool node that would have cost $900, and wasteful if the auto-columnarization job has loaded columns nobody queries. The evidence is g_columnar_stat_statements against the memory the columns occupy.
-- AlloyDB columnar engine: is the memory it holds earning its keep?
-- Resident columns and their size
SELECT relation_name,
       column_name,
       pg_size_pretty(size_in_bytes) AS resident,
       last_accessed_time
FROM   g_columnar_columns
ORDER  BY size_in_bytes DESC;

-- Statements that actually used columnar scans, with rows filtered and time spent
SELECT query_id, page_read, rows_filtered, total_time
FROM   g_columnar_stat_statements
ORDER  BY total_time DESC
LIMIT  20;

-- Headroom still unused by the engine, in MB. Large and stable = you over-allocated.
SELECT google_columnar_engine_memory_available();

-- Drop columns whose last_accessed_time is older than your reporting cycle
SELECT google_columnar_engine_drop(relation => 'public.events_2024', columns => 'payload,session_id');
Columns with a last_accessed_time older than the reporting cycle, or a persistently large google_columnar_engine_memory_available(), are the signal to drop columns or lower memory_size_in_mb. Conversely, if the analytical read pool spends most of its time in Custom Scan (columnar scan) and its nodes are CPU-bound, the cheapest change is often to give the columnar engine more memory on fewer nodes rather than add a node.
Read pools: the biggest variable line in AlloyDB pricing, and the easiest to schedule
Read pool nodes are the only part of AlloyDB compute that is both elastic and stateless from a billing perspective. Adding a node copies no data and adds nothing to the storage line; removing one loses nothing. The internals make this cheap: a new node attaches to the shared storage layer and warms its cache from it, which takes minutes rather than the hours a physical replica would need to restore. That is exactly the property a FinOps schedule wants. A reporting pool that needs six nodes from 08:00 to 20:00 on weekdays and one node otherwise runs at 43% of its 24×7 cost, and the change is one gcloud flag on a timer.
# AlloyDB read pool scheduling: scale the reporting pool with Cloud Scheduler + a Cloud Run job.
# 1. The scaling command itself (idempotent; safe to re-run)
gcloud alloydb instances update reporting \
  --cluster=${ALLOYDB_CLUSTER} \
  --region=${GCP_REGION} \
  --read-pool-node-count=6

# 2. A scheduler entry that runs the scale-up at 07:30 on weekdays and scale-down at 20:30
gcloud scheduler jobs create http alloydb-reporting-scale-up \
  --location=${GCP_REGION} \
  --schedule="30 7 * * 1-5" \
  --time-zone="Europe/London" \
  --uri="https://run.googleapis.com/v2/projects/${GCP_PROJECT}/locations/${GCP_REGION}/jobs/alloydb-scale:run" \
  --http-method=POST \
  --oauth-service-account-email=${SCALER_SA}@${GCP_PROJECT}.iam.gserviceaccount.com \
  --message-body='{"overrides":{"containerOverrides":[{"args":["reporting","6"]}]}}'

gcloud scheduler jobs create http alloydb-reporting-scale-down \
  --location=${GCP_REGION} \
  --schedule="30 20 * * 1-5" \
  --time-zone="Europe/London" \
  --uri="https://run.googleapis.com/v2/projects/${GCP_PROJECT}/locations/${GCP_REGION}/jobs/alloydb-scale:run" \
  --http-method=POST \
  --oauth-service-account-email=${SCALER_SA}@${GCP_PROJECT}.iam.gserviceaccount.com \
  --message-body='{"overrides":{"containerOverrides":[{"args":["reporting","1"]}]}}'

# The service account needs alloydb.instances.update on the cluster and nothing else.
Two internals set the guard rails. Scale up thirty minutes before the load arrives, because a fresh node's shared buffers and columnar cache are empty and the first reports will run slower while they fill from storage. And never scale a pool to zero to save money, because the one node that stays keeps the pool's endpoint alive and gives the scale-up something to attach behind; deleting and recreating the instance is slower and changes the IP. Horizontal read pool autoscaling on observed utilisation is in preview and will eventually replace the timer for bursty loads; for a diurnal load the timer is predictable and it is what I would run in production today.
Storage in AlloyDB pricing: the line that grows while nobody is watching
Regional storage is $0.0004109 per GiB-hour, about $0.30 per GiB-month, on every byte the storage service holds for the cluster. The internals that decide that byte count are pure PostgreSQL: dead tuples that vacuum has not reclaimed, index bloat from churn, TOAST data stored with the default pglz compression, and partitions that retention should have dropped. AlloyDB's adaptive autovacuum keeps dead-tuple accumulation in check better than static thresholds do, but it cannot shrink a table, and it does nothing about an index nobody uses.
-- AlloyDB storage line, decomposed: where are the billed bytes?
-- 1. Largest relations including indexes and TOAST
SELECT c.oid::regclass                                       AS relation,
       pg_size_pretty(pg_table_size(c.oid))                  AS heap_and_toast,
       pg_size_pretty(pg_indexes_size(c.oid))                AS indexes,
       pg_size_pretty(pg_total_relation_size(c.oid))         AS total,
       s.n_dead_tup,
       s.n_live_tup
FROM   pg_class AS c
JOIN   pg_stat_user_tables AS s ON s.relid = c.oid
WHERE  c.relkind IN ('r', 'm')
ORDER  BY pg_total_relation_size(c.oid) DESC
LIMIT  20;

-- 2. Indexes that are never scanned but are being paid for every hour
SELECT s.schemaname, s.relname, s.indexrelname,
       pg_size_pretty(pg_relation_size(s.indexrelid)) AS index_size,
       s.idx_scan
FROM   pg_stat_user_indexes AS s
JOIN   pg_index AS i ON i.indexrelid = s.indexrelid
WHERE  s.idx_scan = 0
  AND  NOT i.indisunique
  AND  NOT i.indisprimary
ORDER  BY pg_relation_size(s.indexrelid) DESC
LIMIT  20;

-- 3. Switch hot TOAST-heavy columns to lz4 (PostgreSQL 14+); existing values recompress on rewrite
ALTER TABLE events ALTER COLUMN payload SET COMPRESSION lz4;

-- 4. Retention by partition drop is free of bloat; retention by DELETE is not
-- (pg_partman is on the AlloyDB extension list; DROP is gated behind a change record in our runbooks)
-- DROP TABLE events_p2024_06;
For bloat that is already there, pg_repack is available on AlloyDB and rebuilds a table or index online with a short lock at the end; a VACUUM FULL takes an exclusive lock for the duration and belongs in a maintenance window. Either way, measure the storage metric in Cloud Monitoring before and after, because the storage service releases space at its own pace and the invoice follows the metric, not pg_total_relation_size.
Backups and the seven-day line
Continuous backup keeps the transaction logs needed for point-in-time recovery, and the first seven days of those logs are free; beyond that they are billed at the backup rate, $0.000137 per GiB-hour, around $0.10 per GiB-month. On-demand and scheduled backups are priced the same way. The driver here is WAL volume: AlloyDB removed full-page writes from the storage path, but a high-churn workload still generates WAL proportional to its updates, and a 35-day recovery window on a busy cluster is a lot of log. The FinOps rule is simple: set the recovery window to the RPO the business actually signed, not the maximum, and keep long-term retention in scheduled backups rather than in a long PITR window.
# AlloyDB backup FinOps: 14-day PITR window (the contract says 10), weekly scheduled backup kept 90 days
gcloud alloydb clusters update ${ALLOYDB_CLUSTER} \
  --region=${GCP_REGION} \
  --continuous-backup-recovery-window-days=14 \
  --automated-backup-days-of-week=SUNDAY \
  --automated-backup-start-times=02:00 \
  --automated-backup-retention-count=13

# Measure WAL generation per hour on the primary before changing the window: this is the log volume you pay for
# SELECT wal_bytes, stats_reset FROM pg_stat_wal;   -- diff two samples an hour apart
Network and cross-region: the WAL you ship is the bill you get
Traffic inside a region is free, which covers the application tier, the read pools and the storage service. Cross-region traffic from us-central1 is $0.05 per GiB to Europe, $0.08 to Asia and up to $0.14 to Latin America, and it is charged on every byte of WAL shipped to a secondary cluster.
That makes pg_stat_wal the cost meter for a DR design: a primary generating 400 GiB of WAL a day replicated to one European secondary is about $600 a month in egress on top of the secondary's own compute and storage, which is a number worth knowing before the architecture review rather than after the first invoice. An application tier in a different region from the cluster pays the same rates on query results, which is the more common surprise.
-- AlloyDB cross-region egress estimate: WAL bytes per day from pg_stat_wal (PostgreSQL 14+)
-- Take two samples 24 hours apart, or reset and read after a representative day.
SELECT wal_records,
       wal_fpi,                                  -- expect this near zero on AlloyDB
       pg_size_pretty(wal_bytes)     AS wal_since_reset,
       stats_reset,
       ROUND(wal_bytes / 1024.0^3, 1) AS wal_gib
FROM   pg_stat_wal;

-- Cost per secondary per month, illustrative: wal_gib_per_day * 30 * rate_per_gib
-- e.g. 400 GiB/day * 30 * $0.05 (us-central1 -> Europe) = $600
Extended support: the surcharge that dwarfs the vCPU price
Once a PostgreSQL major version leaves standard support on AlloyDB, every vCPU of every node in the cluster, including the standby and every read pool node, is charged an extended-support fee of $0.07 per vCPU-hour for the first two years and $0.14 in the third. That is more than the N2 vCPU price itself. The 16-vCPU regional primary from the worked example would pay an extra $1,635 a month in year one and $3,270 in year three, on a cluster whose base compute is $3,637.
No other single line item on the AlloyDB invoice moves that much for so little engineering. Major version upgrades on AlloyDB are managed and in-place; plan them a year ahead of the support date, rehearse on a restored clone, and treat the post-upgrade ANALYZE and columnar re-population as part of the change.
AlloyDB pricing with committed use discounts: commit the baseline, not the burst
AlloyDB committed use discounts are roughly 25% for one year and 52% for three years on both vCPU and memory, and they apply per machine series. The trap is committing to the peak. The regional primary is the baseline: it runs 24×7, its size changes rarely, and it is the right thing to put on a three-year commitment.
Read pools are the burst: if you schedule or autoscale them, the committed quantity should be the overnight floor, not the daytime peak, or you pay for nodes that are not running. And a commitment on N2 does not follow you to C4A; test the machine series before you commit, because the 52% discount is on whatever you bought, not on what you should have bought.
A cost model you can run against your own billing export
None of the AlloyDB pricing arithmetic above is worth much until it is your numbers. The reliable source is the Cloud Billing export to BigQuery, which itemises AlloyDB spend by SKU, resource and label, hour by hour. The query below groups a month of AlloyDB spend by cluster and by the five lines in this post; the Python model after it lets you price a proposed change (fewer read pool hours, a different machine series, a CUD on the primary) before you make it. Label every cluster with env and owner at creation time, because unlabelled spend is the part nobody optimises.
-- AlloyDB spend by cluster and cost line for the last complete month, from the Cloud Billing export
-- (standard usage cost export; replace the dataset and table with yours)
SELECT
  resource.name AS alloydb_resource,   -- cluster / instance path; group further by your own labels
  CASE
    WHEN sku.description LIKE '%vCPU%'                THEN 'compute_vcpu'
    WHEN sku.description LIKE '%RAM%'
      OR sku.description LIKE '%Memory%'              THEN 'compute_memory'
    WHEN sku.description LIKE '%Backup%'              THEN 'backup_storage'
    WHEN sku.description LIKE '%Storage%'             THEN 'cluster_storage'
    WHEN sku.description LIKE '%Extended Support%'    THEN 'extended_support'
    WHEN sku.description LIKE '%Egress%'
      OR sku.description LIKE '%Network%'             THEN 'network'
    ELSE 'other'
  END AS cost_line,
  ROUND(SUM(cost), 2)                                                    AS cost_usd,
  ROUND(SUM(IFNULL((SELECT SUM(c.amount) FROM UNNEST(credits) c), 0)), 2) AS credits_usd,
  ROUND(SUM(usage.amount), 2)                                            AS usage_amount,
  ANY_VALUE(usage.unit)                                                  AS usage_unit
FROM `${BILLING_PROJECT}.${BILLING_DATASET}.gcp_billing_export_v1_${BILLING_ACCOUNT}`
WHERE service.description = 'AlloyDB for PostgreSQL'
  AND invoice.month = FORMAT_DATE('%Y%m', DATE_SUB(DATE_TRUNC(CURRENT_DATE(), MONTH), INTERVAL 1 MONTH))
GROUP BY alloydb_resource, cost_line
ORDER BY alloydb_resource, cost_usd DESC;
#!/usr/bin/env python3
"""alloydb_cost_model.py: price an AlloyDB cluster shape from list prices, then price a change.

List prices are us-central1 on-demand as published in September 2026; edit RATES when they move.
Numbers produced here are illustrative estimates, not quotes. Validate against the billing export.
"""
from dataclasses import dataclass

HOURS_PER_MONTH = 730

RATES = {  # (vcpu_hour, gib_hour) on-demand; cud3 factor applied separately
    "n2":  (0.06608, 0.0112),
    "c4a": (0.06608, 0.0112),
    "c4":  (0.091,   0.0105),
    "z3":  (0.1315,  0.0175),
}
CUD = {"none": 1.0, "1y": 0.75, "3y": 0.48}
STORAGE_GIB_HOUR = 0.0004109
BACKUP_GIB_HOUR = 0.000137
EXTENDED_SUPPORT_VCPU_HOUR = {0: 0.0, 1: 0.07, 2: 0.07, 3: 0.14}   # year of extended support

@dataclass
class Instance:
    name: str
    series: str
    vcpu: int
    gib: int
    nodes: int                 # 2 for a REGIONAL primary, 1 for ZONAL, N for a read pool
    hours_per_month: float = HOURS_PER_MONTH
    cud: str = "none"

    def monthly(self) -> float:
        v, m = RATES[self.series]
        per_node_hour = self.vcpu * v + self.gib * m
        return per_node_hour * self.nodes * self.hours_per_month * CUD[self.cud]

@dataclass
class Cluster:
    instances: list
    storage_gib: float
    backup_gib_beyond_free: float
    extended_support_year: int = 0

    def lines(self) -> dict:
        compute = {i.name: round(i.monthly(), 2) for i in self.instances}
        vcpu_hours = sum(i.vcpu * i.nodes * i.hours_per_month for i in self.instances)
        return {
            **compute,
            "cluster_storage":  round(self.storage_gib * STORAGE_GIB_HOUR * HOURS_PER_MONTH, 2),
            "backup_storage":   round(self.backup_gib_beyond_free * BACKUP_GIB_HOUR * HOURS_PER_MONTH, 2),
            "extended_support": round(vcpu_hours * EXTENDED_SUPPORT_VCPU_HOUR[self.extended_support_year], 2),
        }

    def total(self) -> float:
        return round(sum(self.lines().values()), 2)


if __name__ == "__main__":
    today = Cluster(
        instances=[
            Instance("primary_regional", "n2", 16, 128, nodes=2),
            Instance("reporting_pool",   "n2",  8,  64, nodes=4),
        ],
        storage_gib=2048, backup_gib_beyond_free=2048,
    )
    proposed = Cluster(
        instances=[
            Instance("primary_regional", "c4a", 16, 128, nodes=2, cud="3y"),
            # 6 nodes for 12 h on weekdays (~260 h/month) + 1 node the rest of the time
            Instance("reporting_pool_day",   "c4a", 8, 64, nodes=6, hours_per_month=260),
            Instance("reporting_pool_floor", "c4a", 8, 64, nodes=1, hours_per_month=HOURS_PER_MONTH - 260),
        ],
        storage_gib=1640,               # after bloat and unused-index removal (measured, not assumed)
        backup_gib_beyond_free=900,     # 14-day window instead of 35
    )
    for label, c in (("today", today), ("proposed", proposed)):
        print(f"{label:9s} total ${c.total():>9,.2f}")
        for k, v in c.lines().items():
            print(f"           {k:24s} ${v:>9,.2f}")
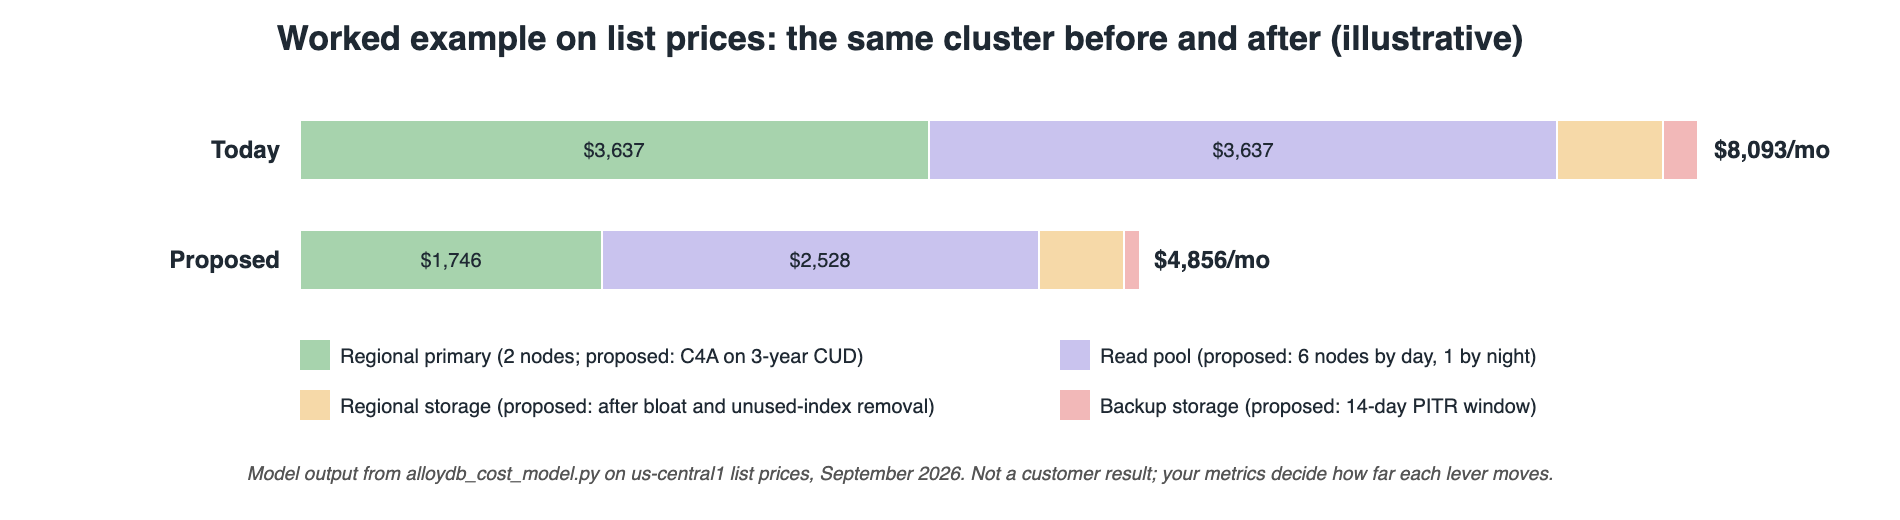
Run against the worked example, the model prices today's shape at about $8,100 a month and the proposed shape, with the primary on a three-year commitment, the reporting pool scheduled, and storage and backups trimmed to what the measurements support, at roughly $4,900, a 40% reduction. I want to be clear that those are model outputs on list prices, not results from a customer estate; your savings depend entirely on how much of each lever the metrics allow you to pull. The point of the script is that you can find out in an afternoon.
Is AlloyDB the right place to spend this money at all?
We are vendor-neutral and this section is why. On list price, and AlloyDB pricing is list price until you commit, Cloud SQL for PostgreSQL Enterprise Plus in the same region is cheaper for the same shape: an HA 16-vCPU, 128 GiB instance is $0.1074 per vCPU-hour and $0.0182 per GiB-hour with HA included, about $2,955 a month against AlloyDB's $3,637 for the regional primary, and its SSD storage with HA is $0.000465753 per GiB-hour, around $0.34 per GiB-month against AlloyDB's $0.30.
If your workload is a well-cached OLTP database that never needed a read replica, Cloud SQL Enterprise Plus is the cheaper managed PostgreSQL and I would say so in the review. AlloyDB earns its premium when you use what the internals give you: read pools that cost no storage, the columnar engine replacing an ETL hop and a warehouse for operational reporting, and a write path that lets you run a smaller primary than the same workload needs elsewhere.
Two more comparisons belong in the same review. AlloyDB Omni, the downloadable engine, is $40 per vCPU per month on a month-to-month subscription, which for a 16-vCPU node is $640 a month plus whatever your own hardware or Compute Engine VM costs; it carries the columnar engine and the query-layer features but not the disaggregated storage, so it is a strong fit for development, test and on-premises estates and a poor substitute for the managed service's HA.
And self-managed PostgreSQL on Compute Engine with Patroni, pgBackRest and PgBouncer is cheaper still on infrastructure and more expensive in engineering time; whether that trade is right depends on whether you already have the team, which is a question about your organisation and not about the database.
AlloyDB FinOps: what I would do in the first thirty days
Turn on the billing export and label the clusters, because AlloyDB FinOps without the export is guesswork and everything else depends on seeing the lines. Check the major version on every cluster and put any that is in or within a year of extended support on an upgrade plan; that is the largest saving per hour of work on the whole list.
Run the buffer-cache and columnar queries on the primary and one read pool node for a representative week and decide, with the numbers in front of you, whether the machine series, the memory and the columnar allocation are right. Put the reporting pool on a schedule. Decompose the storage line, drop the indexes with zero scans, and fix the retention that is being done with DELETE. Then, and only then, commit the regional primary to a three-year CUD on the machine series you have actually tested.
The standing caveat applies to every change above: test it against a copy of your production workload before it goes near production, keep a rehearsed restore and a rehearsed failover in place, and treat the preview features (read pool autoscaling, enhanced backups) as things to evaluate rather than plan savings around until they are GA. If you want a second pair of eyes on an AlloyDB FinOps review, a machine-series decision, or a Cloud SQL versus AlloyDB versus self-managed comparison for your own numbers, that is the work the MinervaDB PostgreSQL consulting team does across Google Cloud, AWS and on-premises.
References
AlloyDB for PostgreSQL pricing · AlloyDB Omni pricing · Cloud SQL pricing · AlloyDB overview · AlloyDB under the hood: intelligent, database-aware storage · Monitor the columnar engine · Create a read pool instance · Create a cluster and its primary instance · gcloud alloydb clusters update · Export Cloud Billing data to BigQuery · Google AlloyDB architecture, internals and performance (MinervaDB)
Running PostgreSQL in production? MinervaDB provides PostgreSQL consulting, 24×7 PostgreSQL support and PostgreSQL remote DBA services as part of its database consulting services.
Running this in production?
MinervaDB provides AlloyDB Consulting, PostgreSQL Consulting, PostgreSQL Support and PostgreSQL Remote DBA with 24x7 coverage and a 15-minute S1 response. Talk to an engineer.