There are only five things a database can be slow at, and every engine gives each of them a different name. A query waits for a plan, for a page, for a lock, for a write to be made durable, or for a connection to be served, and that is the whole list; the two hundred tuning parameters across PostgreSQL, MySQL, SQL Server, Oracle, Db2, SAP HANA, MongoDB and Azure SQL are all knobs on one of those five waits.
Database performance tuning that starts from the parameter list never finishes; tuning that starts from the five waits finishes in the order the evidence dictates.
This page is the cross-engine version of that list. Each section takes one bottleneck, states what it is in engine-neutral terms, names the counter or view that shows it in each of the engines the archive covers, and links the archive post where the bottleneck is worked on that engine.
The point of the cross-engine view is not that the engines are the same, which they are not, but that an engineer who knows where the five waits live on one engine can find them on another in an afternoon, and a review method built on the five transfers across an estate that runs all of them.
The archive it introduces covers expensive SQL on Exadata and on SQL Server 2025, Db2 13 for z/OS index efficiency, PgBouncer pool saturation, SQL Server 2022 IOPS, Azure SQL troubleshooting and caching, SAP HANA slow-query diagnosis, MongoDB tuning from a millisecond to a hundred microseconds, and MariaDB in cloud and container environments.
Database performance tuning bottleneck 1: the plan
The first wait is the one the optimizer imposes: a plan that touches more rows, more index entries or more partitions than the result needs. It is the most common cause of a slow query on every engine and the one with the largest range of outcomes, because a wrong join order or a missed index can cost three orders of magnitude while a wrong buffer size costs a factor of two.
The evidence is the plan itself with actual row counts against estimated ones, and the tell is the same everywhere: an estimate off by a factor of ten or more at the point where the plan diverges from what the data would suggest.
The archive’s plan posts span the engines. expensive SQL on Exadata 26.1: reading the plan is the Oracle version, where the smart-scan offload and the storage indexes make a full scan cheap enough that the optimizer chooses it more often than a DBA from another engine expects. SQL Server 2025 expensive queries: seven proven fixes is the SQL Server version, with the Query Store as the plan history and parameter sniffing as the recurring cause.
Db2 13 for z/OS index efficiency: eight proven checks is the mainframe version, where the access path from EXPLAIN and the RUNSTATS currency decide the plan and a stale catalog is the usual culprit. diagnosing slow queries in SAP HANA is the in-memory version, where the plan is read from the PlanViz trace and the cost is in column-store scans and joins that spill to row engine.
Database performance tuning bottleneck 2: the page
The second wait is for data that is not in memory. Every engine has a cache (buffer pool, buffer cache, shared buffers, bufferpool, WiredTiger cache, the HANA column store itself) and a miss ratio, and the tuning question is always the same: does the working set fit, and if not, which pages are being evicted to make room for a scan that should not have been cached.
The evidence is the miss ratio against a baseline and the physical-read rate against the logical-read rate, and the fix is one of three: a smaller working set (a better plan, bottleneck one), a larger cache, or a policy that keeps scans from polluting it.
troubleshooting SQL Server 2022 IOPS is the archive’s post on the page wait when the cache is not enough and the storage has to deliver, with sys.dm_io_virtual_file_stats and the wait types PAGEIOLATCH_SH and PAGEIOLATCH_EX as the evidence.
MongoDB performance tuning from 1 ms to 100 microseconds is the document-store version, where the WiredTiger cache, its eviction thresholds and the read tickets decide whether a query touches memory or disk. tuning MariaDB for cloud and containerised environments covers the case where the cache is sized against a container limit rather than a host, and the kernel’s out-of-memory killer is the eviction policy nobody chose.
-- the five bottlenecks, one query each, on three engines (illustrative; adapt views to the running version)

-- PostgreSQL 13+: plan, page, lock, durability, connection in one pass
SELECT 'plan'       AS bottleneck, ROUND(SUM(total_exec_time)::numeric, 0) AS total_ms
FROM   pg_stat_statements
UNION ALL
SELECT 'page',       ROUND(100.0 * SUM(blks_read) / NULLIF(SUM(blks_hit + blks_read), 0), 2)
FROM   pg_stat_database
UNION ALL
SELECT 'lock',       COUNT(*)
FROM   pg_stat_activity WHERE wait_event_type = 'Lock'
UNION ALL
SELECT 'durability', COUNT(*)
FROM   pg_stat_activity WHERE wait_event IN ('WALWrite', 'WALSync')
UNION ALL
SELECT 'connection', COUNT(*)
FROM   pg_stat_activity WHERE backend_type = 'client backend';

-- MySQL 8.0+: the same five from status counters and the Performance Schema
SELECT variable_name, variable_value
FROM   performance_schema.global_status
WHERE  variable_name IN ('Innodb_buffer_pool_reads', 'Innodb_buffer_pool_read_requests',
                         'Innodb_row_lock_waits', 'Innodb_os_log_fsyncs',
                         'Threads_connected', 'Threads_running', 'Slow_queries');

-- SQL Server 2019+: waits grouped into the five, from the cumulative wait statistics
SELECT w.bottleneck,
       SUM(w.wait_time_ms)        AS wait_ms,
       SUM(w.waiting_tasks_count) AS waits
FROM  (SELECT CASE
                WHEN wait_type LIKE 'PAGEIOLATCH%'                          THEN 'page'
                WHEN wait_type LIKE 'LCK_M_%'                               THEN 'lock'
                WHEN wait_type IN ('WRITELOG', 'LOGBUFFER')                 THEN 'durability'
                WHEN wait_type IN ('THREADPOOL', 'RESOURCE_SEMAPHORE')      THEN 'connection'
                WHEN wait_type IN ('SOS_SCHEDULER_YIELD', 'CXPACKET', 'CXCONSUMER') THEN 'plan'
                ELSE 'other'
              END AS bottleneck,
              wait_time_ms,
              waiting_tasks_count
       FROM   sys.dm_os_wait_stats) AS w
GROUP  BY w.bottleneck
ORDER  BY wait_ms DESC;
Three engines, one shape: the first query an engineer runs on an unfamiliar server is the one that says which of the five waits is the largest, and everything after it is a drill-down. The SQL Server grouping is a simplification (CPU-bound plans show as scheduler yields, and parallelism waits are a symptom rather than a cause), which is why the archive’s per-engine posts exist.
Database performance tuning bottleneck 3: the lock
The third wait is for another transaction. It is the bottleneck that does not respond to hardware, because a query waiting on a row lock waits exactly as long on a faster server, and it is the one that most often appears suddenly: a new report, a longer transaction, an index change that turned a row lock into a range lock.
The evidence is the lock wait count and the blocking chain, with the head of the chain (the session holding the oldest lock) as the target; the fix is almost always to shorten that session’s transaction or to change the plan that made it hold more locks than it needed.
Every engine exposes the chain, under different names: pg_blocking_pids() and the Lock wait-event class, performance_schema.data_lock_waits and Innodb_row_lock_waits, sys.dm_tran_locks and the LCK_M_* waits, V$SESSION.BLOCKING_SESSION, HANA’s M_BLOCKED_TRANSACTIONS, MongoDB’s currentOp with waitingForLock. The SQL Server and Exadata posts above both spend their longest sections here, because on both engines a plan regression (bottleneck one) usually shows up first as a lock wait (bottleneck three) on the rows the slow plan holds longer.
Database performance tuning bottleneck 4: durability
The fourth wait is for the commit to be made safe. Every engine writes a log before acknowledging a commit (WAL, redo, the transaction log, the log buffer, the journal, the HANA log segment), and the wait is the fsync or the replication acknowledgement behind it.
It is the bottleneck that tuning most often trades against safety, and the trade should be explicit: synchronous_commit, innodb_flush_log_at_trx_commit, delayed durability on SQL Server, COMMIT NOWAIT on Oracle, and the write concern on MongoDB all buy commit latency by widening the window of data lost in a crash. The evidence is the log-write latency and the fraction of total wait time it accounts for; if it is small, the trade is not worth making at any price.
The archive’s cloud posts are where this wait most often surprises. Azure SQL performance troubleshooting: seven proven steps covers the case where the log write is a replicated write across availability zones and its latency is a property of the service tier, not of a setting, and eight proven Azure SQL caching strategies for sub-millisecond reads is the response: if the write path cannot be made faster, the read path that depends on it can be moved out of its way.
The MariaDB-in-cloud post above has the same finding on network-attached storage, where the fsync latency is the storage service’s and the only lever is the durability setting.
Database performance tuning bottleneck 5: the connection
The fifth wait is the one before the query starts: the time a request spends waiting for a connection from a pool, for a worker thread on the server, or for admission through a resource governor. It is the bottleneck most often diagnosed as one of the other four, because a saturated pool makes every query appear slow from the application’s side while the database reports nothing wrong, and it is the one that scales worst with traffic, since the queue length grows faster than the arrival rate once the pool is full.
PgBouncer pool saturation: diagnosing connection waits is the archive’s post on the PostgreSQL side, where SHOW POOLS reports cl_waiting and maxwait, and the fix is either a larger pool (up to the point where the server’s own max_connections and per-backend memory become the limit) or a shorter transaction so that pooled connections turn over faster.
On SQL Server the same wait is THREADPOOL and on MySQL it is Threads_running against the thread pool size (or, without a thread pool, against the cores); on MongoDB it is the connection count against the WiredTiger tickets. The engineer’s rule is that the fifth wait is checked first on any ticket that says “everything is slow”, because it is the one that makes everything slow at once.
The five database performance tuning bottlenecks across engines
| Bottleneck | PostgreSQL | MySQL / MariaDB | SQL Server / Azure SQL | Oracle / Db2 / HANA / MongoDB |
|---|---|---|---|---|
| 1. Plan | EXPLAIN (ANALYZE, BUFFERS), pg_stat_statements, auto_explain |
EXPLAIN ANALYZE (8.0.18+), events_statements_summary_by_digest |
Query Store, actual execution plan, sys.dm_exec_query_stats |
AWR / SQL Monitor; Db2 EXPLAIN + RUNSTATS; HANA PlanViz; MongoDB explain("executionStats") |
| 2. Page | pg_stat_database hit ratio, pg_stat_io (16+) |
Innodb_buffer_pool_reads vs read_requests |
PAGEIOLATCH_* waits, sys.dm_io_virtual_file_stats |
Buffer cache hit / physical reads; Db2 bufferpool hit ratio; HANA unloads; WiredTiger cache eviction |
| 3. Lock | Lock wait events, pg_blocking_pids() |
data_lock_waits, Innodb_row_lock_waits |
LCK_M_* waits, sys.dm_tran_locks |
V$SESSION.BLOCKING_SESSION; Db2 MON_GET_LOCKS; M_BLOCKED_TRANSACTIONS; currentOp |
| 4. Durability | WALWrite / WALSync waits, synchronous_commit |
Innodb_os_log_fsyncs, innodb_flush_log_at_trx_commit |
WRITELOG wait, delayed durability |
log file sync; Db2 log write time; HANA log write latency; write concern |
| 5. Connection | PgBouncer cl_waiting / maxwait, max_connections |
Threads_running, thread pool, ProxySQL queue |
THREADPOOL, RESOURCE_SEMAPHORE, DTU/vCore limits |
Session limits; Db2 MAXAPPLS; HANA workload classes; WiredTiger tickets |
The cells name where to look, not what value is acceptable; thresholds come from each server’s own baseline, and a hit ratio that is fine on one workload is a problem on another.
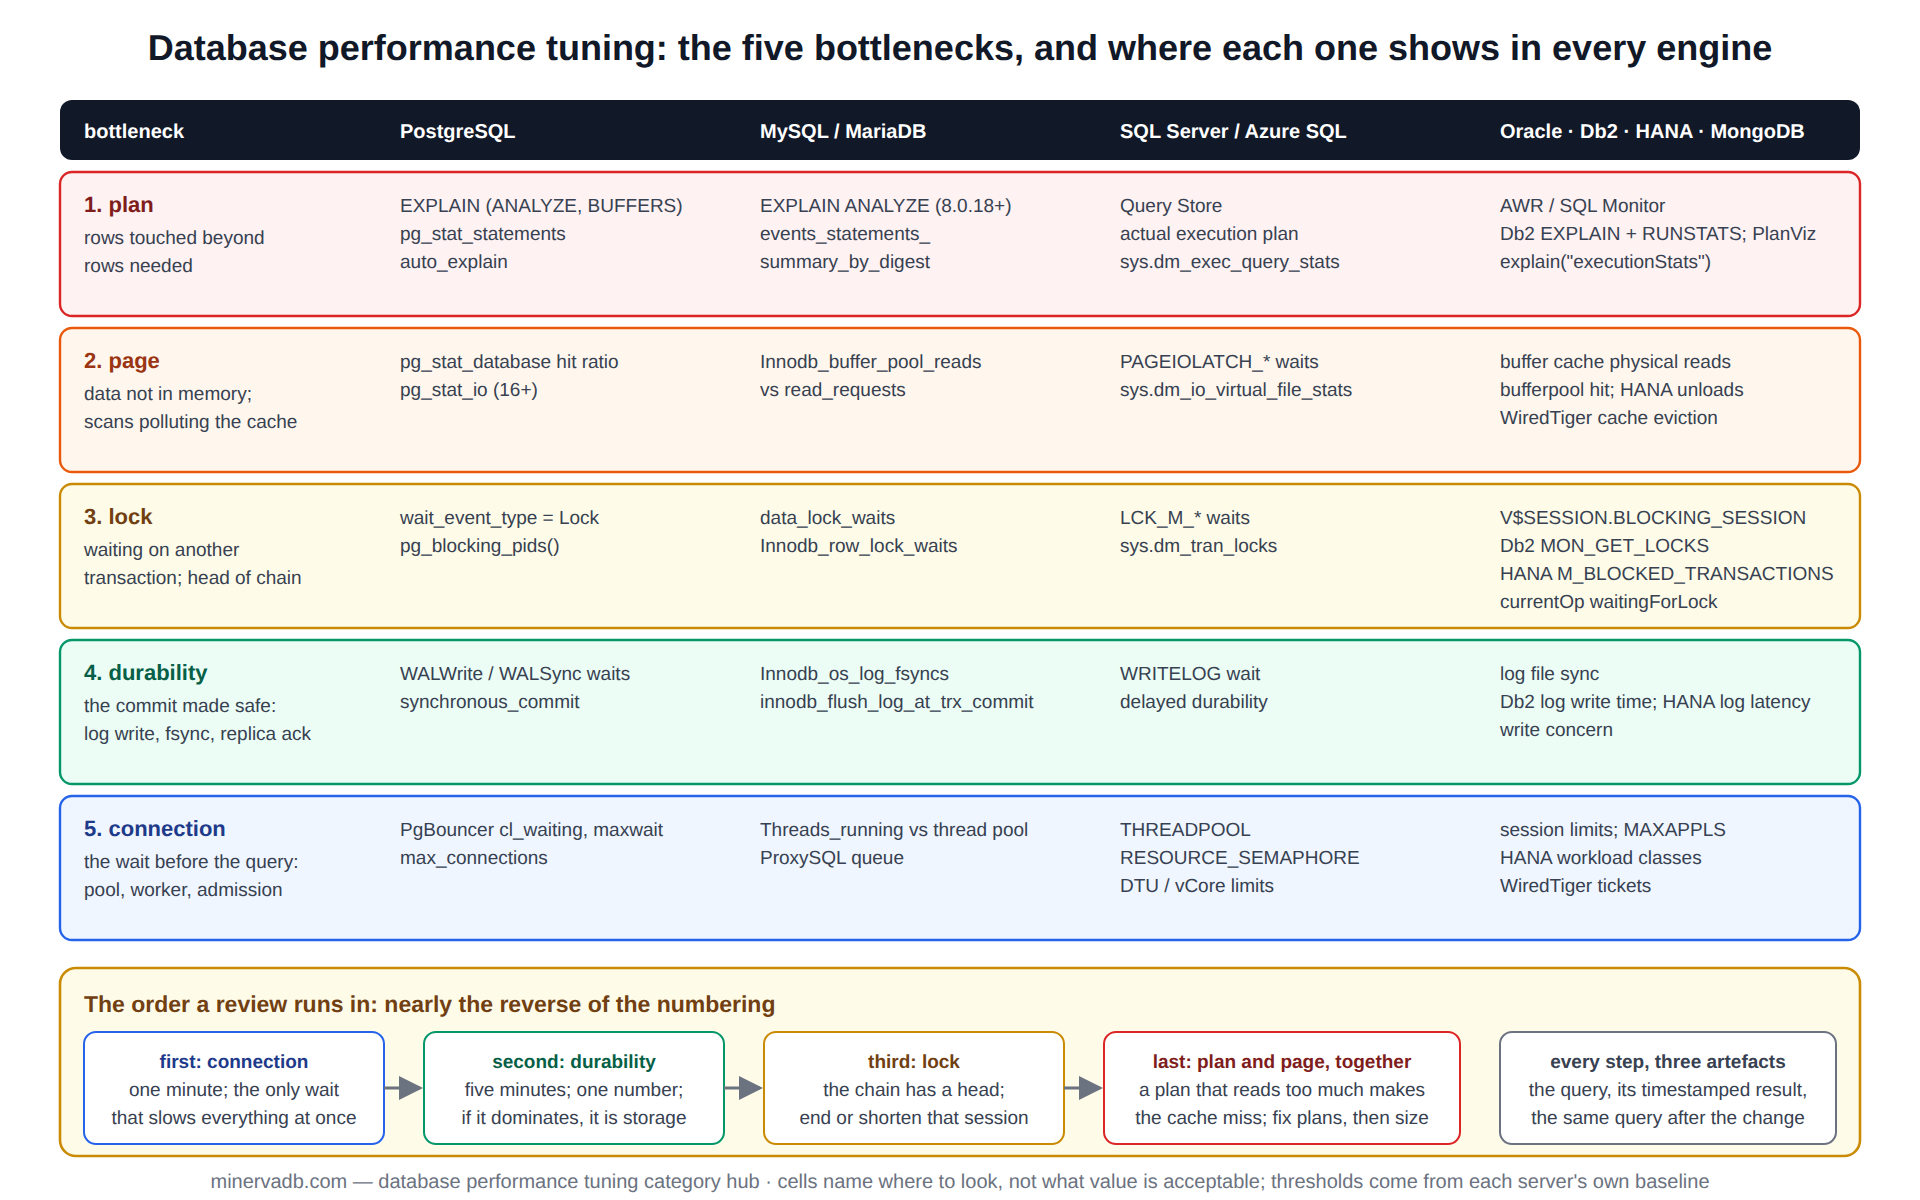
The order a database performance tuning review runs in
The five are worked in an order that is nearly the reverse of the numbering. The connection wait is checked first, in a minute, because it is the cheapest to rule out and the only one that explains “everything is slow at once”.
Durability is second, in five minutes, because the log-write latency is a single number and if it dominates, the rest of the review is storage rather than database. Locks are third, because a blocking chain has a head and the head is usually a single session that can be ended or a single transaction that can be shortened.
The plan and the page are last, together, because they are the same problem seen from two sides: a plan that reads too much makes the cache miss, and a cache that is too small makes a correct plan look slow. The review takes the top statements by total time, reads their plans with actual counts, and asks of each whether the rows touched are the rows needed; only when the plans are right is the cache sized, because sizing a cache to fit a bad plan is paying for the bug.
Each step produces the same three artefacts: the query that measured the wait, its result with a timestamp, and the same query after the change.
A recommendation is written as the bottleneck it removes and the fraction of total wait time that bottleneck accounted for, so that a customer can see why one index is ahead of a memory upgrade in the list, and every change carries its blast radius and rollback: a new index is built online where the engine allows it and dropped if the plan does not use it; a durability setting is changed on a replica first and never on a primary without the data-loss window written down; a pool size is raised in steps with the server’s connection count watched.
Version notes: the views named here move between releases (pg_stat_io arrived in PostgreSQL 16, EXPLAIN ANALYZE in MySQL 8.0.18, Query Store hints in SQL Server 2022, the Db2 13 function levels, the HANA 2.0 SPS revisions), and managed services expose subsets of them, so confirm the running version and edition before applying a query from an archive post.
Test every change on a replica or a staging copy carrying production-shaped load, keep the previous value of every setting in the ticket, and treat the durability bottleneck with the DR posture in view: a commit-latency win bought with a wider data-loss window is a recovery-point decision, not a tuning one.
What database performance tuning is not
It is not a parameter sweep. A review that changes twelve settings at once and reports that the server is faster has learned nothing about which of the five waits it removed, cannot say which change to keep, and has no rollback narrower than all twelve. It is also not a benchmark: a synthetic load that exercises one bottleneck says nothing about the other four, and the archive’s posts are careful to report the customer’s own workload numbers, labelled as theirs, rather than a figure that would not survive contact with a different query mix.
Where this database performance tuning archive sits
This archive is the cross-engine method above the per-engine archives on minervadb.com. The PostgreSQL archive and PostgreSQL index archive go deep on bottleneck one for that engine, the InnoDB archive works bottlenecks two through four as eight wait points on MySQL, the MySQL performance archive is the seven-stage latency budget of a MySQL query, the Linux archive is the host layer under all five, and the monitoring archive is where the five waits become alerts.
The most complete single-engine catalogue of the waits named here is the sys.dm_os_wait_stats reference in the SQL Server documentation, whose wait-type list is a useful vocabulary even for engineers on other engines.
For a performance review of an estate that runs several of these engines, a single-engine deep dive that reports its findings as the five bottlenecks with the share of wait time each accounts for, or 24×7 support in which the on-call engineer starts from the connection wait and works up, the MinervaDB database consulting practice runs this method, and states for every recommendation which bottleneck it removes and by how much.