Azure SQL performance troubleshooting starts in a different place from on-premises SQL Server work. There is no operating system to inspect, no sys.dm_os_wait_stats that means what it used to, and the first suspect is almost never the query. It is the resource envelope Azure has wrapped around the database. Every Azure SQL Database runs under a resource governor that meters CPU, worker threads, memory, data IO and transaction log throughput against the limits of the service objective you pay for. When a workload brushes against one of those limits the symptom looks like a slow query, a timeout or a connection error, and the cause is frequently a ceiling.
This post is the method we use on customer estates for Azure SQL performance work: seven steps, each anchored to a specific DMV or Query Store view, with the queries we actually run and the reading of the output that tells us which branch to take next. It covers Azure SQL Database (single databases, elastic pools, serverless and Hyperscale). Azure SQL Managed Instance shares most of the DMVs but has its own instance-level governance, and we call out the differences where they matter.
Why Azure SQL performance problems look different
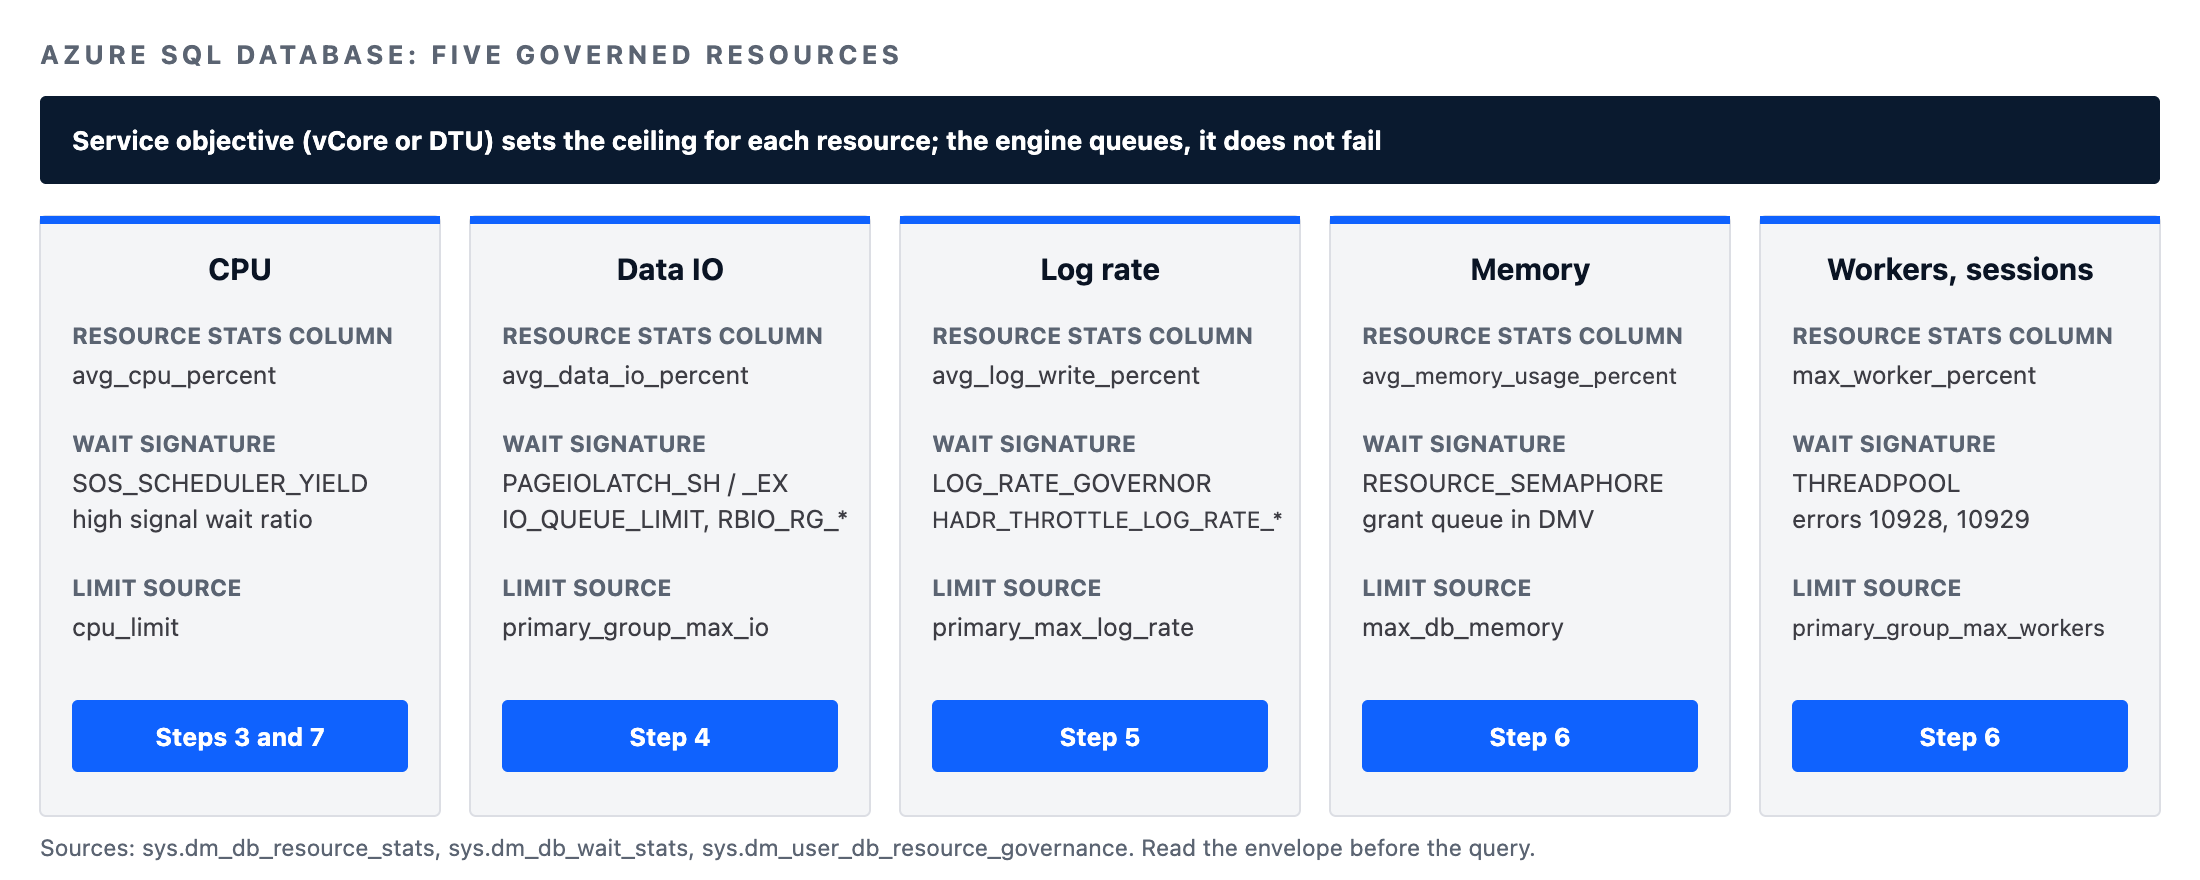
On a self-managed server the machine is the boundary, and Azure SQL performance troubleshooting has to start by relearning where the boundary sits. On Azure SQL Database the boundary is the service objective: a General Purpose 8-vCore database is a fixed allocation of CPU, a fixed worker cap, a memory ceiling, an IOPS and throughput limit on remote storage, and a transaction log write rate that Microsoft governs to protect the replication and backup pipeline. Exceed any one of them and the engine does not fail; it queues.
That queuing surfaces as a family of Azure-specific wait types you will not see on a bare-metal instance: LOG_RATE_GOVERNOR, POOL_LOG_RATE_GOVERNOR, IO_QUEUE_LIMIT, RBIO_RG_STORAGE on Hyperscale, and HADR_THROTTLE_LOG_RATE_SEND_RECV_QUEUE_SIZE when a secondary falls behind.
The second difference is scope. Several DMVs that are server-wide on SQL Server are database-scoped in Azure SQL Database. sys.dm_db_wait_stats replaces sys.dm_os_wait_stats, sys.dm_db_resource_stats is the resource view that matters, and sys.dm_user_db_resource_governance tells you the exact limits your database is running under right now. Reading those three views correctly is most of the Azure SQL performance diagnostic work. The rest is ordinary query tuning, which Query Store makes considerably easier than it is on an unmanaged server.
Step 1: read the Azure SQL performance envelope before anything else
Every Azure SQL performance investigation we run begins with sys.dm_db_resource_stats. It records one row every 15 seconds for the last hour, expressed as a percentage of the service objective's limits, so a value near 100 in any column is a ceiling being hit, not a busy server.
-- Azure SQL performance envelope, last 60 minutes at 15-second granularity
SELECT
    end_time,
    avg_cpu_percent,
    avg_data_io_percent,
    avg_log_write_percent,
    avg_memory_usage_percent,
    max_worker_percent,
    max_session_percent,
    avg_instance_cpu_percent,      -- host-level CPU, relevant for serverless and pools
    avg_instance_memory_percent
FROM sys.dm_db_resource_stats
ORDER BY end_time DESC;
The columns map directly to the five governed resources. avg_cpu_percent is compute against the vCore or DTU allocation. avg_data_io_percent is data file IOPS and throughput against the tier limit; on General Purpose that is remote Premium storage with single-digit-millisecond latency, which is why this column saturates first on read-heavy workloads. avg_log_write_percent is transaction log generation against the governed log rate, the ceiling most often responsible for "the bulk load got slower after we moved to Azure". max_worker_percent and max_session_percent are the thread and connection caps that produce errors 10928 and 10929 when exceeded.
For anything older than an hour, sys.resource_stats in master keeps 14 days at five-minute granularity. We use it to answer the question customers ask first, which is whether the database was already running hot before the incident or whether something changed.
-- Run in master: 14-day Azure SQL performance history, 5-minute buckets
SELECT
    start_time,
    end_time,
    avg_cpu_percent,
    avg_data_io_percent,
    avg_log_write_percent,
    max_worker_percent,
    dtu_limit,
    sku
FROM sys.resource_stats
WHERE database_name = N'${AZSQL_DATABASE}'
  AND start_time >= DATEADD(DAY, -14, SYSUTCDATETIME())
ORDER BY start_time DESC;
Then confirm what the limits actually are. The number that matters for log-heavy workloads is primary_max_log_rate, expressed in bytes per second, and the worker cap is primary_group_max_workers. Both change when you scale, and both are the first thing we check when a customer says the workload "used to be fine on the old tier".
-- Azure SQL performance limits: exact governance values for this database and service objective
SELECT
    database_name,
    slo_name,
    cpu_limit,
    max_db_memory,
    max_db_max_size_in_mb,
    primary_max_log_rate,          -- bytes per second
    primary_group_max_workers,
    primary_group_max_io,
    govern_background_io,
    instance_cap_cpu,
    instance_max_log_rate,
    instance_max_worker_threads
FROM sys.dm_user_db_resource_governance;
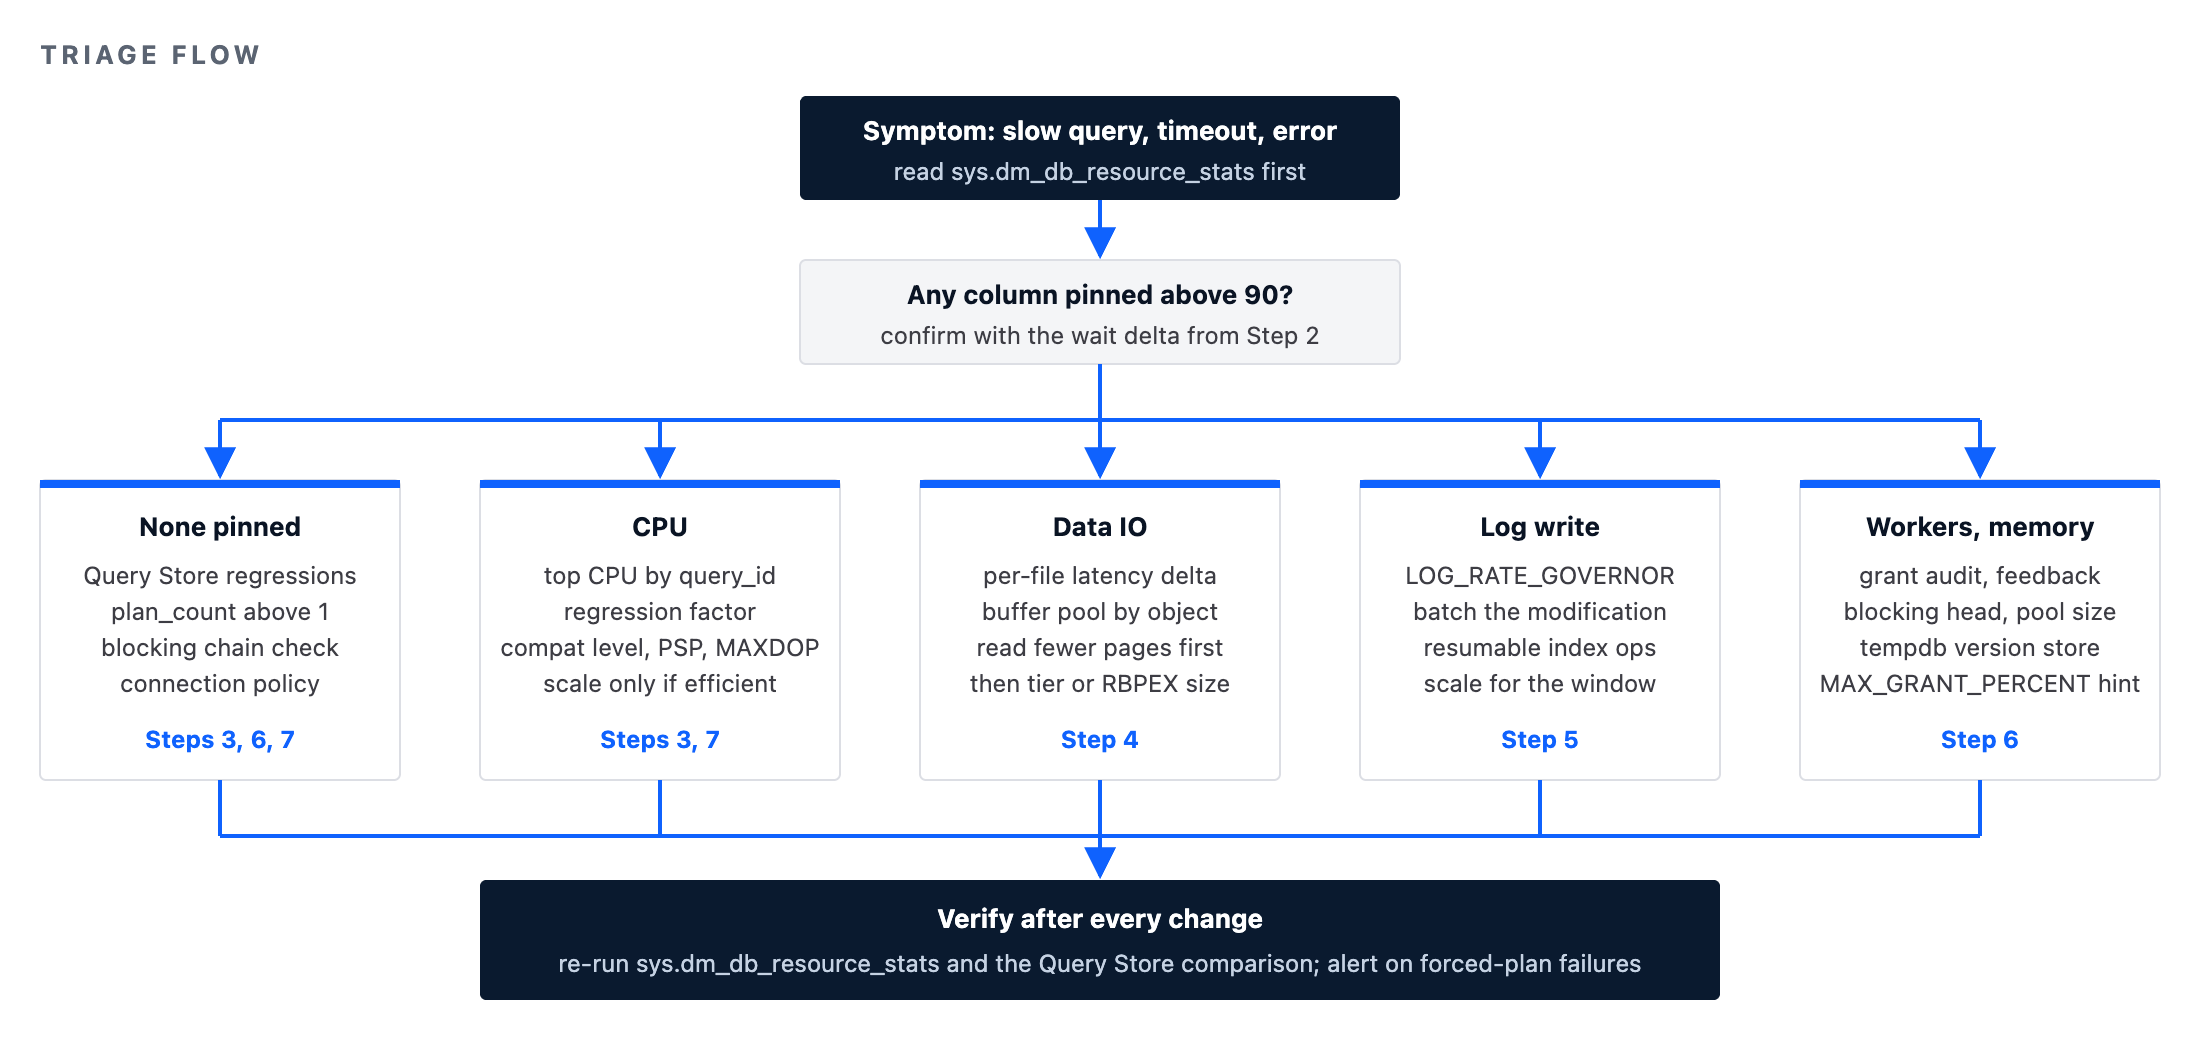
If every percentage column in sys.dm_db_resource_stats is comfortably below 70 during the slow period, the problem is not the envelope and we go straight to Step 3. If one column is pinned, that column decides the branch: CPU goes to Step 3 and Step 7, data IO to Step 4, log write to Step 5, workers or memory to Step 6.
Step 2: wait statistics, the Azure SQL performance way
sys.dm_db_wait_stats is cumulative since the database was last moved or restarted, which on Azure SQL Database happens more often than people expect: every scale operation, every planned maintenance failover and every Business Critical replica promotion resets it. So we never read the raw view. We take two snapshots across the slow window and diff them.
-- Delta wait sample for Azure SQL performance triage: run once, wait N minutes, run again
IF OBJECT_ID('tempdb..#w1') IS NULL
    SELECT wait_type, waiting_tasks_count, wait_time_ms, signal_wait_time_ms
    INTO #w1
    FROM sys.dm_db_wait_stats;

-- ... let the slow window elapse ...

SELECT TOP (15)
    w2.wait_type,
    w2.waiting_tasks_count - w1.waiting_tasks_count            AS waits,
    w2.wait_time_ms        - w1.wait_time_ms                   AS wait_ms,
    w2.signal_wait_time_ms - w1.signal_wait_time_ms            AS signal_ms,
    (w2.wait_time_ms - w1.wait_time_ms) * 1.0
        / NULLIF(w2.waiting_tasks_count - w1.waiting_tasks_count, 0) AS avg_wait_ms
FROM sys.dm_db_wait_stats AS w2
JOIN #w1 AS w1
  ON w1.wait_type = w2.wait_type
WHERE w2.wait_type NOT IN (
    N'SLEEP_TASK', N'BROKER_TASK_STOP', N'CLR_AUTO_EVENT', N'CLR_MANUAL_EVENT',
    N'LAZYWRITER_SLEEP', N'SLEEP_SYSTEMTASK', N'SQLTRACE_BUFFER_FLUSH',
    N'WAITFOR', N'XE_DISPATCHER_WAIT', N'XE_TIMER_EVENT', N'CHECKPOINT_QUEUE',
    N'HADR_FILESTREAM_IOMGR_IOCOMPLETION', N'DIRTY_PAGE_POLL', N'SP_SERVER_DIAGNOSTICS_SLEEP',
    N'REQUEST_FOR_DEADLOCK_SEARCH', N'LOGMGR_QUEUE', N'ONDEMAND_TASK_QUEUE',
    N'BROKER_RECEIVE_WAITFOR', N'PVS_PREALLOCATE', N'VDI_CLIENT_OTHER',
    N'RBIO_COMM_RETRY', N'HADR_WORK_QUEUE', N'HADR_TIMER_TASK', N'HADR_CLUSAPI_CALL',
    N'HADR_LOGCAPTURE_WAIT', N'HADR_NOTIFICATION_DEQUEUE', N'PREEMPTIVE_XE_GETTARGETSTATE'
)
ORDER BY wait_ms DESC;
The wait types that decide the Azure SQL performance branch, and what each one means on this platform:
| Wait type | Governed resource | What it tells you on Azure SQL Database |
|---|---|---|
SOS_SCHEDULER_YIELD, high signal wait ratio | CPU | Runnable queue pressure inside the vCore allocation. Confirm with avg_cpu_percent; fix in Step 3 and Step 7 before scaling. |
LOG_RATE_GOVERNOR | Log rate (database) | Transaction log generation is being throttled to primary_max_log_rate. Step 5. |
POOL_LOG_RATE_GOVERNOR, INSTANCE_LOG_RATE_GOVERNOR | Log rate (pool / instance) | The elastic pool or managed instance as a whole is at its log ceiling, so a neighbour can be the cause. |
HADR_THROTTLE_LOG_RATE_SEND_RECV_QUEUE_SIZE | Log rate (replication) | Primary slowed because a geo-secondary or Business Critical replica cannot keep up; check secondary health before touching the primary. |
PAGEIOLATCH_SH, PAGEIOLATCH_EX | Data IO | Physical reads. On General Purpose this is remote storage latency; on Hyperscale it means the page is not in RBPEX. Step 4. |
IO_QUEUE_LIMIT | Data IO | The IOPS or throughput governor is queuing requests. The tier limit, not the storage, is the bottleneck. |
RBIO_RG_STORAGE, RBIO_RG_* | Data IO (Hyperscale) | Page server or log service throttling in Hyperscale; often accompanies a write burst that outran the log service. |
RESOURCE_SEMAPHORE | Memory grants | Queries waiting for workspace memory; usually a few over-estimating plans, not a memory shortage. Step 6. |
THREADPOOL | Workers | The worker cap for the service objective is exhausted; pairs with error 10928. Step 6. |
LCK_M_* | Concurrency | Blocking. Identical to on-premises diagnosis; usually a long transaction holding locks while waiting on one of the governed resources above. |
Query Store keeps the same information per query in sys.query_store_wait_stats, aggregated into categories such as CPU, Lock, Buffer IO and Log Rate Governor. That view survives failovers and scale operations, which makes it the better source when the slow window was last night rather than right now.
-- Azure SQL performance by wait category: which queries carried each category in the last 24 hours
SELECT
    ws.wait_category_desc,
    q.query_id,
    SUM(ws.total_query_wait_time_ms)                          AS total_wait_ms,
    SUM(ws.total_query_wait_time_ms) / NULLIF(SUM(rs.count_executions), 0) AS avg_wait_ms_per_exec,
    LEFT(qt.query_sql_text, 120)                              AS query_text
FROM sys.query_store_wait_stats AS ws
JOIN sys.query_store_plan AS p
  ON p.plan_id = ws.plan_id
JOIN sys.query_store_query AS q
  ON q.query_id = p.query_id
JOIN sys.query_store_query_text AS qt
  ON qt.query_text_id = q.query_text_id
JOIN sys.query_store_runtime_stats AS rs
  ON rs.plan_id = ws.plan_id
 AND rs.runtime_stats_interval_id = ws.runtime_stats_interval_id
JOIN sys.query_store_runtime_stats_interval AS i
  ON i.runtime_stats_interval_id = ws.runtime_stats_interval_id
WHERE i.start_time >= DATEADD(HOUR, -24, SYSUTCDATETIME())
GROUP BY ws.wait_category_desc, q.query_id, qt.query_sql_text
ORDER BY total_wait_ms DESC;
Step 3: Query Store is the Azure SQL performance source of truth
Query Store is on by default in Azure SQL Database and cannot be turned off in a way that survives, so on this platform it is always there when you need it. For Azure SQL performance regressions we ask it three questions in order: which queries consume the most of the constrained resource, which queries got slower than they were, and which of those have more than one plan.
-- Azure SQL performance top consumers, last 2 hours, ranked by the constrained resource
-- Swap avg_cpu_time for avg_logical_io_reads, avg_log_bytes_used or avg_query_max_used_memory
SELECT TOP (20)
    q.query_id,
    p.plan_id,
    SUM(rs.count_executions)                                     AS executions,
    SUM(rs.avg_cpu_time * rs.count_executions) / 1000.0          AS total_cpu_ms,
    SUM(rs.avg_duration * rs.count_executions) / 1000.0          AS total_duration_ms,
    SUM(rs.avg_logical_io_reads * rs.count_executions)           AS total_logical_reads,
    SUM(rs.avg_log_bytes_used * rs.count_executions) / 1048576.0 AS total_log_mb,
    LEFT(qt.query_sql_text, 200)                                 AS query_text
FROM sys.query_store_runtime_stats AS rs
JOIN sys.query_store_runtime_stats_interval AS i
  ON i.runtime_stats_interval_id = rs.runtime_stats_interval_id
JOIN sys.query_store_plan AS p
  ON p.plan_id = rs.plan_id
JOIN sys.query_store_query AS q
  ON q.query_id = p.query_id
JOIN sys.query_store_query_text AS qt
  ON qt.query_text_id = q.query_text_id
WHERE i.start_time >= DATEADD(HOUR, -2, SYSUTCDATETIME())
GROUP BY q.query_id, p.plan_id, qt.query_sql_text
ORDER BY total_cpu_ms DESC;
The regression query compares each query's recent average against its own history. We deliberately compare like with like: the same query_id, the same metric, a recent window against a baseline window, and a minimum execution count so a one-off report does not top the list.
-- Azure SQL performance regressions: average CPU per execution doubled versus the prior 7 days
WITH recent AS (
    SELECT p.query_id,
           SUM(rs.avg_cpu_time * rs.count_executions) / SUM(rs.count_executions) AS avg_cpu_us,
           SUM(rs.count_executions)                                              AS execs
    FROM sys.query_store_runtime_stats AS rs
    JOIN sys.query_store_runtime_stats_interval AS i
      ON i.runtime_stats_interval_id = rs.runtime_stats_interval_id
    JOIN sys.query_store_plan AS p
      ON p.plan_id = rs.plan_id
    WHERE i.start_time >= DATEADD(HOUR, -6, SYSUTCDATETIME())
    GROUP BY p.query_id
),
baseline AS (
    SELECT p.query_id,
           SUM(rs.avg_cpu_time * rs.count_executions) / SUM(rs.count_executions) AS avg_cpu_us,
           SUM(rs.count_executions)                                              AS execs
    FROM sys.query_store_runtime_stats AS rs
    JOIN sys.query_store_runtime_stats_interval AS i
      ON i.runtime_stats_interval_id = rs.runtime_stats_interval_id
    JOIN sys.query_store_plan AS p
      ON p.plan_id = rs.plan_id
    WHERE i.start_time >= DATEADD(DAY, -7, SYSUTCDATETIME())
      AND i.start_time <  DATEADD(HOUR, -6, SYSUTCDATETIME())
    GROUP BY p.query_id
)
SELECT
    r.query_id,
    b.avg_cpu_us / 1000.0 AS baseline_avg_cpu_ms,
    r.avg_cpu_us / 1000.0 AS recent_avg_cpu_ms,
    r.avg_cpu_us * 1.0 / NULLIF(b.avg_cpu_us, 0) AS regression_factor,
    r.execs               AS recent_execs,
    (SELECT COUNT(*) FROM sys.query_store_plan AS p2 WHERE p2.query_id = r.query_id) AS plan_count,
    LEFT(qt.query_sql_text, 160) AS query_text
FROM recent AS r
JOIN baseline AS b
  ON b.query_id = r.query_id
JOIN sys.query_store_query AS q
  ON q.query_id = r.query_id
JOIN sys.query_store_query_text AS qt
  ON qt.query_text_id = q.query_text_id
WHERE r.execs >= 50
  AND r.avg_cpu_us > 2 * b.avg_cpu_us
ORDER BY regression_factor DESC;
A plan_count above one on a regressed query is the Azure SQL performance parameter-sniffing signature, and Step 7 deals with it. A regression with a single plan and no change in executions usually means the data changed: a statistics refresh that moved the estimate, a table that crossed a size threshold, or an index that was dropped by automatic tuning. sys.query_store_plan.last_compile_start_time tells you when the current plan was compiled, which is often the moment the trouble started.
Step 4: Azure SQL performance and the IO path depend on the tier you bought
This is the part of Azure SQL performance work that has no on-premises analogue, and it is where most misdiagnosis happens. The three vCore service tiers store data in three different places, and a query that is IO-bound on one tier can be CPU-bound on another with no change to the plan.
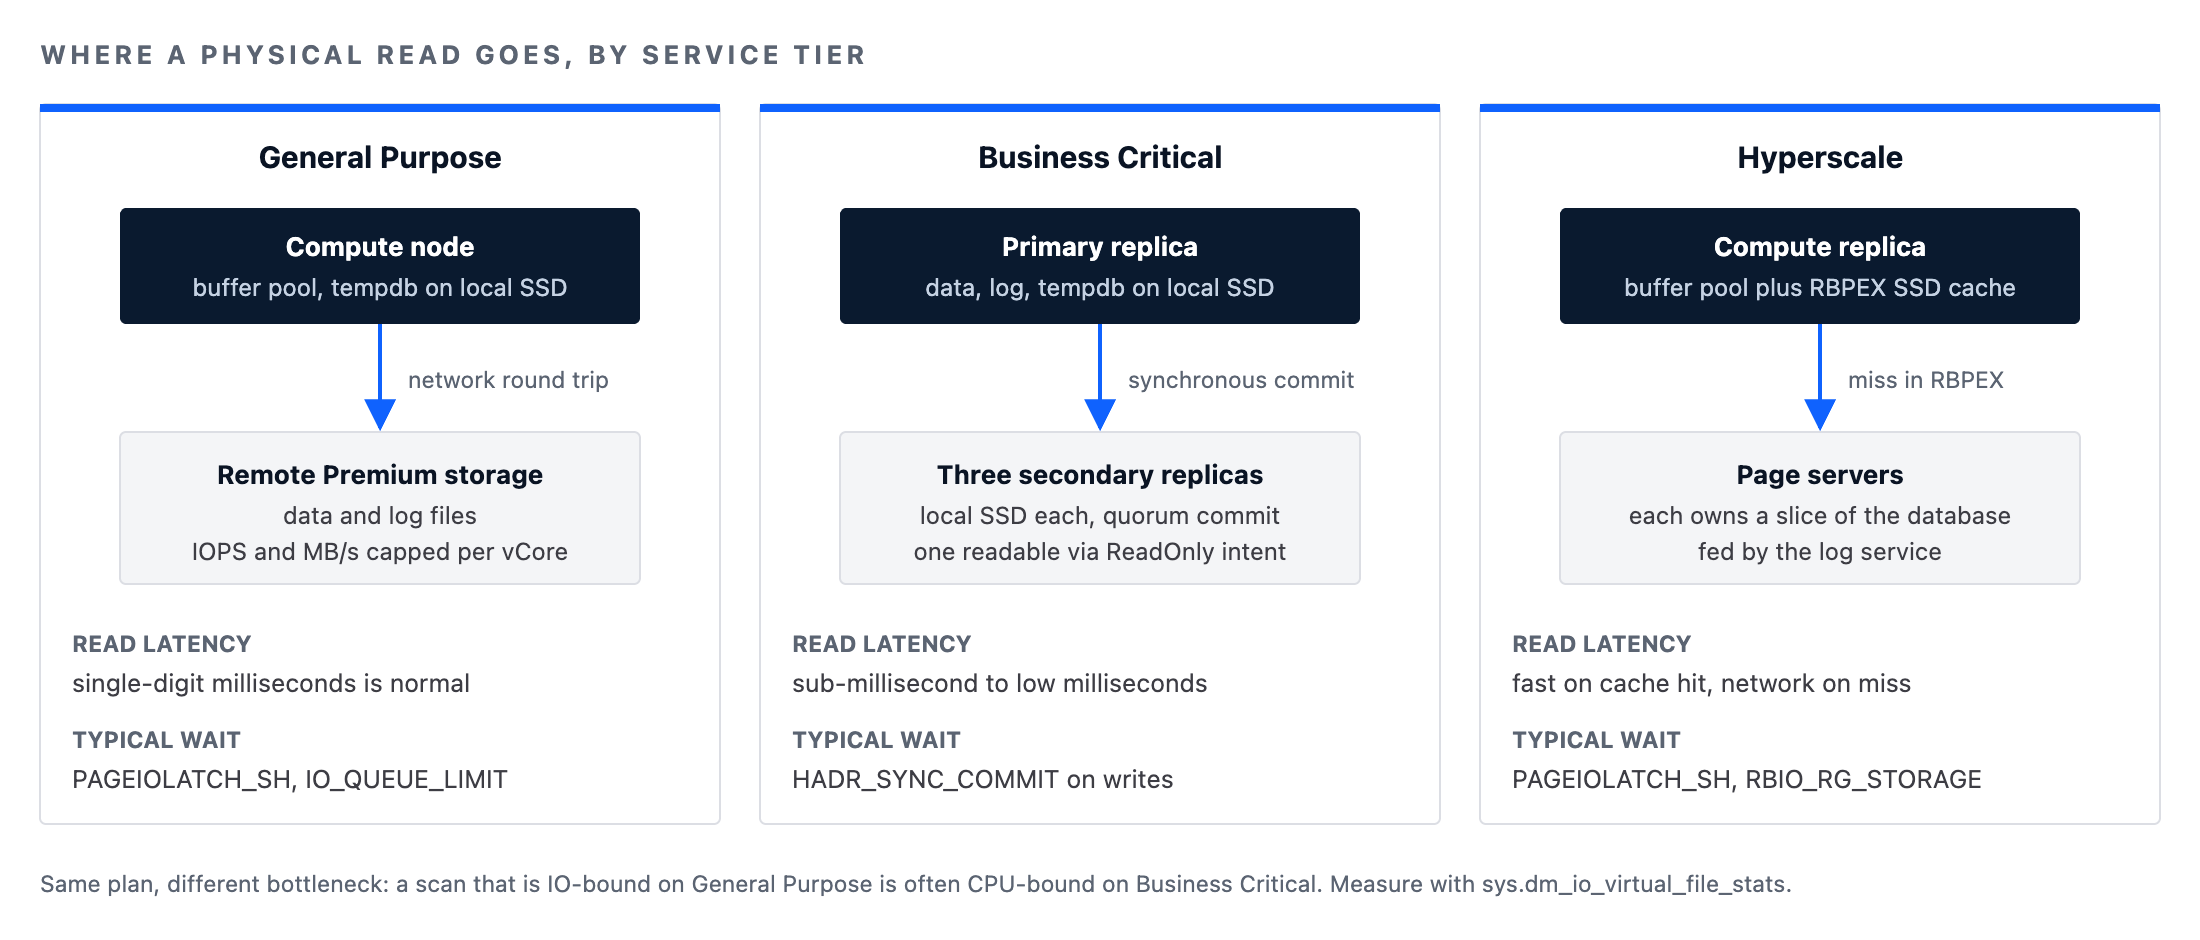
General Purpose keeps data and log files on remote Azure Premium storage. Every physical read is a network round trip with latency measured in single-digit milliseconds rather than the microseconds of a local NVMe drive, and IOPS and throughput are capped per vCore.
A workload with a poor buffer cache hit ratio, or a plan that scans a large table, spends its time in PAGEIOLATCH_SH waits that would be invisible on a local-SSD server. Business Critical keeps data on local SSD attached to each replica in an availability-group-style set of four nodes, so physical reads are fast, but the write path is a synchronous commit to a quorum of replicas, which is why HADR_SYNC_COMMIT appears in Business Critical wait profiles.
Hyperscale separates compute from storage entirely: the compute replica has a local resilient buffer pool extension (RBPEX) on SSD, and pages not in the buffer pool or RBPEX are fetched from page servers over the network.
The Azure SQL performance measurement that separates a storage problem from a plan problem is per-file latency from sys.dm_io_virtual_file_stats, again sampled as a delta.
-- Azure SQL performance IO check: per-file read and write latency; sample twice and compare the deltas
SELECT
    DB_NAME(vfs.database_id)                                    AS database_name,
    mf.type_desc,
    mf.physical_name,
    vfs.num_of_reads,
    vfs.io_stall_read_ms  * 1.0 / NULLIF(vfs.num_of_reads, 0)  AS avg_read_ms,
    vfs.num_of_writes,
    vfs.io_stall_write_ms * 1.0 / NULLIF(vfs.num_of_writes, 0) AS avg_write_ms,
    vfs.num_of_bytes_read  / 1048576                            AS mb_read,
    vfs.num_of_bytes_written / 1048576                          AS mb_written
FROM sys.dm_io_virtual_file_stats(DB_ID(), NULL) AS vfs
JOIN sys.database_files AS mf
  ON mf.file_id = vfs.file_id;
How we read it: on General Purpose, average read latency in the 5 to 10 millisecond range is the storage behaving as designed, and the Azure SQL performance fix is to read fewer pages, not to complain about the disk.
The lever is the plan: a covering index, a narrower predicate, a rewrite that avoids the scan. On Business Critical, read latency above 1 to 2 milliseconds is anomalous and points at the IO governor (IO_QUEUE_LIMIT) rather than the SSD. On Hyperscale, a high physical read count with acceptable latency means the working set fits RBPEX; high latency means it does not, and the practical response is either a larger compute size (RBPEX scales with the compute) or a smaller working set.
The buffer pool itself tells you whether the working set fits. sys.dm_os_buffer_descriptors works in Azure SQL Database and is the quickest way to see which tables are consuming memory that the hot path needs.
-- Azure SQL performance buffer pool check: is memory holding what the workload actually reads?
SELECT TOP (20)
    OBJECT_SCHEMA_NAME(p.object_id) + N'.' + OBJECT_NAME(p.object_id) AS table_name,
    i.name                                                             AS index_name,
    COUNT(*) * 8 / 1024                                                AS cached_mb,
    SUM(CASE WHEN bd.is_modified = 1 THEN 1 ELSE 0 END) * 8 / 1024     AS dirty_mb
FROM sys.dm_os_buffer_descriptors AS bd
JOIN sys.allocation_units AS au
  ON au.allocation_unit_id = bd.allocation_unit_id
JOIN sys.partitions AS p
  ON p.hobt_id = au.container_id
JOIN sys.indexes AS i
  ON i.object_id = p.object_id
 AND i.index_id  = p.index_id
WHERE bd.database_id = DB_ID()
GROUP BY p.object_id, i.name
ORDER BY cached_mb DESC;
Step 5: log rate governance, the Azure SQL performance ceiling nobody expects
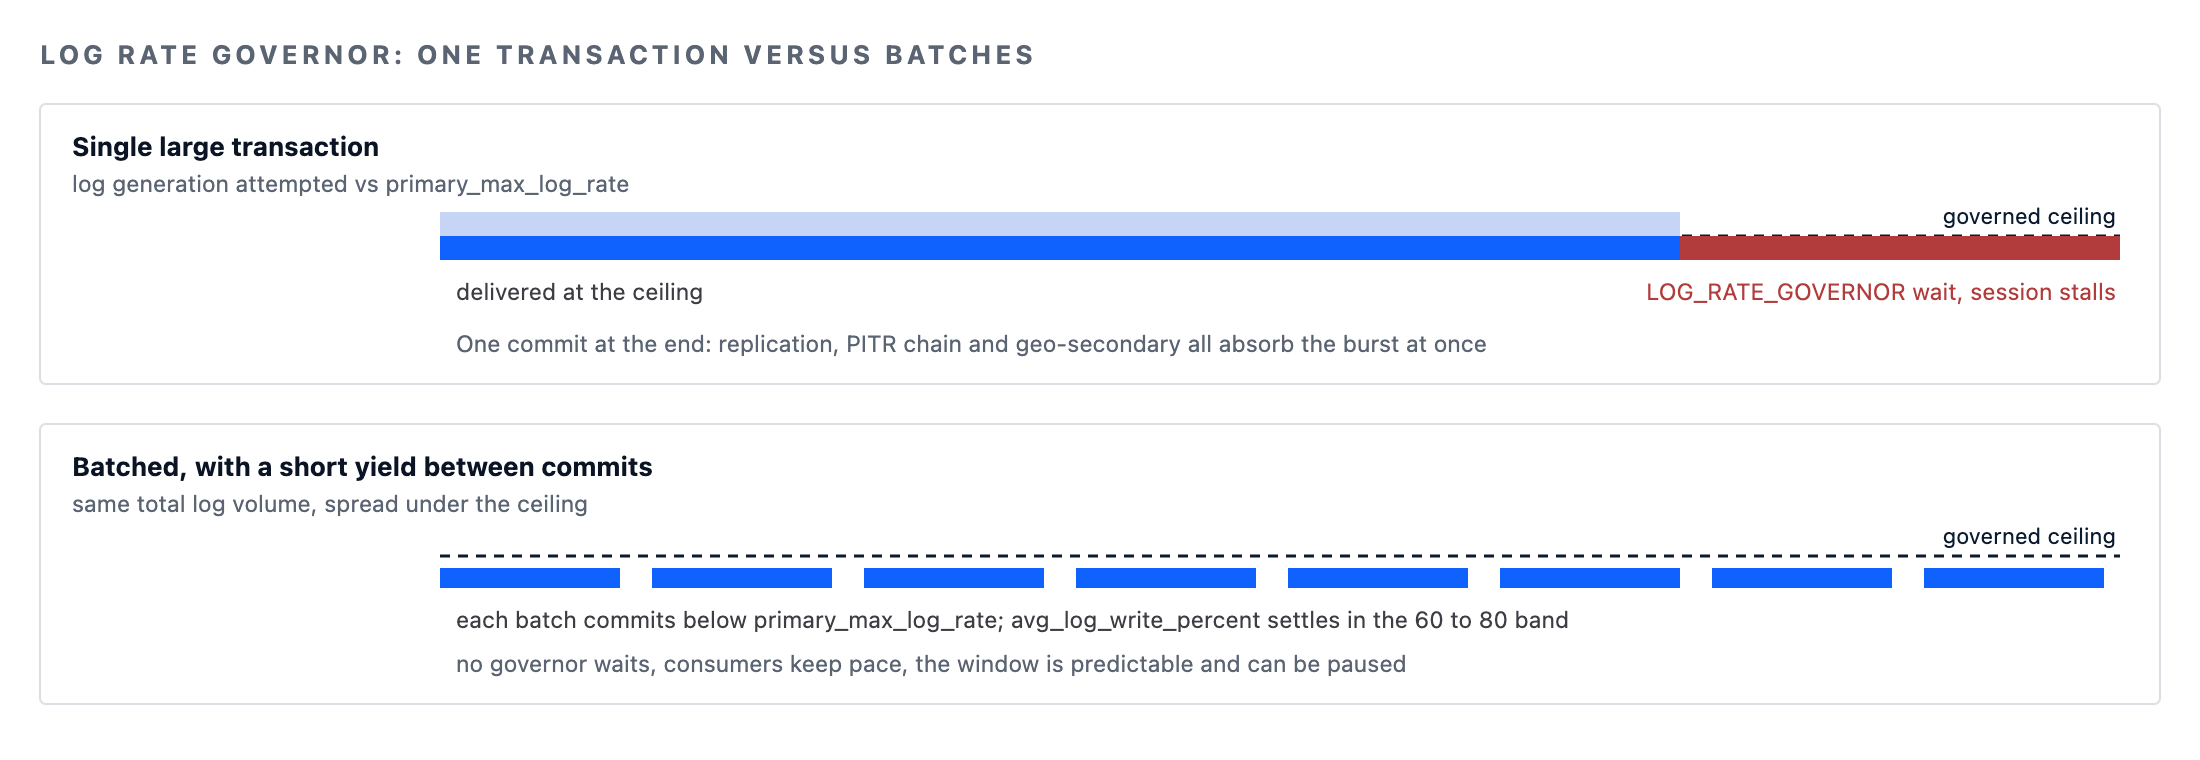
The log rate governor is the Azure SQL performance ceiling that catches the most teams by surprise, because nothing on premises behaves like it. Azure caps the rate at which a database can generate transaction log, per service objective, so that geo-replication, point-in-time backup and Hyperscale's log service can keep pace. When a bulk load, an index rebuild or a large UPDATE produces log faster than primary_max_log_rate, the session is delayed and the wait is recorded as LOG_RATE_GOVERNOR. The query is not slow; it is being metered.
-- Azure SQL performance log governor check: is it active right now, and who is generating the log?
SELECT
    r.session_id,
    r.status,
    r.wait_type,
    r.wait_time,
    r.cpu_time,
    r.total_elapsed_time,
    t.transaction_id,
    dt.database_transaction_log_bytes_used / 1048576 AS txn_log_mb,
    SUBSTRING(st.text, (r.statement_start_offset / 2) + 1,
        ((CASE r.statement_end_offset WHEN -1 THEN DATALENGTH(st.text)
          ELSE r.statement_end_offset END - r.statement_start_offset) / 2) + 1) AS statement_text
FROM sys.dm_exec_requests AS r
CROSS APPLY sys.dm_exec_sql_text(r.sql_handle) AS st
LEFT JOIN sys.dm_tran_session_transactions AS t
  ON t.session_id = r.session_id
LEFT JOIN sys.dm_tran_database_transactions AS dt
  ON dt.transaction_id = t.transaction_id
 AND dt.database_id   = DB_ID()
WHERE r.session_id <> @@SPID
  AND (r.wait_type LIKE N'%LOG_RATE_GOVERNOR%'
       OR r.wait_type LIKE N'HADR_THROTTLE_LOG_RATE%'
       OR dt.database_transaction_log_bytes_used > 268435456)
ORDER BY dt.database_transaction_log_bytes_used DESC;
Three fixes, in the order we apply them. First, generate less log: batch large modifications into chunks of tens of thousands of rows so each transaction commits and the governor gets to smooth the rate rather than stall a single giant transaction. Use WITH (ONLINE = ON, RESUMABLE = ON) for index rebuilds so they can be paused during peak hours; consider whether a heavily updated staging table should be a temp table, whose log traffic in tempdb is considerably cheaper.
Second, use the tier's headroom for Azure SQL performance: the governed log rate scales with vCores on General Purpose and Business Critical, and Hyperscale carries the highest log throughput ceiling, so a write-dominated workload sometimes belongs on Hyperscale for that reason alone. Third, and only after the first two, scale the service objective for the duration of the batch window and scale back, which is scriptable and often cheaper than a permanent tier change.
-- Azure SQL performance batching pattern: keeps each transaction under the log governor's radar
DECLARE @batch_size INT = 20000;
DECLARE @rows INT = 1;

WHILE @rows > 0
BEGIN
    DELETE TOP (@batch_size)
    FROM dbo.event_archive
    WHERE event_time < DATEADD(DAY, -90, SYSUTCDATETIME());

    SET @rows = @@ROWCOUNT;

    -- Yield so replication and backup log consumers catch up; tune to the observed governor behaviour
    WAITFOR DELAY '00:00:00.200';
END;
Watch avg_log_write_percent in sys.dm_db_resource_stats while the batch runs. If it settles in the 60 to 80 range with no LOG_RATE_GOVERNOR waits accumulating, the batch size is right for the tier. Test on a non-production copy before applying to production, and confirm the point-in-time restore chain is healthy before any large modification.
Step 6: Azure SQL performance under memory grants, tempdb and the worker cap
RESOURCE_SEMAPHORE waits on Azure SQL Database almost always trace back to a small number of plans requesting far more workspace memory than they use, and the memory ceiling (max_db_memory) being lower than the tier's vCore count would suggest. The query below finds the offenders by comparing granted memory to used memory from Query Store.
-- Plans whose memory grant is out of proportion to what they use (Azure SQL performance memory audit)
SELECT TOP (20)
    q.query_id,
    p.plan_id,
    SUM(rs.count_executions)                                  AS executions,
    MAX(rs.max_query_max_used_memory) * 8 / 1024              AS max_used_mb,
    AVG(rs.avg_query_max_used_memory) * 8 / 1024              AS avg_used_mb,
    LEFT(qt.query_sql_text, 160)                              AS query_text
FROM sys.query_store_runtime_stats AS rs
JOIN sys.query_store_plan AS p
  ON p.plan_id = rs.plan_id
JOIN sys.query_store_query AS q
  ON q.query_id = p.query_id
JOIN sys.query_store_query_text AS qt
  ON qt.query_text_id = q.query_text_id
GROUP BY q.query_id, p.plan_id, qt.query_sql_text
ORDER BY max_used_mb DESC;

-- Azure SQL performance grant queue: who is waiting for a grant and who holds one
SELECT
    session_id,
    request_time,
    grant_time,
    requested_memory_kb / 1024 AS requested_mb,
    granted_memory_kb   / 1024 AS granted_mb,
    used_memory_kb      / 1024 AS used_mb,
    ideal_memory_kb     / 1024 AS ideal_mb,
    dop,
    queue_id,
    wait_time_ms
FROM sys.dm_exec_query_memory_grants
ORDER BY wait_time_ms DESC;
Memory grant feedback (compatibility level 140 and later, persisted in Query Store since 150) corrects most over-estimates automatically after a few executions. When a plan keeps oscillating, a MAX_GRANT_PERCENT hint on the specific statement is the surgical fix; capping the database-scoped MAXDOP below the Azure default of 8 reduces the per-query grant for parallel plans and is worth testing on OLTP-shaped workloads.
Worker exhaustion is the Azure SQL performance failure that produces error 10928 ("the request limit for the database is N and has been reached") and THREADPOOL waits. Two causes dominate: a blocking chain that holds hundreds of sessions in a runnable-but-waiting state, and application connection pools sized for a bare-metal server. The first is diagnosed with sys.dm_exec_requests and blocking_session_id in the usual way; the second is fixed at the application, not the database.
-- Azure SQL performance worker triage: blocking chain with the head blocker's statement
SELECT
    r.session_id,
    r.blocking_session_id,
    r.wait_type,
    r.wait_time,
    r.status,
    s.host_name,
    s.program_name,
    LEFT(st.text, 200) AS statement_text
FROM sys.dm_exec_requests AS r
JOIN sys.dm_exec_sessions AS s
  ON s.session_id = r.session_id
OUTER APPLY sys.dm_exec_sql_text(r.sql_handle) AS st
WHERE r.blocking_session_id <> 0
   OR r.session_id IN (SELECT blocking_session_id FROM sys.dm_exec_requests WHERE blocking_session_id <> 0)
ORDER BY r.blocking_session_id, r.wait_time DESC;
tempdb lives on local SSD in every tier, so it is fast, but its size is capped per service objective and it is shared by every database in an elastic pool. Version store growth from long-running transactions under read committed snapshot isolation, which is on by default in Azure SQL Database, is the usual way it fills.
-- Azure SQL performance tempdb check: consumption by category; version store growth points at a long-open transaction
SELECT
    SUM(user_object_reserved_page_count)     * 8 / 1024 AS user_objects_mb,
    SUM(internal_object_reserved_page_count) * 8 / 1024 AS internal_objects_mb,
    SUM(version_store_reserved_page_count)   * 8 / 1024 AS version_store_mb,
    SUM(unallocated_extent_page_count)       * 8 / 1024 AS free_mb
FROM tempdb.sys.dm_db_file_space_usage;

SELECT TOP (5)
    s.session_id,
    s.login_name,
    s.program_name,
    t.transaction_begin_time,
    DATEDIFF(SECOND, t.transaction_begin_time, SYSUTCDATETIME()) AS open_seconds
FROM sys.dm_tran_active_transactions AS t
JOIN sys.dm_tran_session_transactions AS st
  ON st.transaction_id = t.transaction_id
JOIN sys.dm_exec_sessions AS s
  ON s.session_id = st.session_id
ORDER BY t.transaction_begin_time ASC;
Step 7: plan quality, parameter sniffing and automatic tuning for Azure SQL performance
Once the envelope is understood, the remaining Azure SQL performance work is plan work, and the platform gives you more tooling than on-premises editions do. Parameter-sensitive plan optimization (compatibility level 160) lets the optimizer keep multiple plans per query for parameters with skewed cardinality; cardinality estimation feedback and degree-of-parallelism feedback adjust the plan attributes that most often go wrong after a data change. Check the database's compatibility level first, because a database migrated from an older server keeps its old level and gets none of this.
-- Azure SQL performance plan settings: compatibility level and database-scoped configuration
SELECT name, compatibility_level, is_read_committed_snapshot_on, is_query_store_on
FROM sys.databases
WHERE name = DB_NAME();

SELECT name, value, value_for_secondary
FROM sys.database_scoped_configurations
WHERE name IN (N'MAXDOP', N'LEGACY_CARDINALITY_ESTIMATION', N'PARAMETER_SNIFFING',
               N'QUERY_OPTIMIZER_HOTFIXES', N'ROW_MODE_MEMORY_GRANT_FEEDBACK',
               N'BATCH_MODE_ON_ROWSTORE', N'CE_FEEDBACK', N'DOP_FEEDBACK',
               N'PARAMETER_SENSITIVE_PLAN_OPTIMIZATION', N'OPTIMIZED_PLAN_FORCING');
Automatic tuning is the Azure SQL feature we recommend enabling on every production database, with one qualification. FORCE_LAST_GOOD_PLAN watches Query Store for plan regressions and forces the previous plan when a new one is measurably worse, then verifies its own decision and reverts if the forced plan stops helping. It is safe and we leave it on. CREATE_INDEX and DROP_INDEX are more opinionated: they will create indexes that help the workload Query Store observed and drop indexes that appear unused, and "unused" is measured from the last restart, which on this platform can be yesterday. We run those two in recommendation-only mode and act on sys.dm_db_tuning_recommendations ourselves.
-- Azure SQL performance automatic tuning: plan-regression correction on, index changes as recommendations
ALTER DATABASE CURRENT
SET AUTOMATIC_TUNING (FORCE_LAST_GOOD_PLAN = ON, CREATE_INDEX = OFF, DROP_INDEX = OFF);

-- Azure SQL performance recommendations: what automatic tuning wants to do and what it has already done
SELECT
    reason,
    score,
    state,
    JSON_VALUE(state, '$.currentValue')                       AS current_state,
    JSON_VALUE(details, '$.implementationDetails.script')     AS implementation_script,
    JSON_VALUE(details, '$.planForceDetails.queryId')         AS query_id,
    JSON_VALUE(details, '$.planForceDetails.regressedPlanId') AS regressed_plan_id,
    JSON_VALUE(details, '$.planForceDetails.recommendedPlanId') AS recommended_plan_id,
    last_refresh,
    execute_action_start_time
FROM sys.dm_db_tuning_recommendations
ORDER BY last_refresh DESC;
For a query with several plans in Query Store, the manual Azure SQL performance version of the same decision is to compare the plans' runtime statistics and force the stable one, with the caveat that a forced plan is a decision you own until you unforce it, and the schema change that invalidates it will make the query fall back to compilation silently. Query Store records that as force_failure_count and last_force_failure_reason_desc on sys.query_store_plan, and we alert on both.
-- Azure SQL performance plan comparison for one regressed query, then force the stable one
DECLARE @query_id BIGINT = ${QS_QUERY_ID};

SELECT
    p.plan_id,
    p.is_forced_plan,
    p.force_failure_count,
    p.last_force_failure_reason_desc,
    p.last_compile_start_time,
    SUM(rs.count_executions)                                             AS executions,
    SUM(rs.avg_duration * rs.count_executions) / SUM(rs.count_executions) / 1000.0 AS avg_duration_ms,
    SUM(rs.avg_logical_io_reads * rs.count_executions) / SUM(rs.count_executions)  AS avg_logical_reads
FROM sys.query_store_plan AS p
JOIN sys.query_store_runtime_stats AS rs
  ON rs.plan_id = p.plan_id
WHERE p.query_id = @query_id
GROUP BY p.plan_id, p.is_forced_plan, p.force_failure_count,
         p.last_force_failure_reason_desc, p.last_compile_start_time
ORDER BY avg_duration_ms ASC;

-- Only after reviewing the comparison above; confirm the plan_id before running
-- EXEC sys.sp_query_store_force_plan @query_id = @query_id, @plan_id = ${QS_STABLE_PLAN_ID};
Serverless and elastic pools add two more Azure SQL performance variables
Serverless compute changes the meaning of "slow" for Azure SQL performance in two ways. After an auto-pause the first connection pays the resume cost, typically tens of seconds to a minute, and the buffer pool comes back empty, so the first few minutes of every working day look like an IO problem on a General Purpose tier. And serverless reclaims cache memory when the database is idle, so avg_memory_usage_percent fluctuates in ways that are normal for the tier and alarming if you treat the number like a provisioned database. If the workload's latency budget cannot absorb a cold start, the answer is a longer auto-pause delay or provisioned compute, not tuning.
Elastic pools add the noisy neighbour to the Azure SQL performance picture. A database can be within its own limits and still wait on POOL_LOG_RATE_GOVERNOR or pool-level CPU because another database in the pool is consuming the shared allocation. sys.elastic_pool_resource_stats in master shows the pool's aggregate consumption, and sys.resource_stats filtered by pool membership shows who is using it.
-- Azure SQL performance in elastic pools: pool-level saturation and per-database share, last 2 hours
SELECT TOP (48)
    end_time,
    avg_cpu_percent,
    avg_data_io_percent,
    avg_log_write_percent,
    max_worker_percent,
    max_session_percent,
    avg_allocated_storage_percent
FROM sys.elastic_pool_resource_stats
WHERE elastic_pool_name = N'${AZSQL_POOL}'
ORDER BY end_time DESC;

SELECT
    database_name,
    AVG(avg_cpu_percent)       AS avg_cpu_percent,
    AVG(avg_log_write_percent) AS avg_log_write_percent,
    MAX(max_worker_percent)    AS max_worker_percent
FROM sys.resource_stats
WHERE start_time >= DATEADD(HOUR, -2, SYSUTCDATETIME())
  AND elastic_pool_name = N'${AZSQL_POOL}'
GROUP BY database_name
ORDER BY avg_cpu_percent DESC;
The connection layer is part of the Azure SQL performance surface
Two connection settings show up in Azure SQL performance tickets often enough to check every time. The connection policy defaults to Proxy for connections from outside Azure and Redirect from inside; Proxy routes every packet through the gateway and adds measurable latency to chatty workloads, so an application running in Azure should be confirmed to use Redirect, with the outbound port range 11000 to 11999 open.
Transient errors (40613 database unavailable, 40501 service busy, 49918 and 49919 request limits, 10928 and 10929 resource limits) are a normal part of operating on a platform that performs maintenance failovers; an application without exponential-backoff retry on that error class will report an outage where a well-behaved one reports a 30-second blip.
-- Azure SQL performance connection audit: sessions via Proxy versus Redirect, and from which hosts
SELECT
    s.host_name,
    s.program_name,
    c.net_transport,
    c.protocol_type,
    c.client_net_address,
    COUNT(*) AS sessions
FROM sys.dm_exec_sessions AS s
JOIN sys.dm_exec_connections AS c
  ON c.session_id = s.session_id
WHERE s.is_user_process = 1
GROUP BY s.host_name, s.program_name, c.net_transport, c.protocol_type, c.client_net_address
ORDER BY sessions DESC;
Prevention: Azure SQL performance alerts that fire before the ticket does
Every Azure SQL performance investigation is faster when the baseline already exists. We put four things in place on every Azure SQL database we operate. Azure Monitor alerts on the platform metrics that mirror sys.dm_db_resource_stats: cpu_percent, physical_data_read_percent, log_write_percent, workers_percent and sessions_percent, each with a warning at 70 sustained for 10 minutes and a critical at 90. Query Store configured for the retention the investigation actually needs rather than the default, with QUERY_CAPTURE_MODE = AUTO so ad-hoc noise does not push out the queries that matter.
-- Azure SQL performance baseline: Query Store settings we deploy (30-day window, hourly intervals, recurring queries only)
ALTER DATABASE CURRENT
SET QUERY_STORE = ON (
    OPERATION_MODE            = READ_WRITE,
    CLEANUP_POLICY            = (STALE_QUERY_THRESHOLD_DAYS = 30),
    DATA_FLUSH_INTERVAL_SECONDS = 900,
    INTERVAL_LENGTH_MINUTES   = 60,
    MAX_STORAGE_SIZE_MB       = 1024,
    QUERY_CAPTURE_MODE        = AUTO,
    SIZE_BASED_CLEANUP_MODE   = AUTO,
    WAIT_STATS_CAPTURE_MODE   = ON
);
Third, a scheduled capture of the wait delta and the Azure SQL performance envelope into a monitoring database or a Log Analytics workspace through diagnostic settings, so the Step 1 and Step 2 questions can be answered for last Tuesday. Fourth, a weekly review of sys.dm_db_tuning_recommendations, sys.dm_db_missing_index_details and forced-plan failures, because the platform generates advice continuously and nobody reads it unless it is on a calendar.
Where this Azure SQL performance method needs adjusting
Azure SQL Managed Instance is governed at the instance rather than the database, so sys.dm_os_wait_stats is the right wait view there, the log rate governor appears as INSTANCE_LOG_RATE_GOVERNOR, and the resource DMV is sys.server_resource_stats. The DTU purchasing model blends CPU, IO and log into one percentage, which hides which resource is the ceiling; the DMVs still expose the individual columns, and that is the main reason we prefer the vCore model for any database that will ever need to be troubleshot.
Feature availability by compatibility level, particularly the SQL Server 2025-era features behind level 170, changes with the platform; verify against the Microsoft documentation for your region before relying on a specific optimizer behaviour. And every configuration change in this post, from batching to automatic tuning to forced plans, should be tested on a non-production copy first, with a verified point-in-time restore chain in place before production is touched.
Azure SQL performance troubleshooting: frequently asked questions
Which DMV should be checked first for an Azure SQL performance problem?
sys.dm_db_resource_stats. It shows CPU, data IO, log write, memory, worker and session consumption as a percentage of the service objective's limits at 15-second granularity for the last hour. Any column near 100 identifies the governed Azure SQL performance resource that is the bottleneck and decides which of the seven steps to follow.
Why is a query slower on Azure SQL Database than on the on-premises server it came from?
Usually one of three reasons: the General Purpose tier's remote storage has higher read latency than local SSD, so plans that scan are penalised; the transaction log rate is governed, so write-heavy statements are metered; or the database kept an old compatibility level after migration and is missing parameter-sensitive plan optimization and feedback features. The DMVs in Steps 1, 4 and 7 distinguish the three.
Should automatic tuning be enabled on Azure SQL Database?
FORCE_LAST_GOOD_PLAN, yes, on every production database; it corrects plan regressions and verifies its own decisions. CREATE_INDEX and DROP_INDEX are better left as recommendations that a person reviews, because the "unused index" signal resets on every failover or scale operation.
When is scaling up the right fix for Azure SQL performance?
When the envelope is saturated by a workload that is already efficient. If sys.dm_db_resource_stats shows a ceiling and Query Store shows no regressed or wasteful queries consuming it, more vCores, a different tier or Hyperscale is the correct answer. Scaling before that check buys the same problem at a higher price.
Working with MinervaDB on Azure SQL performance
MinervaDB provides SQL Server and Azure SQL consulting, 24×7 consultative support and remote DBA services, including performance audits that apply the method above against your Query Store history and resource telemetry, tier and purchasing-model right-sizing with our cloud database FinOps practice, and managed operations with the alerting baseline described in the prevention section already in place. Talk to a principal engineer through our contact page. Further reading: Microsoft's vCore resource limits for single databases and the Azure SQL DMV monitoring reference.
Running this in production?
MinervaDB provides SQL Server Support and SQL Server Consulting with 24x7 coverage and a 15-minute S1 response. Talk to an engineer.