A retail data strategy is not a tooling decision. It is a set of commitments about four facts that marketing and sales operations both depend on and rarely agree about: who the customer is, what the product is, what an order was actually worth after discounts and returns, and what happened in the store or on the site before the order. Most retailers we work with have three or four versions of each of those facts living in a POS system, an e-commerce platform, an ERP, a CRM and a handful of advertising accounts.
Marketing measures campaigns against one version, sales operations plans inventory against another, and finance closes the month on a third.
This post lays out the retail data strategy we build for mid-market and enterprise retailers: the canonical data model, the platform architecture that serves marketing analytics and sales operations analytics from the same governed tables, the identity, attribution, customer-value, sell-through and promotion-lift work that sits on top, and the operating model that keeps the definitions stable. Code is included where the logic is the point. Figures are illustrative unless a measurement source is named.
A retail data strategy starts with the model, not the platform
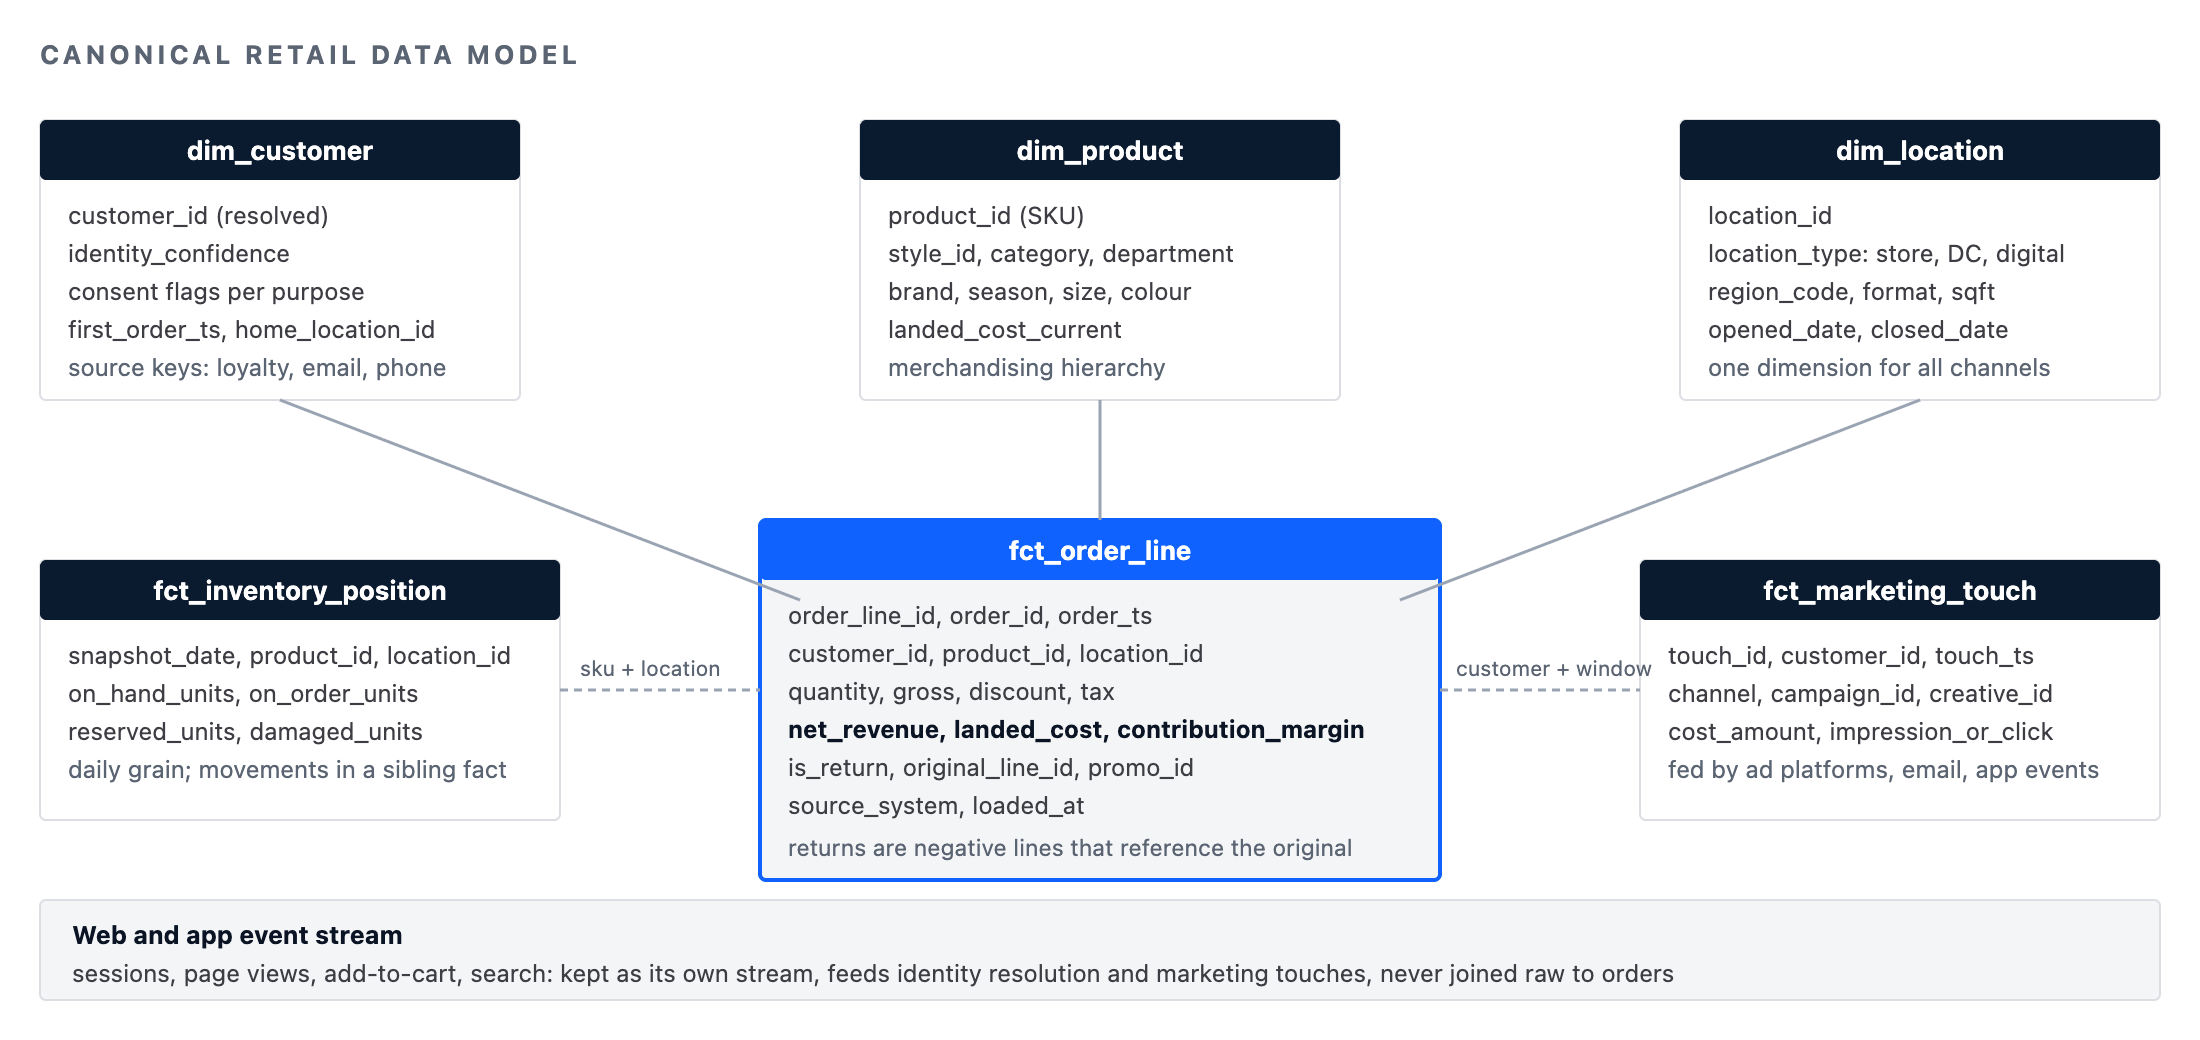
Every retail data strategy that survives contact with a quarter-end has a canonical model at its centre, and it is smaller than people expect. Six entities carry almost all of the analytical weight: a resolved customer, a product with its merchandising hierarchy, a location that covers stores, warehouses and digital channels alike, an order with its order lines carrying gross, discount, tax, cost and return status, an inventory position by SKU and location and day, and a marketing touch that records a channel, a campaign, a cost and a timestamp against an identity.
Web and app events feed the customer and touch entities but are kept in their own stream because their volume and shape are different.
The single most valuable decision in the model is that order_line carries net revenue, landed cost and contribution margin at the line level, with returns applied as negative lines that reference the original. Marketing wants revenue per campaign; sales operations wants margin per SKU per store; finance wants both to reconcile to the ledger. One line-level fact table with those columns is the only way all three read the same number.
-- Retail data strategy core fact: one row per order line, returns as negative lines
CREATE TABLE fct_order_line (
    order_line_id        BIGINT        NOT NULL,
    order_id             BIGINT        NOT NULL,
    order_ts             TIMESTAMP     NOT NULL,
    customer_id          BIGINT,                  -- resolved identity, NULL for anonymous
    product_id           BIGINT        NOT NULL,  -- SKU level
    location_id          INT           NOT NULL,  -- store, warehouse or digital channel
    channel_code         VARCHAR(16)   NOT NULL,  -- store, web, app, marketplace
    quantity             INT           NOT NULL,
    gross_amount         NUMERIC(14,2) NOT NULL,
    discount_amount      NUMERIC(14,2) NOT NULL DEFAULT 0,
    tax_amount           NUMERIC(14,2) NOT NULL DEFAULT 0,
    net_revenue          NUMERIC(14,2) NOT NULL,  -- gross - discount, ex tax
    landed_cost          NUMERIC(14,2) NOT NULL,
    contribution_margin  NUMERIC(14,2) NOT NULL,  -- net_revenue - landed_cost - fulfilment_cost
    fulfilment_cost      NUMERIC(14,2) NOT NULL DEFAULT 0,
    is_return            BOOLEAN       NOT NULL DEFAULT FALSE,
    original_line_id     BIGINT,                  -- populated on return lines
    promo_id             BIGINT,
    source_system        VARCHAR(32)   NOT NULL,
    loaded_at            TIMESTAMP     NOT NULL,
    CONSTRAINT pk_fct_order_line PRIMARY KEY (order_line_id),
    CONSTRAINT ck_fct_order_line_return
        CHECK (is_return = FALSE OR original_line_id IS NOT NULL)
);
The source_system and loaded_at columns are not optional. When a marketing number and a finance number disagree, the first question is which system each came from and when, and a fact table that cannot answer it is a fact table nobody trusts.
The retail data strategy platform: one governed core, three serving speeds
The architecture that carries a retail data strategy has to serve three consumers with different latency budgets from the same definitions. Finance and the merchandising planners need month-end and week-end numbers that reconcile to the penny; a warehouse such as BigQuery, Snowflake or Redshift is the right place for that. Store operations, e-commerce trading and the marketing team running a promotion need intraday sales, stock positions and campaign spend refreshed in minutes; that is a real-time analytical store, and on our engagements it is usually ClickHouse.
The operational applications, the loyalty programme, the order management system and the customer service tools, need row-level lookups in milliseconds and stay on PostgreSQL or the platform's own database.
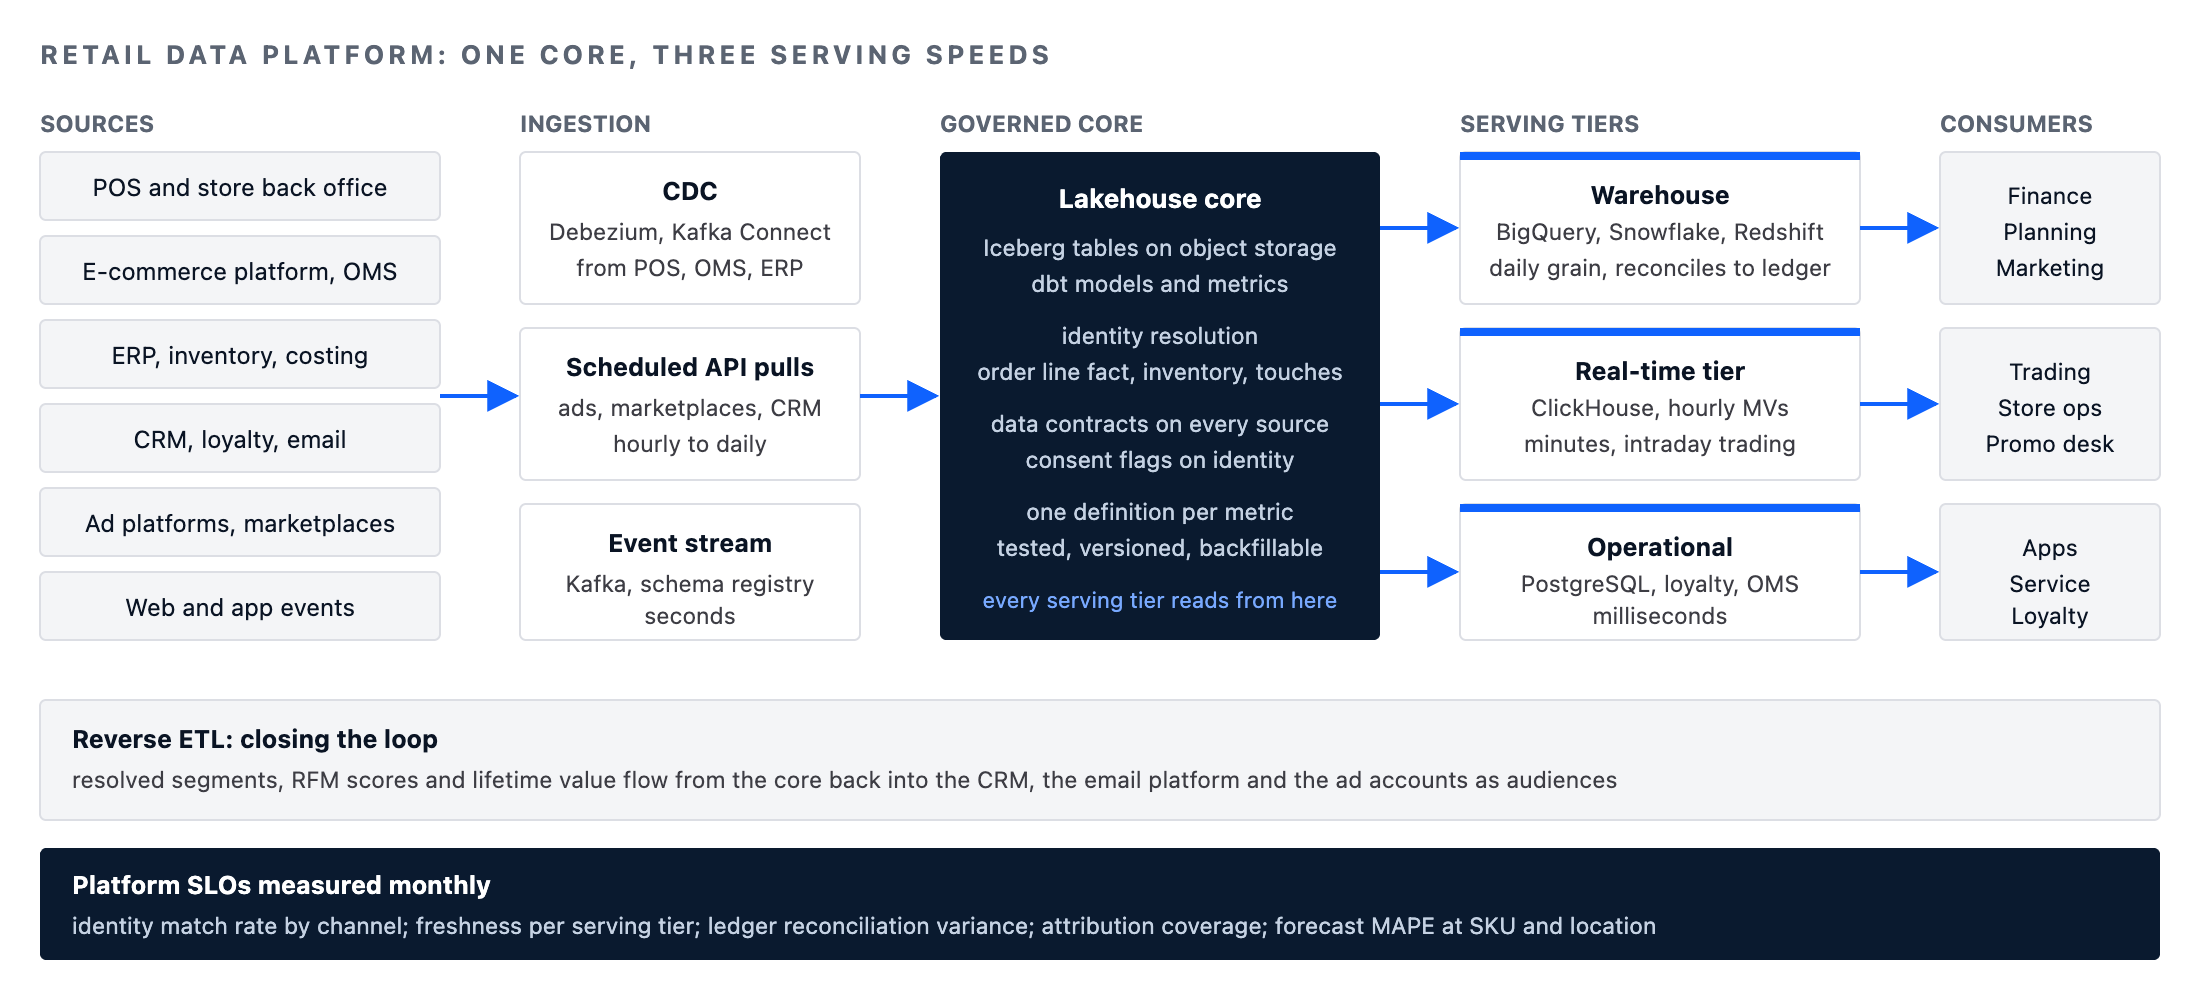
The core between the sources and the serving layer is where the retail data strategy either holds or fails. Sources arrive through change data capture from the transactional databases (the POS back-office database, the ERP, the order management system), through event streams from the web and app (Kafka or a managed equivalent), and through scheduled API pulls from the advertising platforms and marketplaces that do not offer anything better.
All of it lands in an open table format on object storage, is transformed with versioned SQL (dbt in most of our estates), and is published into the serving tiers from the same models. Reverse ETL closes the loop by pushing resolved segments and customer value scores back into the CRM, the email platform and the advertising accounts.
Two retail data strategy design rules matter more than the tool choices. First, every serving tier reads from the same transformed models, never from the raw sources, so the intraday dashboard and the month-end report disagree only by freshness, never by definition. Second, the real-time tier is fed by the same event stream that feeds the core, not by a separate integration, so a number that appears on the trading floor at 11:00 is the same number that appears in the warehouse at midnight.
Identity resolution is the retail data strategy foundation for marketing analytics
No marketing analytics is better than the identity it is built on. A retail data strategy has to state how a loyalty card swipe in a store, a web session with a cookie, an app login, an email click and an order under a slightly different spelling of the same name become one customer. We resolve deterministically first (loyalty ID, verified email, verified phone, hashed payment token where the acquirer permits it), and only then apply probabilistic matching on name, address and device signals with a confidence score that is stored, not hidden.
The deterministic step is a connected-components problem. Each strong identifier is an edge between two records; every record reachable through a chain of strong identifiers belongs to the same customer. A recursive CTE handles it at retail scale in a warehouse, and the result is a mapping from every raw identity to one resolved customer_id.
-- Retail data strategy identity graph: deterministic connected components over strong identifiers
-- identity_edge(record_a, record_b, identifier_type) lists pairs that share a loyalty_id, verified email or verified phone
WITH RECURSIVE component AS (
    SELECT record_id, record_id AS root
    FROM   identity_record
    UNION ALL
    SELECT e.record_b, c.root
    FROM   component AS c
    JOIN   identity_edge AS e
      ON   e.record_a = c.record_id
    WHERE  e.record_b <> c.root
),
resolved AS (
    SELECT record_id, MIN(root) AS customer_root
    FROM   component
    GROUP  BY record_id
)
SELECT
    r.record_id,
    DENSE_RANK() OVER (ORDER BY r.customer_root) AS customer_id,
    ir.source_system,
    ir.source_key
FROM resolved AS r
JOIN identity_record AS ir
  ON ir.record_id = r.record_id;
Two operational notes for the retail data strategy identity layer. Recursive CTEs need a cycle guard on engines that do not detect cycles; add the visited path or a depth limit before running this on production volumes, and test on a copy first. And the match rate is a metric of the retail data strategy itself: we report the share of order lines with a resolved customer_id by channel every week, because a marketing attribution number computed over 60 percent resolved orders means something different from one computed over 95 percent.
Consent travels with identity in a retail data strategy. Under GDPR and India's DPDP Act the purpose a record was collected for constrains what it can be used for, so the resolved customer carries consent flags per purpose (transactional, marketing, profiling) and every downstream model filters on them. Building consent into the identity table rather than into each dashboard is the difference between compliance that holds and compliance that depends on every analyst remembering.
Attribution in a retail data strategy: choose the model, then test it against incrementality
Attribution is the marketing analytics question a retail data strategy gets asked first and answers worst. Last-touch attribution is simple and wrong in a specific way: it rewards whichever channel is closest to the order, usually branded search and email, and starves the channels that create demand. Multi-touch models distribute credit across the touches in a lookback window. None of them measures causality; they redistribute the same pie. The honest posture is to run a position-based multi-touch model as the operating metric and calibrate it periodically with incrementality tests.
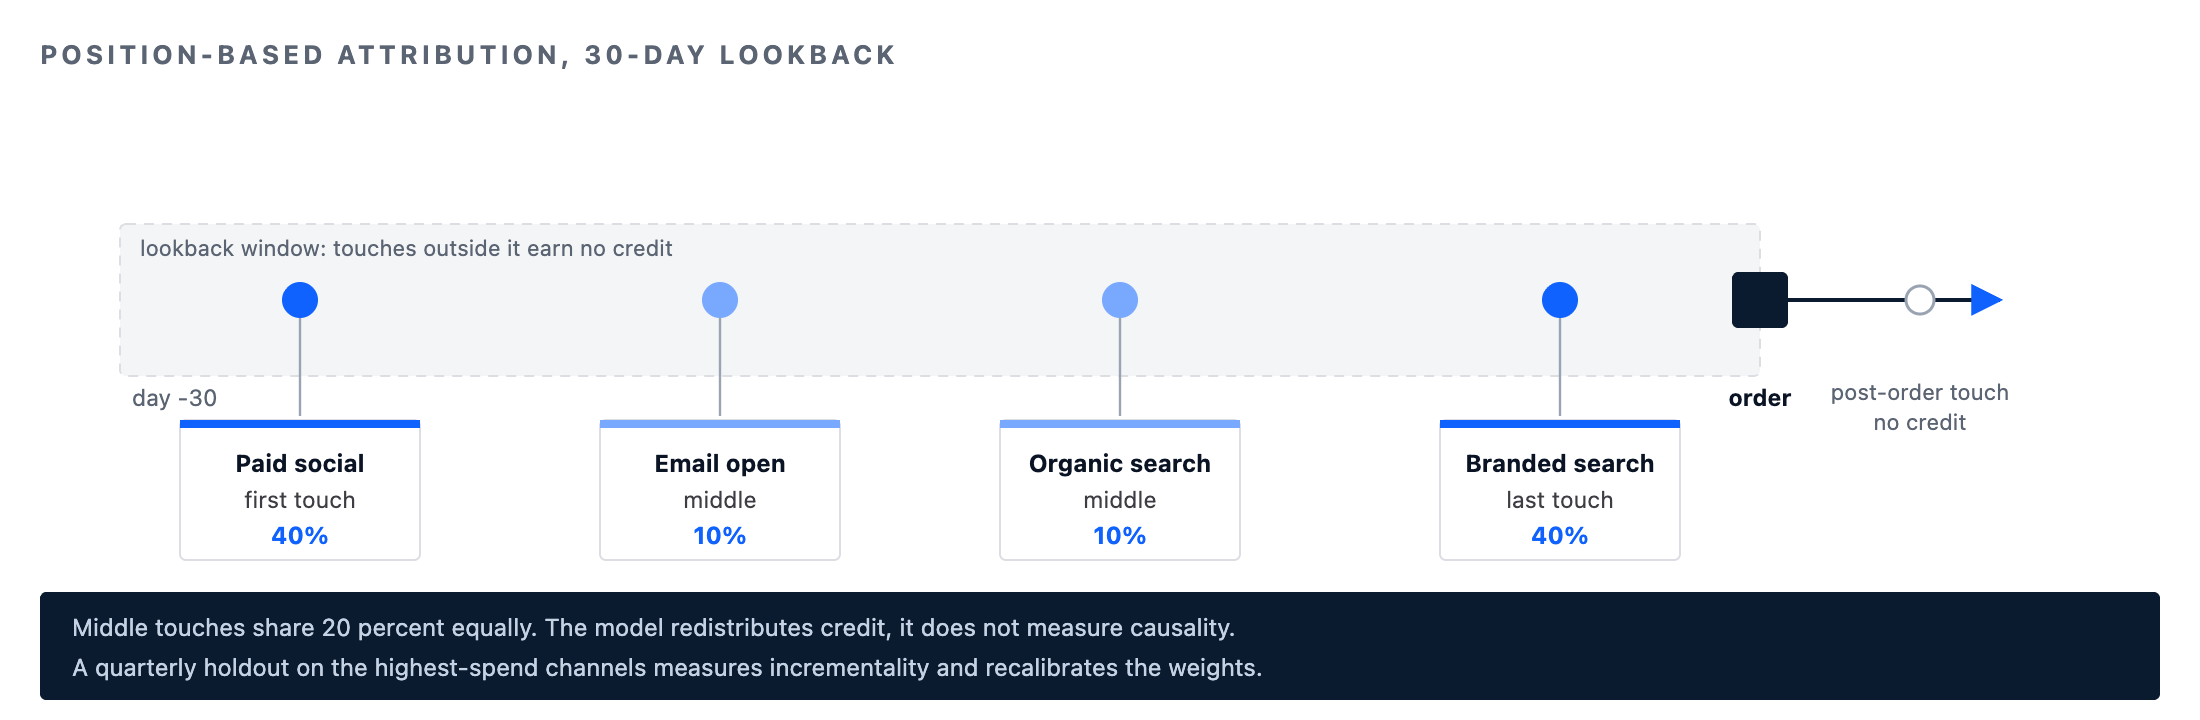
The position-based model below gives 40 percent of an order's net revenue to the first touch in the window, 40 percent to the last, and splits 20 percent across whatever sits between. It runs entirely in SQL with window functions, which matters because it should be reproducible by anyone with warehouse access, not locked inside a vendor's black box.
-- Retail data strategy attribution: position-based 40/20/40 over a 30-day lookback
WITH touches AS (
    SELECT
        o.order_id,
        o.customer_id,
        o.order_ts,
        o.net_revenue,
        t.touch_id,
        t.channel,
        t.campaign_id,
        t.touch_ts,
        ROW_NUMBER() OVER (PARTITION BY o.order_id ORDER BY t.touch_ts ASC)  AS pos_asc,
        ROW_NUMBER() OVER (PARTITION BY o.order_id ORDER BY t.touch_ts DESC) AS pos_desc,
        COUNT(*)     OVER (PARTITION BY o.order_id)                          AS touch_count
    FROM fct_order AS o
    JOIN fct_marketing_touch AS t
      ON  t.customer_id = o.customer_id
      AND t.touch_ts    <  o.order_ts
      AND t.touch_ts    >= o.order_ts - INTERVAL '30 days'
    WHERE o.is_return = FALSE
),
credited AS (
    SELECT
        *,
        CASE
            WHEN touch_count = 1                THEN 1.0
            WHEN touch_count = 2                THEN 0.5
            WHEN pos_asc = 1 OR pos_desc = 1    THEN 0.4
            ELSE 0.2 / (touch_count - 2)
        END AS credit
    FROM touches
)
SELECT
    channel,
    campaign_id,
    DATE_TRUNC('week', order_ts)          AS order_week,
    SUM(credit)                           AS attributed_orders,
    SUM(credit * net_revenue)             AS attributed_net_revenue
FROM credited
GROUP BY channel, campaign_id, DATE_TRUNC('week', order_ts)
ORDER BY attributed_net_revenue DESC;
The calibration in our retail data strategy is a holdout. Every quarter, for the two or three channels that carry most of the spend, we withhold the channel from a randomly assigned group of customers or a matched set of geographies for a fixed window and compare conversion and net revenue against the exposed group. The uplift from the holdout is the incremental effect; the attributed number from the model is what the model thinks. Where they diverge consistently, the model's weights change, not the budget. Reporting both numbers side by side, labelled, is a habit that separates marketing analytics from marketing reporting.
Customer value in the retail data strategy: RFM, cohorts and a lifetime value you can defend
Customer value analytics in a retail data strategy exists to answer two questions: which customers deserve acquisition and retention spend, and whether that spend is working. RFM segmentation is the workhorse because it is explainable to a merchandiser and a marketer in the same meeting, and because it is computed from the order fact table alone.
-- Retail data strategy customer scoring: RFM quintiles over trailing 24 months, returns excluded
WITH customer_orders AS (
    SELECT
        customer_id,
        MAX(order_ts)                       AS last_order_ts,
        COUNT(DISTINCT order_id)            AS order_count,
        SUM(net_revenue)                    AS net_revenue_24m,
        SUM(contribution_margin)            AS margin_24m
    FROM fct_order_line
    WHERE order_ts >= CURRENT_DATE - INTERVAL '24 months'
      AND is_return = FALSE
      AND customer_id IS NOT NULL
    GROUP BY customer_id
),
scored AS (
    SELECT
        customer_id,
        NTILE(5) OVER (ORDER BY last_order_ts DESC)   AS r_score,   -- 1 = most recent
        NTILE(5) OVER (ORDER BY order_count DESC)     AS f_score,
        NTILE(5) OVER (ORDER BY margin_24m DESC)      AS m_score,   -- margin, not revenue
        net_revenue_24m,
        margin_24m
    FROM customer_orders
)
SELECT
    customer_id,
    r_score, f_score, m_score,
    CASE
        WHEN r_score = 1 AND f_score <= 2 AND m_score <= 2 THEN 'champion'
        WHEN r_score <= 2 AND f_score <= 3                 THEN 'loyal'
        WHEN r_score >= 4 AND f_score <= 2                 THEN 'at_risk_high_value'
        WHEN r_score >= 4                                  THEN 'lapsed'
        WHEN r_score = 1 AND f_score = 5                   THEN 'new'
        ELSE 'developing'
    END AS segment,
    net_revenue_24m,
    margin_24m
FROM scored;
The retail data strategy choice to score monetary value on contribution margin rather than revenue is deliberate and it changes the segments. A customer who buys heavily discounted, high-return categories can be top quintile on revenue and bottom quintile on margin. The marketing team spending retention budget on that customer is not making a mistake the revenue view would ever reveal.
Cohort retention is the second retail data strategy view, and it is the one that tells you whether acquisition spend is buying customers or renting them. The query groups customers by first-order month and reports the share still purchasing in each subsequent month.
-- Retail data strategy cohort retention: share of each acquisition cohort active in month N
WITH first_order AS (
    SELECT customer_id, DATE_TRUNC('month', MIN(order_ts)) AS cohort_month
    FROM fct_order
    WHERE is_return = FALSE AND customer_id IS NOT NULL
    GROUP BY customer_id
),
activity AS (
    SELECT DISTINCT customer_id, DATE_TRUNC('month', order_ts) AS activity_month
    FROM fct_order
    WHERE is_return = FALSE
)
SELECT
    f.cohort_month,
    (EXTRACT(YEAR  FROM a.activity_month) - EXTRACT(YEAR  FROM f.cohort_month)) * 12
  + (EXTRACT(MONTH FROM a.activity_month) - EXTRACT(MONTH FROM f.cohort_month)) AS month_offset,
    COUNT(DISTINCT a.customer_id)                                                AS active_customers,
    COUNT(DISTINCT a.customer_id) * 1.0
        / MAX(COUNT(DISTINCT a.customer_id)) OVER (PARTITION BY f.cohort_month)  AS retention_rate
FROM first_order AS f
JOIN activity AS a
  ON a.customer_id = f.customer_id
GROUP BY f.cohort_month, month_offset
ORDER BY f.cohort_month, month_offset;
For lifetime value we prefer a model the finance team will sign: expected margin over a fixed horizon, discounted, built from the cohort curves above rather than from a probabilistic purchase model. Probabilistic models such as BG/NBD are useful for individual-level predictions feeding a marketing platform, but a retail data strategy needs a value number that reconciles to the margin actually recorded, and a cohort-based expectation does that. Twelve-month or twenty-four-month horizons are typical; the horizon is a business decision and should be written down.
Sales operations analytics in the retail data strategy: sell-through, cover and the basket
Sales operations analytics in a retail data strategy is built on the inventory position and the order line meeting at SKU, location and day. The core measures are sell-through (units sold as a share of units available), weeks of cover (stock on hand divided by the recent rate of sale), and the margin consequences of the markdowns that follow when either number goes wrong. The query below computes both from the daily inventory snapshot and the order fact, and it is the one that runs on the trading floor every morning.
-- Retail data strategy sales ops: sell-through and weeks of cover by SKU and location, trailing 4 weeks
WITH sales_4w AS (
    SELECT
        product_id,
        location_id,
        SUM(quantity)             AS units_sold_4w,
        SUM(net_revenue)          AS net_revenue_4w,
        SUM(contribution_margin)  AS margin_4w
    FROM fct_order_line
    WHERE order_ts >= CURRENT_DATE - INTERVAL '28 days'
      AND is_return = FALSE
    GROUP BY product_id, location_id
),
stock AS (
    SELECT product_id, location_id, on_hand_units, on_order_units
    FROM fct_inventory_position
    WHERE snapshot_date = CURRENT_DATE
),
received_4w AS (
    SELECT product_id, location_id, SUM(received_units) AS received_units_4w
    FROM fct_inventory_movement
    WHERE movement_date >= CURRENT_DATE - INTERVAL '28 days'
      AND movement_type = 'receipt'
    GROUP BY product_id, location_id
)
SELECT
    p.category,
    p.product_id,
    s.location_id,
    COALESCE(sl.units_sold_4w, 0)                                          AS units_sold_4w,
    s.on_hand_units,
    COALESCE(sl.units_sold_4w, 0) * 1.0
        / NULLIF(COALESCE(sl.units_sold_4w, 0) + s.on_hand_units, 0)       AS sell_through_4w,
    s.on_hand_units * 1.0 / NULLIF(COALESCE(sl.units_sold_4w, 0) / 4.0, 0) AS weeks_of_cover,
    COALESCE(sl.margin_4w, 0)                                              AS margin_4w
FROM stock AS s
JOIN dim_product AS p
  ON p.product_id = s.product_id
LEFT JOIN sales_4w AS sl
  ON sl.product_id = s.product_id AND sl.location_id = s.location_id
LEFT JOIN received_4w AS r
  ON r.product_id = s.product_id AND r.location_id = s.location_id
ORDER BY weeks_of_cover DESC NULLS FIRST;
In retail data strategy terms, a SKU with weeks of cover above the category's markdown threshold and sell-through below plan is a markdown candidate; a SKU with cover under two weeks and sell-through above plan is a replenishment or transfer candidate. Both lists are produced by the same query with two WHERE clauses, and both should land in the planners' hands before the store opens, which is the argument for running this on the real-time tier rather than the warehouse.
Basket analysis is the retail data strategy counterpart on the sales operations side to marketing's segmentation: what sells with what, measured as lift rather than raw co-occurrence so that popular items do not dominate every pair. The self-join below is the standard market-basket computation and runs comfortably on a columnar engine at tens of millions of order lines.
-- Retail data strategy basket affinity: pairwise lift over trailing 90 days, minimum support applied
WITH baskets AS (
    SELECT DISTINCT order_id, product_id
    FROM fct_order_line
    WHERE order_ts >= CURRENT_DATE - INTERVAL '90 days'
      AND is_return = FALSE
),
totals AS (
    SELECT COUNT(DISTINCT order_id) AS basket_count FROM baskets
),
item_support AS (
    SELECT product_id, COUNT(*) AS baskets_with_item
    FROM baskets
    GROUP BY product_id
),
pairs AS (
    SELECT a.product_id AS product_a, b.product_id AS product_b, COUNT(*) AS baskets_with_pair
    FROM baskets AS a
    JOIN baskets AS b
      ON a.order_id = b.order_id
     AND a.product_id < b.product_id
    GROUP BY a.product_id, b.product_id
    HAVING COUNT(*) >= 50
)
SELECT
    pr.product_a,
    pr.product_b,
    pr.baskets_with_pair,
    pr.baskets_with_pair * 1.0 / ia.baskets_with_item                       AS confidence_a_to_b,
    (pr.baskets_with_pair * 1.0 / t.basket_count)
        / ((ia.baskets_with_item * 1.0 / t.basket_count)
         * (ib.baskets_with_item * 1.0 / t.basket_count))                   AS lift
FROM pairs AS pr
JOIN item_support AS ia ON ia.product_id = pr.product_a
JOIN item_support AS ib ON ib.product_id = pr.product_b
CROSS JOIN totals AS t
WHERE pr.baskets_with_pair * 1.0 / t.basket_count >= 0.001
ORDER BY lift DESC;
Promotion lift: the number marketing and sales ops argue about
A promotion touches both teams. Marketing funds and communicates it; sales operations stocks for it and lives with the markdown afterwards. The disagreement is almost always about lift: how much of the promotional week's sales would have happened anyway. The retail data strategy answer is a control group, either stores that did not run the promotion or a matched set of SKUs, and a comparison of the promotional window against a pre-period for both groups. The difference of the differences is the lift.
-- Retail data strategy promo lift: difference-in-differences against control stores
-- promo_calendar(promo_id, product_id, location_id, start_date, end_date, is_control)
WITH windows AS (
    SELECT
        pc.promo_id,
        pc.product_id,
        pc.location_id,
        pc.is_control,
        ol.order_ts::date AS order_date,
        CASE
            WHEN ol.order_ts::date BETWEEN pc.start_date AND pc.end_date THEN 'promo'
            WHEN ol.order_ts::date BETWEEN pc.start_date - (pc.end_date - pc.start_date + 1)
                                       AND pc.start_date - 1                THEN 'pre'
        END AS period,
        ol.quantity,
        ol.net_revenue,
        ol.contribution_margin
    FROM promo_calendar AS pc
    JOIN fct_order_line AS ol
      ON  ol.product_id  = pc.product_id
      AND ol.location_id = pc.location_id
      AND ol.is_return   = FALSE
      AND ol.order_ts::date BETWEEN pc.start_date - (pc.end_date - pc.start_date + 1) AND pc.end_date
),
agg AS (
    SELECT promo_id, is_control, period,
           SUM(quantity)            AS units,
           SUM(net_revenue)         AS net_revenue,
           SUM(contribution_margin) AS margin
    FROM windows
    WHERE period IS NOT NULL
    GROUP BY promo_id, is_control, period
),
pivoted AS (
    SELECT promo_id,
           MAX(CASE WHEN is_control = FALSE AND period = 'promo' THEN units END) AS test_promo_units,
           MAX(CASE WHEN is_control = FALSE AND period = 'pre'   THEN units END) AS test_pre_units,
           MAX(CASE WHEN is_control = TRUE  AND period = 'promo' THEN units END) AS ctrl_promo_units,
           MAX(CASE WHEN is_control = TRUE  AND period = 'pre'   THEN units END) AS ctrl_pre_units,
           MAX(CASE WHEN is_control = FALSE AND period = 'promo' THEN margin END) AS test_promo_margin,
           MAX(CASE WHEN is_control = FALSE AND period = 'pre'   THEN margin END) AS test_pre_margin
    FROM agg
    GROUP BY promo_id
)
SELECT
    promo_id,
    (test_promo_units * 1.0 / NULLIF(test_pre_units, 0))
      - (ctrl_promo_units * 1.0 / NULLIF(ctrl_pre_units, 0))   AS unit_lift_did,
    test_promo_margin - test_pre_margin                         AS margin_delta_test
FROM pivoted
ORDER BY unit_lift_did DESC;
The retail data strategy reports the margin delta next to the unit lift on purpose. A promotion that lifts units by a third and reduces margin is a promotion that moved stock, which may have been the goal, but it is not a promotion that made money, and the retail data strategy should make that distinction visible rather than leave it for the quarterly review.
The retail data strategy real-time tier: intraday trading on ClickHouse
The sell-through and stock-cover queries above are fine on a warehouse at daily grain. Intraday trading, the hourly view of sales against plan by store and category that e-commerce and store operations run during peak weeks, needs a different engine. We build that tier on ClickHouse, fed from the same order event stream as the core, with a materialised view that pre-aggregates to the hour so the dashboard query touches thousands of rows instead of millions. Engine parameters are declared in full, as they should be in any customer-facing DDL.
-- Retail data strategy real-time tier: order lines as they stream in (ClickHouse 24.x or later)
CREATE TABLE retail.order_line_events
(
    event_ts             DateTime64(3, 'UTC'),
    order_line_id        UInt64,
    order_id             UInt64,
    customer_id          Nullable(UInt64),
    product_id           UInt64,
    category_id          UInt32,
    location_id          UInt32,
    channel_code         LowCardinality(String),
    quantity             Int32,
    net_revenue          Decimal(14, 2),
    contribution_margin  Decimal(14, 2),
    is_return            UInt8,
    inserted_at          DateTime DEFAULT now()
)
ENGINE = ReplicatedMergeTree('/clickhouse/tables/{shard}/retail/order_line_events', '{replica}')
PARTITION BY toYYYYMM(event_ts)
ORDER BY (location_id, category_id, event_ts, order_line_id)
TTL toDateTime(event_ts) + INTERVAL 400 DAY
SETTINGS index_granularity = 8192;

-- Retail data strategy hourly pre-aggregation for the trading dashboard
CREATE TABLE retail.sales_hourly
(
    hour_ts              DateTime('UTC'),
    location_id          UInt32,
    category_id          UInt32,
    channel_code         LowCardinality(String),
    units                AggregateFunction(sum, Int32),
    net_revenue          AggregateFunction(sum, Decimal(14, 2)),
    contribution_margin  AggregateFunction(sum, Decimal(14, 2)),
    orders               AggregateFunction(uniq, UInt64)
)
ENGINE = ReplicatedAggregatingMergeTree('/clickhouse/tables/{shard}/retail/sales_hourly', '{replica}')
PARTITION BY toYYYYMM(hour_ts)
ORDER BY (location_id, category_id, channel_code, hour_ts)
SETTINGS index_granularity = 8192;

CREATE MATERIALIZED VIEW retail.mv_sales_hourly TO retail.sales_hourly AS
SELECT
    toStartOfHour(event_ts)          AS hour_ts,
    location_id,
    category_id,
    channel_code,
    sumState(quantity)               AS units,
    sumState(net_revenue)            AS net_revenue,
    sumState(contribution_margin)    AS contribution_margin,
    uniqState(order_id)              AS orders
FROM retail.order_line_events
WHERE is_return = 0
GROUP BY hour_ts, location_id, category_id, channel_code;

-- Retail data strategy dashboard query: today versus plan, by store and category
SELECT
    location_id,
    category_id,
    sumMerge(units)                  AS units_today,
    sumMerge(net_revenue)            AS net_revenue_today,
    sumMerge(contribution_margin)    AS margin_today,
    uniqMerge(orders)                AS orders_today
FROM retail.sales_hourly
WHERE hour_ts >= toStartOfDay(now('UTC'))
GROUP BY location_id, category_id;
Freshness on this tier is an SLO in the retail data strategy, not an aspiration: we commit to a maximum age of the newest event in sales_hourly and measure it continuously, because a trading dashboard that is silently forty minutes behind is worse than one that is honestly a day behind. The reference architecture post we published on data architecture and engineering for e-commerce and retail covers the ingestion path in more depth.
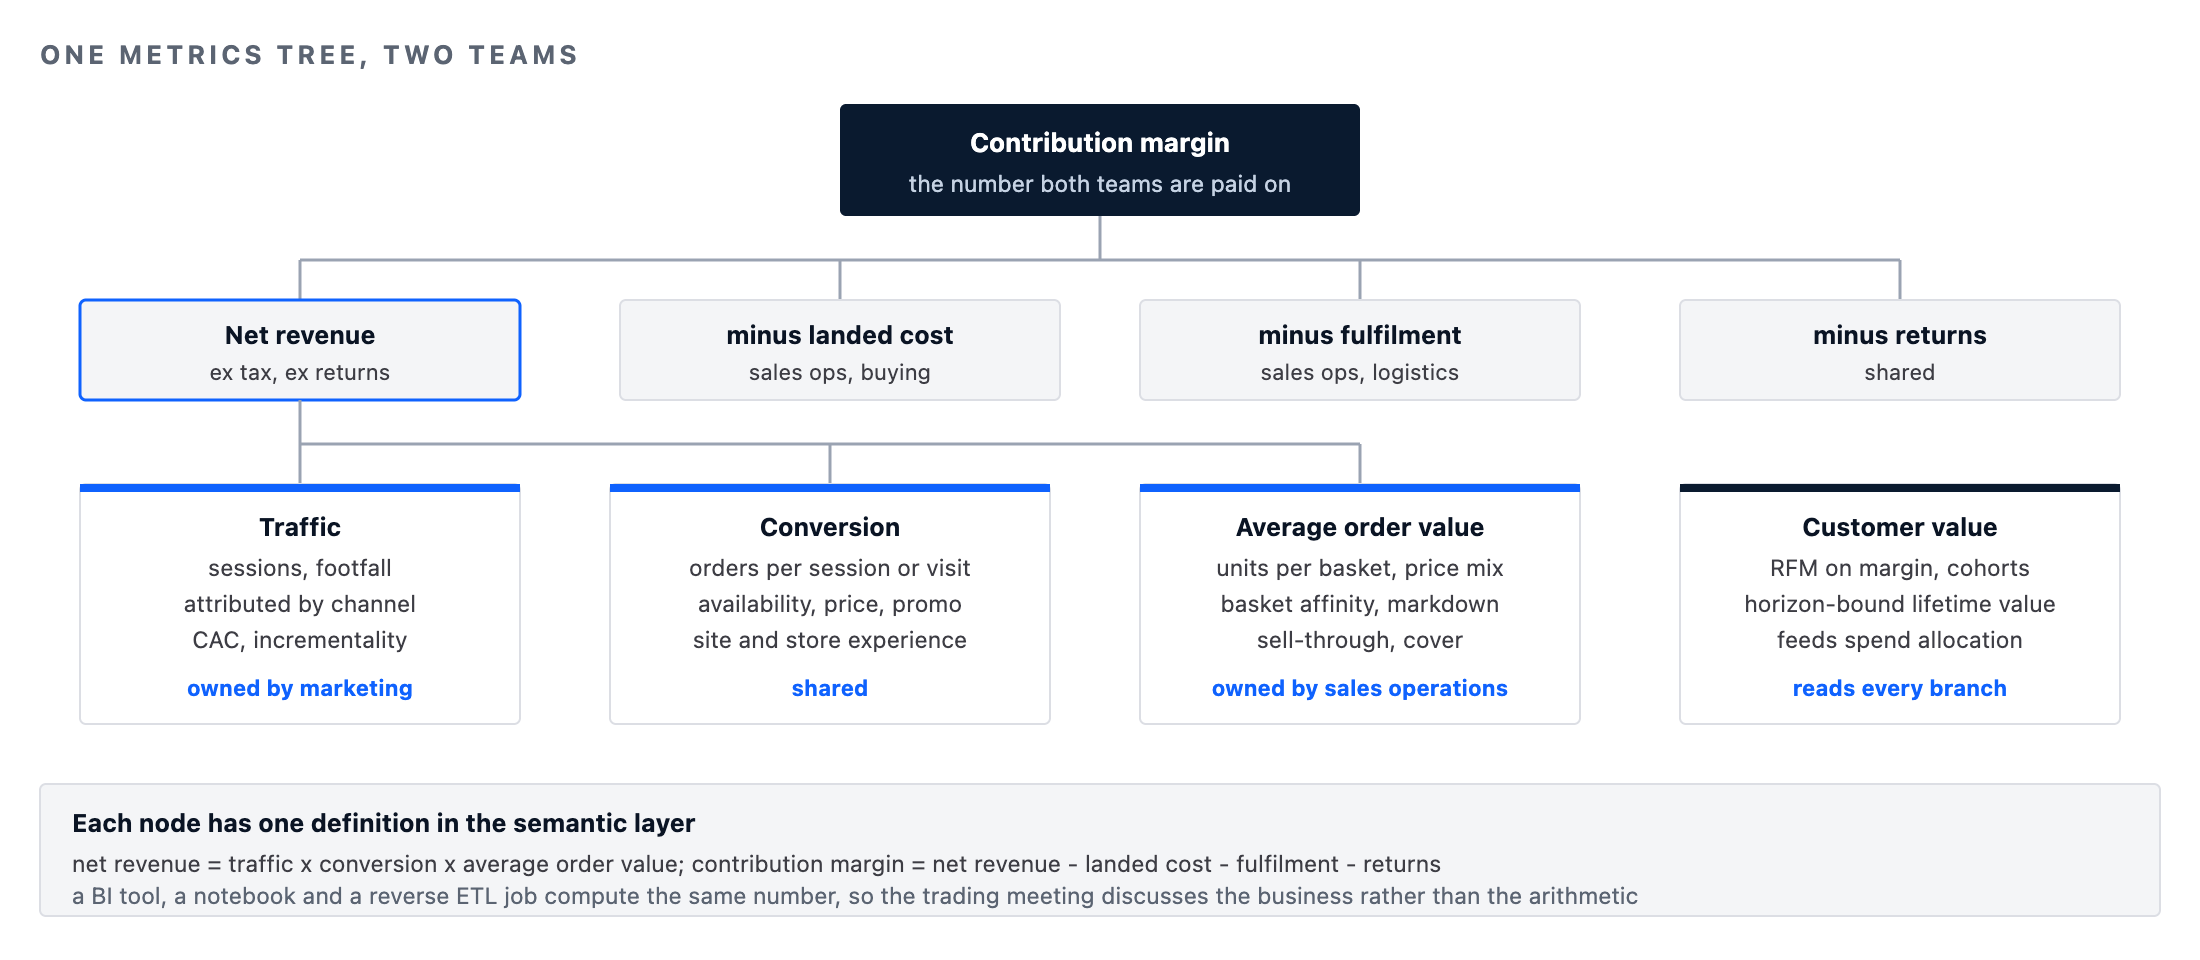
One metrics tree, two teams
The reason marketing analytics and sales operations analytics belong in one retail data strategy is that they are the two halves of a single metrics tree. Net revenue is traffic times conversion times average order value; marketing owns most of traffic and part of conversion, merchandising and store operations own most of average order value and the rest of conversion.
Contribution margin is net revenue less landed cost, fulfilment and returns; sales operations owns cost and fulfilment, marketing's promotions drive the discount line, and returns are shared. When the tree is written down and each node has one definition in the semantic layer, the weekly trading meeting stops being an argument about whose number is right.
We implement the retail data strategy definitions as metrics in the transformation layer, so that a BI tool, a notebook and a reverse ETL job all compute net revenue the same way. The dbt metric below is the definition of net revenue we deploy most often; the important part is not the YAML but the fact that the filter on returns and the exclusion of tax live in exactly one place.
# Retail data strategy semantic layer: one definition of net revenue for every consumer
semantic_models:
  - name: order_lines
    model: ref('fct_order_line')
    defaults:
      agg_time_dimension: order_date
    entities:
      - name: order_line
        type: primary
        expr: order_line_id
      - name: customer
        type: foreign
        expr: customer_id
    dimensions:
      - name: order_date
        type: time
        type_params:
          time_granularity: day
      - name: channel_code
        type: categorical
    measures:
      - name: net_revenue_ex_returns
        agg: sum
        expr: "CASE WHEN is_return THEN 0 ELSE net_revenue END"
      - name: contribution_margin_total
        agg: sum
        expr: contribution_margin

metrics:
  - name: net_revenue
    label: Net revenue (ex tax, ex returns)
    type: simple
    type_params:
      measure: net_revenue_ex_returns
  - name: contribution_margin
    label: Contribution margin (returns applied)
    type: simple
    type_params:
      measure: contribution_margin_total
Retail data strategy governance that survives the people who wrote it
Four governance mechanisms carry most of the weight in a retail data strategy. Data contracts on the source feeds, so that the POS vendor's schema change breaks a test in staging rather than a dashboard on Black Friday.
Row-level security on the serving tiers, so that a regional manager sees regional stores and the franchise partner sees its own; on PostgreSQL that is native row-level security policies, on ClickHouse it is row policies, on the warehouses it is their respective secure-view or policy mechanisms. Consent enforcement in the identity model, described above.
The fourth mechanism is a metric change process: any change to a definition in the semantic layer ships with a note, a backfilled comparison of old and new values over the trailing year, and a date from which the new definition applies.
-- Retail data strategy governance: row-level security on the serving PostgreSQL for regional access
ALTER TABLE mart_store_daily ENABLE ROW LEVEL SECURITY;

CREATE POLICY region_isolation ON mart_store_daily
    FOR SELECT
    USING (region_code = current_setting('app.region_code', true));

-- Verification: a session scoped to one region must see only that region
SET app.region_code = 'WEST';
SELECT region_code, COUNT(*) AS rows_visible
FROM mart_store_daily
GROUP BY region_code;
What to measure about the retail data strategy itself
A retail data strategy that cannot be measured drifts. We track five numbers about the platform, separately from the business metrics it serves, and review them monthly. Identity match rate by channel, because every marketing number is bounded by it. Freshness against SLO for each serving tier, measured as the age of the newest record. Reconciliation variance between the warehouse's month-end net revenue and the ledger, which should be zero and is a defect when it is not.
Attribution coverage, the share of orders with at least one touch in the lookback window. And forecast error, MAPE at SKU and location grain, for the demand forecasts that feed replenishment, because a forecast nobody measures is a guess with a spreadsheet.
-- Retail data strategy platform health: identity match rate and attribution coverage, weekly
SELECT
    DATE_TRUNC('week', o.order_ts)                                              AS order_week,
    o.channel_code,
    COUNT(*)                                                                    AS orders,
    AVG(CASE WHEN o.customer_id IS NOT NULL THEN 1.0 ELSE 0.0 END)              AS identity_match_rate,
    AVG(CASE WHEN EXISTS (
            SELECT 1 FROM fct_marketing_touch AS t
            WHERE t.customer_id = o.customer_id
              AND t.touch_ts BETWEEN o.order_ts - INTERVAL '30 days' AND o.order_ts)
        THEN 1.0 ELSE 0.0 END)                                                  AS attribution_coverage
FROM fct_order AS o
WHERE o.is_return = FALSE
  AND o.order_ts >= CURRENT_DATE - INTERVAL '12 weeks'
GROUP BY DATE_TRUNC('week', o.order_ts), o.channel_code
ORDER BY order_week DESC, o.channel_code;
Sequencing a retail data strategy: what to build first
The order of retail data strategy work matters because each layer is only as good as the one beneath it. The first quarter is the order line fact with net revenue and margin reconciled to the ledger, the daily inventory position, and the identity model with a reported match rate; nothing else is trustworthy until those exist.
The second quarter of a retail data strategy adds the marketing touch feed, the attribution model with its first holdout, and RFM and cohort views into the CRM through reverse ETL. The third adds the real-time tier for intraday trading and the promotion lift framework.
Demand forecasting and lifetime value modelling come after that, because both consume everything built before them. Retailers who start with forecasting or with a customer data platform purchase, in our experience, spend the following year rebuilding the foundation they skipped.
Where this retail data strategy needs adjusting
Grocery and fashion retail data strategy work differ enough that the sales operations layer changes shape: grocery needs waste and shelf-life in the inventory model and runs promotion lift at much higher frequency; fashion needs size-curve and season-end markdown logic that the four-week sell-through query only approximates.
Marketplaces and franchise models complicate identity and margin because part of the transaction happens outside the retailer's systems. The SQL above targets PostgreSQL and the ANSI subset the major warehouses share; the recursive identity CTE and the interval arithmetic need dialect adjustment on BigQuery and Snowflake. And every model and DDL here should be tested on a non-production copy with production-shaped volumes before it carries a trading decision, with backups and a rehearsed restore in place before the real-time tier goes live.
Retail data strategy: questions we are asked most
Should a retail data strategy start with a customer data platform purchase?
Usually not. In a retail data strategy a customer data platform is a serving and activation layer; it is only as good as the identity resolution and the order facts underneath it. Retailers who build the core model first can adopt a CDP later with clean inputs, or find they no longer need one.
Which attribution model should marketing use?
A position-based multi-touch model as the operating metric, calibrated against holdout tests on the highest-spend channels each quarter. Last-touch is acceptable only as a secondary view; it systematically over-credits branded search and email.
Does sales operations analytics in a retail data strategy need a real-time tier?
For daily replenishment and markdown decisions, no; a warehouse at daily grain is enough. For intraday trading during peak periods, promotion monitoring and store-level stock alerts, yes, and ClickHouse fed from the order event stream is the tier we deploy for it.
How is a retail data strategy kept from decaying?
By measuring the platform itself: identity match rate, freshness against SLO, ledger reconciliation variance, attribution coverage and forecast error, reviewed monthly, with a change process for every metric definition in the semantic layer.
Working with MinervaDB on retail data strategy
MinervaDB designs and operates retail data platforms end to end: the canonical model and identity resolution, the warehouse and lakehouse core through our data analytics and data warehousing practice, the pipelines through data engineering consulting, and the real-time tier through our ClickHouse practice. Strategy engagements start with the data strategy and analytics assessment; managed operations carry the freshness, reconciliation and match-rate SLOs described above. Talk to a principal engineer through our contact page. Further reading: the dbt semantic layer metrics reference and the ClickHouse AggregatingMergeTree documentation.
Running this in production?
MinervaDB provides Data Analytics and Data Warehousing Support, Data Analytics Platform Engineering and Data Strategy and Analytics Consulting with 24x7 coverage and a 15-minute S1 response. Talk to an engineer.