Valkey 9.1.2 shipped on 1 September 2026 as the current patch of the 9.1 line, alongside 9.0.6 for estates still on 9.0. It is a quiet release on paper and a consequential one for Valkey 9.1.2 performance and scalability in production: the I/O threading path was reworked across 9.1.0, 9.1.1 and 9.1.2, small strings got a new in-memory layout, sorted sets lost a pointer per member, and the hardware clock became the default. Most of that arrives with no configuration change at all, which is exactly why the configuration that surrounds it deserves a second look.
This post is our working guide to Valkey 9.1.2 performance and scalability: the one our Valkey consulting and support engineers use when they take over or tune a 9.1.x estate. It is organised as an annotated valkey.conf: seven blocks, each with the directives that matter, the value we start from, the reason, and the INFO field or command that tells you whether it helped. Every figure quoted from the Valkey project is attributed; every figure of our own is labelled illustrative; and nothing here should reach a production node without a staged, reversible rollout, which is the last section.
Version pins matter in this space, and Valkey 9.1.2 performance and scalability claims more than most. Unless stated otherwise, everything below applies to Valkey 9.1.2 self-managed on Linux with jemalloc, and is called out where 9.0 or 8.x behaves differently. Managed services such as ElastiCache, MemoryDB, Memorystore for Valkey and Azure Managed Redis expose a subset of these directives, and the subset changes; we confirm the current parameter group before recommending a value on any of them.
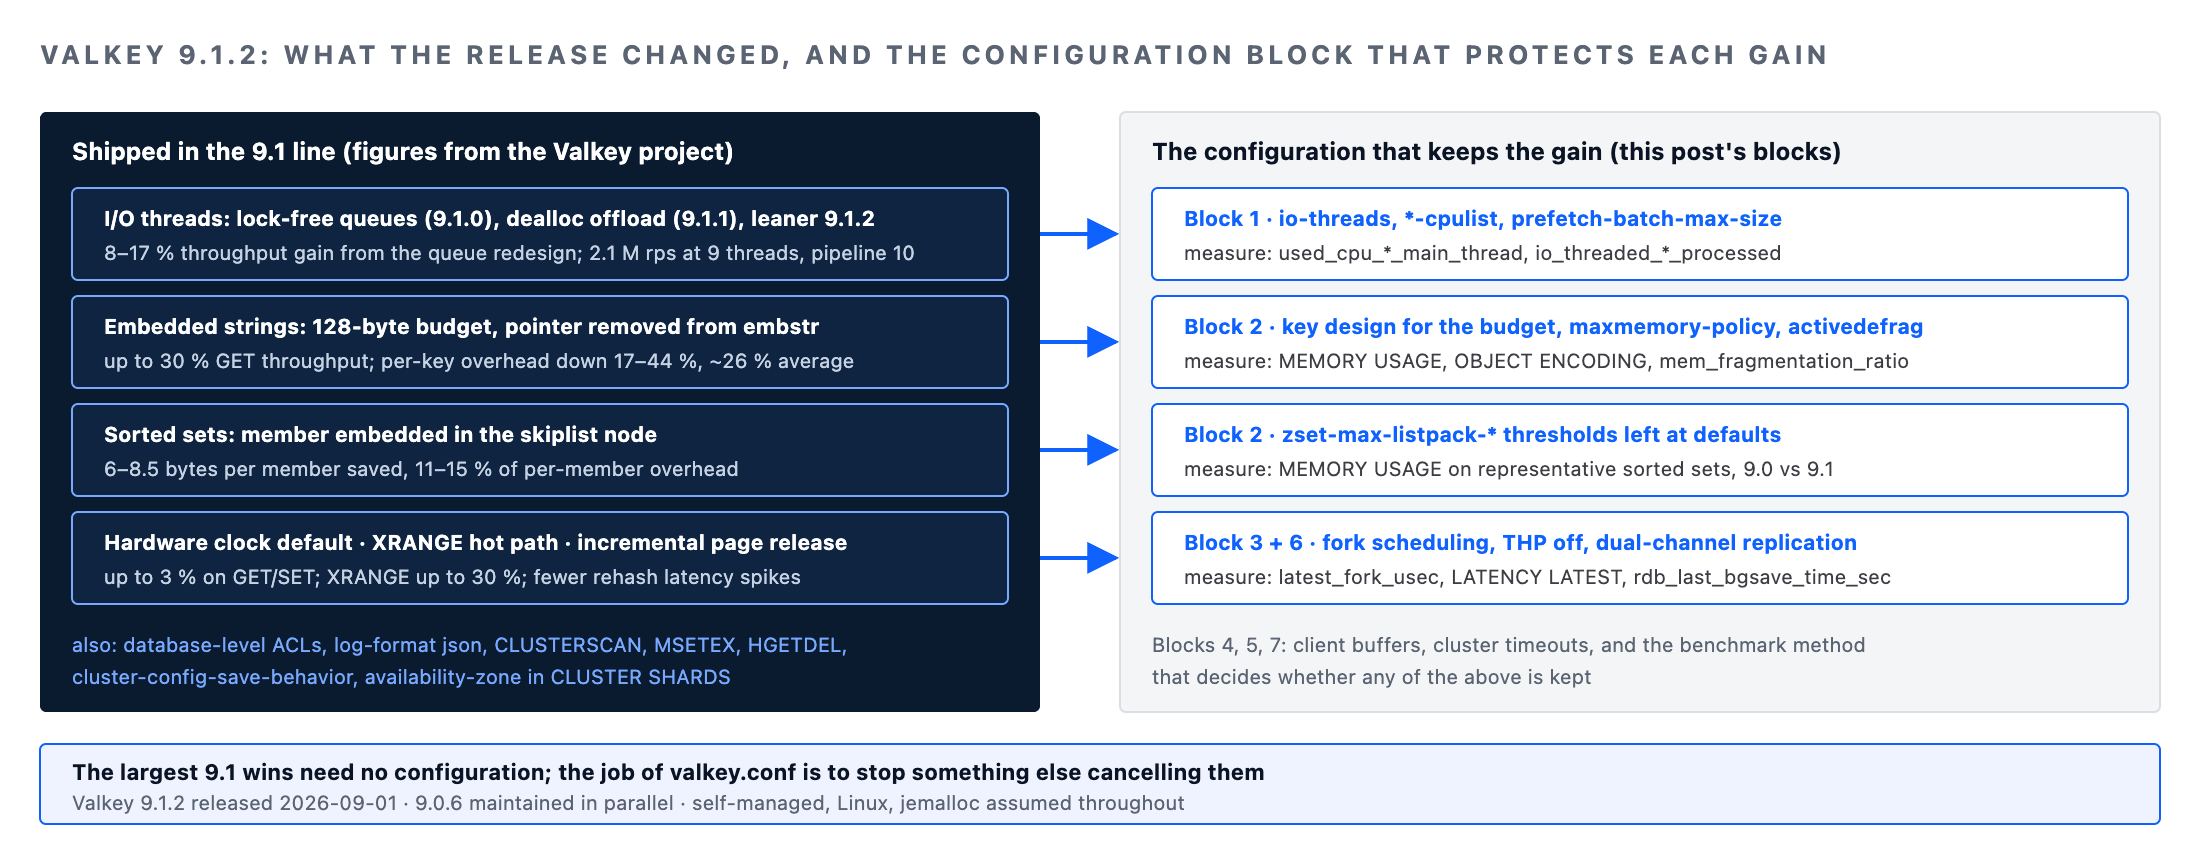
The Valkey 9.1.2 performance and scalability changes a tuning guide has to respect
Four changes in the 9.1 line move the tuning baseline, and each is documented by the project rather than by us. First, the communication model between the main thread and I/O threads was redesigned around lock-free queues, which the release notes credit with an 8 to 17 percent throughput gain, and 9.1.1 and 9.1.2 then offloaded object deallocation to the I/O threads and removed unnecessary post-read processing and a per-write client lookup.
Second, the embedded-string threshold rose from 64 to 128 bytes and the redundant pointer inside embstr objects was removed; the project measured up to 30 percent higher GET throughput and per-key overhead reductions of 17 to 44 percent, averaging about 26 percent, for keys whose header, key, expiry and value fit the new budget.
Third, sorted-set members are now embedded in the skiplist node rather than referenced by pointer, saving roughly 6 to 8.5 bytes per member for typical short members, around 11 to 15 percent of per-member overhead. Fourth, the hardware clock is enabled by default, worth up to 3 percent on GET and SET, and XRANGE and XREVRANGE gained a hot-path optimisation the project puts at up to 30 percent. Alongside these sit database-level ACLs, JSON logging, CLUSTERSCAN, MSETEX, HGETDEL and the new cluster-config-save-behavior directive.
The practical consequence for Valkey 9.1.2 performance and scalability is that the largest wins are free, and the job of configuration is to stop something else from cancelling them: an I/O thread count that starves the main thread, an eviction policy that fights the new memory layout, or a persistence schedule that forks at the worst moment. Everything that follows is about that.
Block 1: I/O threading, where Valkey 9.1.2 performance and scalability work starts
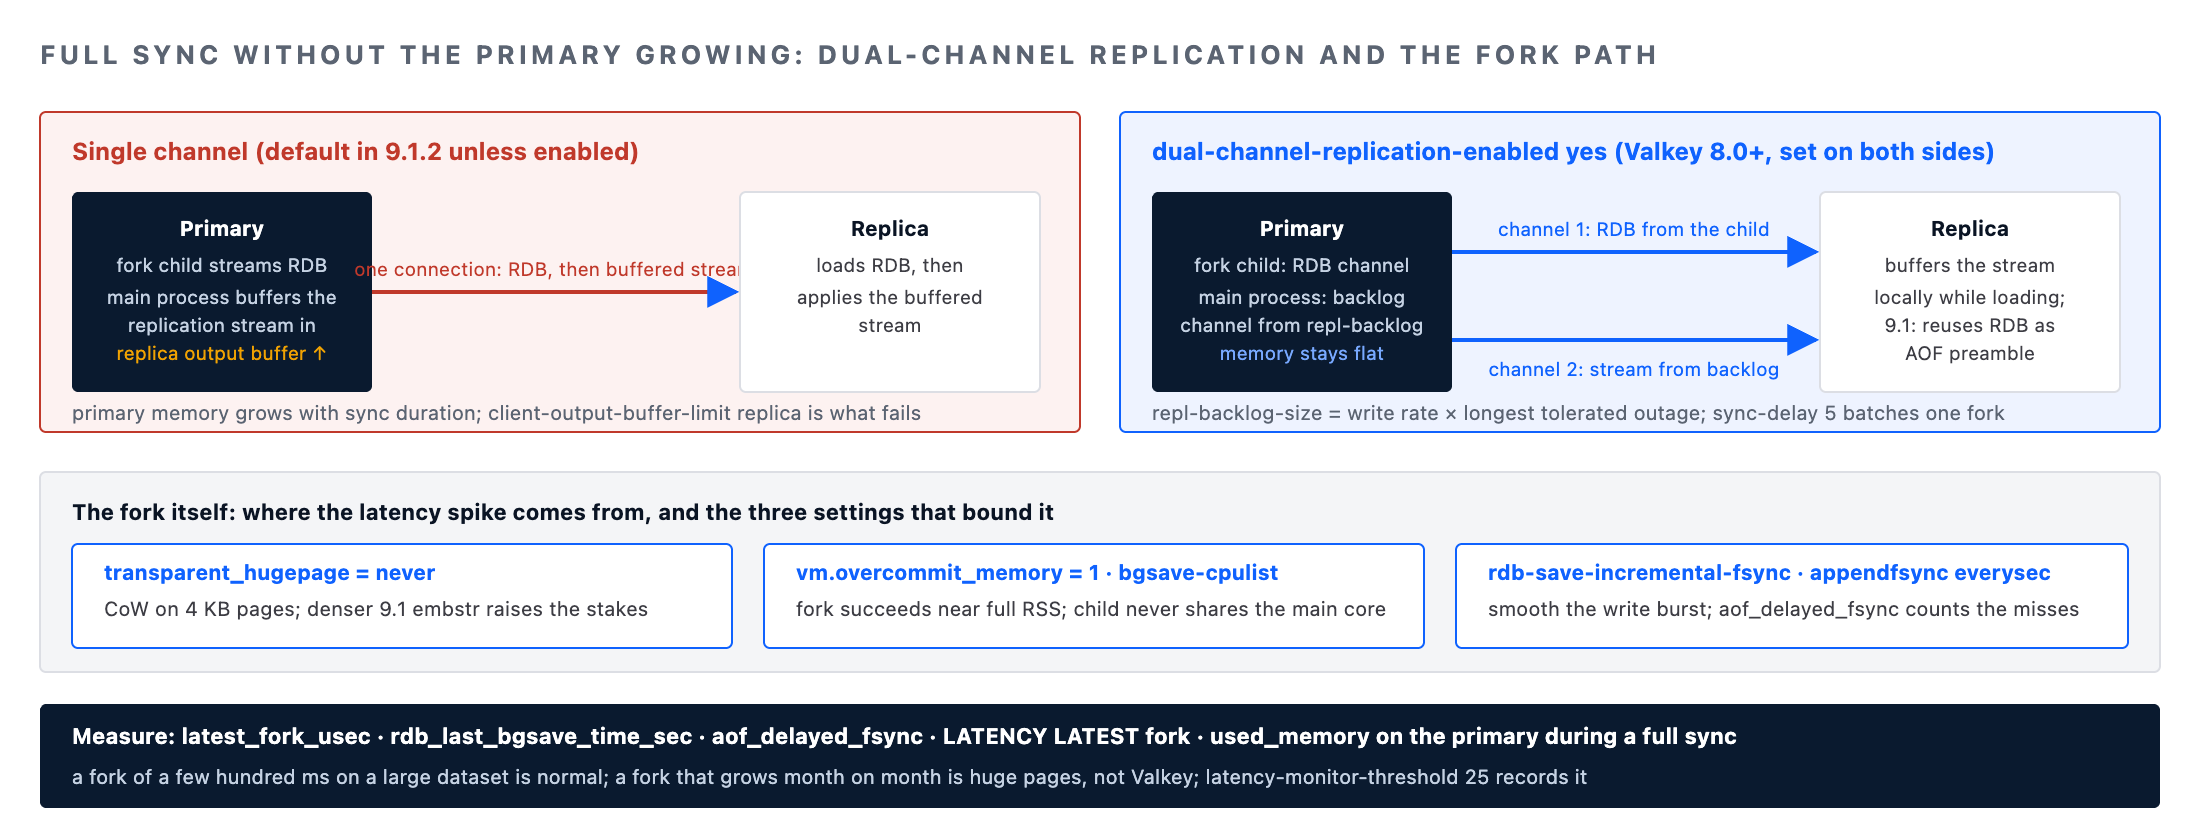
Valkey 8.0 made I/O threads asynchronous and 9.1 made them cheap to talk to. The main thread still executes every command; the I/O threads parse, read, write and, since 9.1.1, free objects. The directive is io-threads, it requires a restart, and the project's own guidance is to enable it only on machines with at least three cores, leaving one spare. The legacy io-threads-do-reads directive is deprecated and has no effect in 9.x; reads are always offloaded once io-threads is above 1.
# valkey.conf — Block 1: I/O threading (Valkey 9.1.2, restart required for io-threads)
# Valkey 9.1.2 performance and scalability starting point on a 16-vCPU node dedicated to Valkey
io-threads 9                       # main thread + 8 I/O threads; the project's 2.1 M rps figure used 9
prefetch-batch-max-size 16         # default; batch-prefetch keys for pipelined clients (9.0+, single- and multi-threaded)

# Pin threads so the kernel scheduler does not migrate them across NUMA nodes
server-cpulist 0                   # main thread
io-threads-cpulist 1-8             # one core per I/O thread, same NUMA node as the main thread
bio-cpulist 9-10                   # background I/O (fsync, close) away from the hot path
aof-rewrite-cpulist 11-12          # child processes on their own cores
bgsave-cpulist 11-12
The number is the thing everyone wants and nobody can give in the abstract. Our starting rule in Valkey consulting and support engagements is cores minus the main thread minus what the operating system, the exporter and the fork children need, capped where the main thread saturates. The measurement that settles it is in INFO CPU and INFO STATS: used_cpu_user_main_thread and used_cpu_sys_main_thread against wall time tell you whether the main thread is the bottleneck, and io_threaded_reads_processed and io_threaded_writes_processed tell you the threads are actually taking the work. Valkey 9.1 adds cumulative main-thread and I/O-thread usage metrics that make this a single ratio rather than a calculation.
# Valkey 9.1.2 performance and scalability check: is the main thread the bottleneck? Sample twice, 60 s apart, difference the counters.
valkey-cli -h ${VALKEY_HOST} -p ${VALKEY_PORT} --user ${VALKEY_USER} --pass ${VALKEY_PASSWORD} INFO CPU \
  | grep -E 'used_cpu_(user|sys)_main_thread'
valkey-cli -h ${VALKEY_HOST} -p ${VALKEY_PORT} --user ${VALKEY_USER} --pass ${VALKEY_PASSWORD} INFO STATS \
  | grep -E 'io_threaded_(reads|writes)_processed|instantaneous_ops_per_sec'

# Expected shape on a well-sized node: main-thread CPU well under 1.0 core-second per second,
# I/O counters climbing at a large multiple of ops/sec when clients pipeline.
Two failure modes recur in Valkey 9.1.2 performance and scalability tickets. Setting io-threads to the vCPU count leaves nothing for the fork child, and the next BGSAVE stalls the main thread while it competes for a core. And enabling threads on a workload of tiny, unpipelined requests from a handful of clients yields nothing, because there is not enough socket work to distribute; the counters above will show it, and the honest recommendation is to leave io-threads at 1.
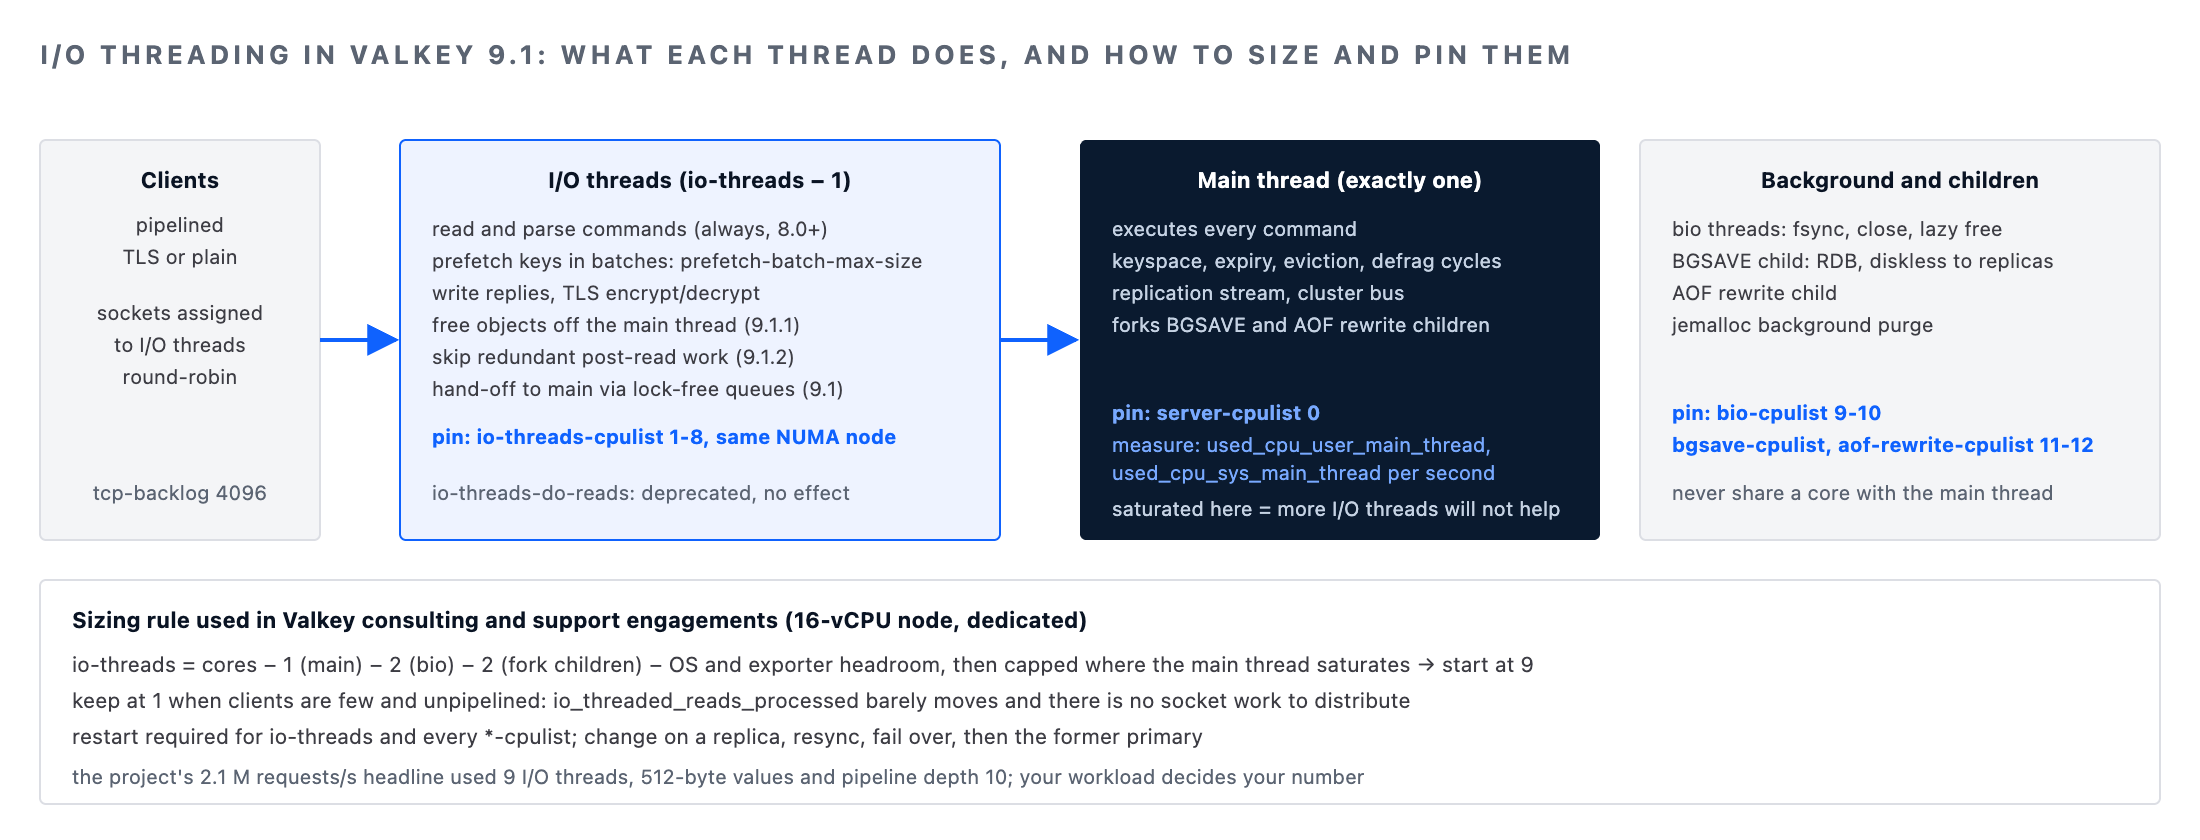
Block 2: memory, the 128-byte budget, and Valkey 9.1.2 performance and scalability per byte
The single most useful thing to know about memory in Valkey 9.1 is the new embedded-string budget. A key whose object header, key name, expiry metadata and value together fit within 128 bytes is stored as one allocation, and the project's measurements show per-key overhead falling by 17 to 44 percent for those keys. Nothing needs configuring, but key design decides who benefits: a session key with a 40-byte name and a 60-byte value qualifies; the same value under a 90-byte name does not. Our Valkey 9.1.2 performance and scalability reviews now start by sampling production keys for exactly that boundary.
# Sample representative keys before and after the 9.1 upgrade; multiply the per-key delta by key count
for k in session:abc123 cart:u:8812 rate:api:v2:token; do
  valkey-cli -h ${VALKEY_HOST} --user ${VALKEY_USER} --pass ${VALKEY_PASSWORD} MEMORY USAGE "$k"
  valkey-cli -h ${VALKEY_HOST} --user ${VALKEY_USER} --pass ${VALKEY_PASSWORD} OBJECT ENCODING "$k"
done
# raw -> embstr after upgrade means the key crossed into the 128-byte budget
# valkey.conf — Block 2: memory (Valkey 9.1.2 performance and scalability baseline; all runtime-settable via CONFIG SET unless noted)
maxmemory 48gb                        # leave headroom for fork copy-on-write and client buffers on a 64 GB node
maxmemory-policy allkeys-lfu          # LFU beats LRU on skewed read caches; volatile-* only when TTL discipline exists
lfu-log-factor 10                     # default; raise to 100 on very hot-skewed keyspaces
lfu-decay-time 1
maxmemory-clients 5%                  # cap total client memory so a runaway consumer cannot evict data (7.0+)

activedefrag yes                      # jemalloc only; keeps mem_fragmentation_ratio near 1.0 under churn
active-defrag-ignore-bytes 200mb
active-defrag-threshold-lower 10
active-defrag-threshold-upper 100
active-defrag-cycle-min 1
active-defrag-cycle-max 25            # cap CPU spent defragmenting; watch p99 when raising

hash-max-listpack-entries 128         # defaults; raise only with a measured saving on MEMORY USAGE
hash-max-listpack-value 64
zset-max-listpack-entries 128         # above this, skiplist encoding: 9.1 embeds the member in the node
zset-max-listpack-value 64
set-max-listpack-entries 128

lazyfree-lazy-eviction yes            # Valkey 8.0+ defaults: free large values off the main thread
lazyfree-lazy-expire yes
lazyfree-lazy-server-del yes
lazyfree-lazy-user-del yes
lazyfree-lazy-user-flush yes
active-expire-effort 1                # raise toward 10 only if expired keys accumulate faster than they are reclaimed
Three measurements govern this block in every Valkey 9.1.2 performance and scalability review. mem_fragmentation_ratio in INFO MEMORY above 1.5 under a stable dataset means active defragmentation is off or under-budgeted; below 1.0 means the process is swapping or the allocator is overcommitted, and the fix is capacity, not configuration. evicted_keys and expired_keys in INFO STATS trending against keyspace_hits tell you whether the eviction policy is discarding what the application then re-reads. And allocator_frag_ratio versus mem_fragmentation_ratio separates jemalloc-internal fragmentation, which defrag addresses, from RSS held by the kernel, which it does not.
Block 3: persistence and replication, the Valkey 9.1.2 performance and scalability fix for the fork stall
Persistence is where Valkey latency incidents come from, and the 9.1 line changes the cost side twice: a replica that completed a disk-based full sync can reuse the RDB file as its AOF preamble instead of rewriting, and rehashing now releases pages incrementally to cut latency spikes. The directives that decide Valkey 9.1.2 performance and scalability here are about when the fork happens and how the replica receives the data.
# valkey.conf — Block 3: persistence and replication (Valkey 9.1.2 performance and scalability baseline)
appendonly yes
appendfsync everysec                  # the durability/latency balance for caches that must survive restart
aof-use-rdb-preamble yes              # default; 9.1 replicas reuse the full-sync RDB as the preamble
aof-rewrite-incremental-fsync yes
rdb-save-incremental-fsync yes        # fsync every 4 MB during BGSAVE; smooths the I/O burst
auto-aof-rewrite-percentage 100
auto-aof-rewrite-min-size 1gb         # avoid rewrite storms on small, churny datasets

save 3600 1 300 100 60 10000          # keep RDB snapshots for backups even with AOF on
stop-writes-on-bgsave-error yes       # fail loudly; do not silently run without snapshots

repl-diskless-sync yes                # default; stream the RDB to replicas from the child's socket
repl-diskless-sync-delay 5            # wait for more replicas to batch a single fork
repl-diskless-sync-max-replicas 0
repl-diskless-load disabled           # 'swapdb' only when the replica has memory for two datasets
dual-channel-replication-enabled yes  # Valkey 8.0+: RDB over one channel, backlog over another; set on both sides
repl-backlog-size 512mb               # sized from write throughput × longest tolerated replica outage
repl-timeout 60
latency-monitor-threshold 25          # record any event over 25 ms in LATENCY HISTORY, including fork
latency-tracking yes
latency-tracking-info-percentiles 50 99 99.9
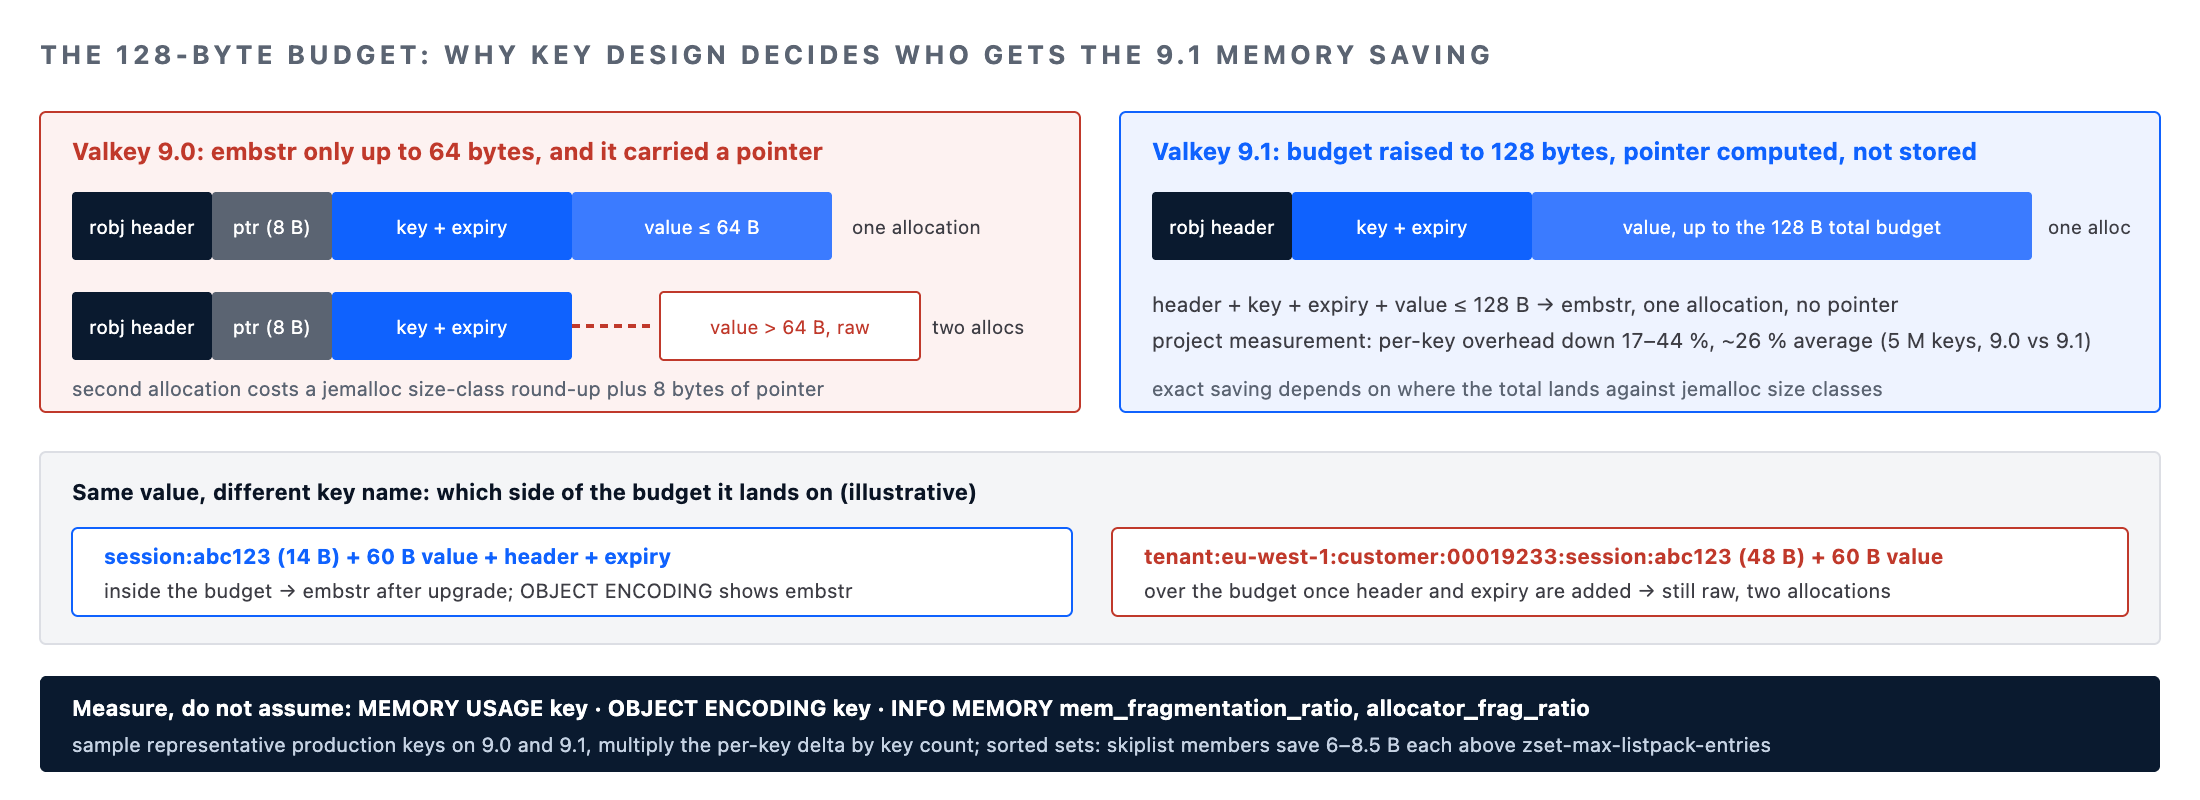
Dual-channel replication deserves emphasis in any Valkey 9.1.2 performance and scalability review because it changes an old rule. Before Valkey 8.0, a full sync meant the primary buffered the replication stream in its own memory while the RDB transferred, and the buffer size was the reason large full syncs failed. With dual-channel-replication-enabled yes on both primary and replica, the RDB goes over one connection from the fork child and the backlog over another from the main process, so the primary's memory does not grow with sync duration. It is not the default in 9.1.2; we turn it on wherever the replica fleet is also 8.0 or later.
The measurements are rdb_last_bgsave_time_sec, aof_delayed_fsync and latest_fork_usec in INFO PERSISTENCE and INFO STATS, and the fork event in LATENCY LATEST. A fork over a few hundred milliseconds on a large dataset is expected; a fork that grows month on month is transparent huge pages, which is Block 6.
Block 4: clients, buffers and the background loop
# valkey.conf — Block 4: clients, output buffers and the cron loop (Valkey 9.1.2 performance and scalability baseline)
maxclients 20000
tcp-backlog 4096                      # must also raise net.core.somaxconn; the kernel silently clamps to it
tcp-keepalive 300
timeout 0

client-output-buffer-limit normal 0 0 0
client-output-buffer-limit replica 1gb 512mb 60      # sized from repl-backlog and full-sync duration
client-output-buffer-limit pubsub 64mb 16mb 60       # disconnect slow subscribers before they take the node down
client-query-buffer-limit 1gb
proto-max-bulk-len 512mb

hz 10                                 # default; dynamic-hz scales it with connected clients
dynamic-hz yes
slowlog-log-slower-than 5000          # 5 ms; production traffic should rarely appear here
slowlog-max-len 1024
log-format json                       # Valkey 9.1: structured logs for the observability pipeline
The pub/sub output buffer limit is the directive we most often find at its default on estates that page at 03:00. A single slow subscriber under a chatty channel accumulates output in the server's memory until maxmemory is reached and eviction begins across the whole dataset; a 64 MB hard limit with a 16 MB soft limit over 60 seconds disconnects that one client instead. CLIENT LIST with its omem and tot-mem fields, and client_recent_max_output_buffer in INFO CLIENTS, are where the evidence is. Our Valkey 9.1.2 performance and scalability health checks read them before anything else in this block.
Block 5: cluster directives and the Valkey 9.1.2 performance and scalability change in slot migration
Valkey 9.0 introduced atomic slot migration, and 9.1 added CLUSTERSCAN for cluster-wide key scanning, an availability-zone field in CLUSTER SHARDS and CLUSTER SLOTS, and a directive for how nodes.conf is saved. The tuning is small but the operational change is large: resharding no longer means a client-visible MIGRATE storm.
# valkey.conf — Block 5: cluster (Valkey 9.1.2 performance and scalability baseline)
cluster-enabled yes
cluster-node-timeout 15000            # default; lower toward 5000 only on a LAN with measured gossip latency
cluster-replica-validity-factor 10
cluster-require-full-coverage no      # serve the slots you own during a partial outage
cluster-allow-reads-when-down yes     # replicas keep answering reads while the cluster votes
cluster-allow-replica-migration yes
cluster-config-save-behavior sync     # 9.1 default; 'best-effort' only where nodes.conf lives on unreliable disk
availability-zone ${AZ_NAME}          # surfaced in CLUSTER SHARDS; clients can prefer same-zone replicas

# Resharding on Valkey 9.x: atomic slot migration, no per-key MIGRATE
valkey-cli --cluster rebalance ${SEED_HOST}:${SEED_PORT} \
  --cluster-use-atomic-slot-migration --cluster-use-empty-masters
valkey-cli -h ${SEED_HOST} -p ${SEED_PORT} CLUSTER MIGRATESLOTS SLOTSRANGE 0 1000 NODE ${TARGET_NODE_ID}
CLUSTER INFO gives cluster_stats_messages_received and the cluster_state transitions that justify or forbid a lower cluster-node-timeout; a timeout set below the measured gossip round trip under load produces false failovers, which is the most expensive tuning mistake in this block.
Block 6: kernel settings that decide Valkey 9.1.2 performance and scalability before the first start
# Host settings for Valkey 9.1.2 performance and scalability, applied before the first valkey-server start
# Transparent huge pages: fork copy-on-write on 2 MB pages is the classic latency-spike cause
echo never > /sys/kernel/mm/transparent_hugepage/enabled
echo never > /sys/kernel/mm/transparent_hugepage/defrag

cat >> /etc/sysctl.d/90-valkey.conf <<'EOF'
vm.overcommit_memory = 1          # fork must succeed even when RSS is close to physical memory
vm.swappiness = 1                 # never trade Valkey pages for page cache
net.core.somaxconn = 4096         # must be >= tcp-backlog or the backlog is silently clamped
net.ipv4.tcp_max_syn_backlog = 8192
net.ipv4.tcp_fin_timeout = 15
EOF
sysctl --system

# NUMA: keep the process on one node; cross-node memory access costs more than an I/O thread saves
numactl --cpunodebind=0 --membind=0 /usr/local/bin/valkey-server /etc/valkey/valkey.conf
Valkey logs a warning at startup for every one of these it can detect, and the warning is right; a Valkey 9.1.2 performance and scalability review starts by reading that log. Transparent huge pages in particular interact with the 9.1 memory improvements in an unhelpful way: the smaller, denser allocations that embstr now produces make copy-on-write during a fork touch more distinct 4 KB pages per megabyte of change, so a node that tolerated always on 8.x may not on 9.1.
Block 7: measuring Valkey 9.1.2 performance and scalability with valkey-benchmark
No directive above is a Valkey 9.1.2 performance and scalability recommendation until it has been measured on the workload it is meant to serve. Valkey 9.1's valkey-benchmark added --warmup and --duration and reports a requests-per-second distribution alongside latency, and the project's guidance is to replace the defaults with a keyspace, a payload size and a pipeline depth that resemble production.
# Valkey 9.1.2 performance and scalability before/after run for a configuration change; identical client host, identical flags
valkey-benchmark -h ${VALKEY_HOST} -p ${VALKEY_PORT} --user ${VALKEY_USER} -a ${VALKEY_PASSWORD} \
  -t set,get -r 1000000 -d 512 -P 16 -c 64 --threads 8 \
  --warmup 30 --duration 120 --csv > run-$(date +%Y%m%dT%H%M%S).csv

# Server-side truth for the same window: per-command p50/p99/p99.9 from latency-tracking
valkey-cli -h ${VALKEY_HOST} --user ${VALKEY_USER} --pass ${VALKEY_PASSWORD} INFO LATENCYSTATS
valkey-cli -h ${VALKEY_HOST} --user ${VALKEY_USER} --pass ${VALKEY_PASSWORD} LATENCY HISTOGRAM get set
valkey-cli -h ${VALKEY_HOST} --user ${VALKEY_USER} --pass ${VALKEY_PASSWORD} SLOWLOG GET 25
| Change under test | Metric that decides it | Keep it if |
|---|---|---|
io-threads 1 → 9 | ops/sec at fixed p99; main-thread CPU ratio | Throughput rises and main-thread CPU falls below saturation; otherwise the workload lacks socket work |
allkeys-lru → allkeys-lfu | keyspace_hits / (hits + misses) over 24 h | Hit ratio improves with eviction count flat; revert if evicted_keys spikes on cold-start |
activedefrag on | mem_fragmentation_ratio; p99 during defrag cycles | Ratio trends toward 1.0–1.2 with no p99 regression above the SLO |
dual-channel-replication-enabled | Primary used_memory during full sync; sync duration | Primary memory stays flat through the sync and no replica disconnects on buffer limits |
cluster-node-timeout lower | Failover count; cluster_state flaps over 7 days | Zero false failovers under peak load and a rehearsed network partition |
Illustratively, for Valkey 9.1.2 performance and scalability on a 16-vCPU node with 512-byte values and pipelined clients, the shape we expect from Blocks 1 and 6 together is a throughput multiple in the low single digits over the single-threaded baseline with p99 flat or better; the project's own headline of 2.1 million requests per second used nine I/O threads and a pipeline depth of ten. Your number will differ, and the point of the table is that the decision rule is written down before the run.
Rolling out Valkey 9.1.2 performance and scalability changes without an incident
Every directive in this post falls into one of three classes, and the Valkey 9.1.2 performance and scalability rollout plan is written by class. Runtime directives change with CONFIG SET and persist with CONFIG REWRITE, one at a time, replica first, with a defined observation window. Restart directives, of which io-threads and the CPU lists are the ones that matter, go in with a replica restart, a resync check, a planned failover and then the former primary. Kernel settings go in before Valkey is started on a fresh host and are verified from the startup log.
| Directive | Applies via | Rollback |
|---|---|---|
io-threads, *-cpulist | Restart | Previous conf kept as valkey.conf.prev; restart replica, fail back |
maxmemory, maxmemory-policy, activedefrag*, lazyfree-*, active-expire-effort | CONFIG SET | CONFIG SET back to the recorded value; immediate |
appendfsync, save, repl-diskless-*, repl-backlog-size | CONFIG SET | Revert at runtime; a backlog shrink drops history, so resize upward only under load |
dual-channel-replication-enabled | CONFIG SET, both sides | Disable on replica first, then primary; takes effect on the next full sync |
client-output-buffer-limit, tcp-backlog | CONFIG SET (backlog: restart) | Revert; check CLIENT LIST for disconnects during the window |
cluster-node-timeout, cluster-config-save-behavior | CONFIG SET | Revert on all nodes; never below the measured gossip RTT under load |
# Valkey 9.1.2 performance and scalability staged runtime change: verification before, validation after (replica first)
valkey-cli -h ${REPLICA_HOST} --user ${VALKEY_USER} --pass ${VALKEY_PASSWORD} CONFIG GET maxmemory-policy   # record current
valkey-cli -h ${REPLICA_HOST} --user ${VALKEY_USER} --pass ${VALKEY_PASSWORD} CONFIG SET maxmemory-policy allkeys-lfu
sleep 1800   # observation window: hit ratio, evicted_keys, p99 from INFO LATENCYSTATS
valkey-cli -h ${REPLICA_HOST} --user ${VALKEY_USER} --pass ${VALKEY_PASSWORD} CONFIG REWRITE                 # persist only after validation
Working with MinervaDB on Valkey consulting and support
Valkey consulting and support at MinervaDB covers the whole of this Valkey 9.1.2 performance and scalability guide as a service: an initial health check that reads every metric named above from your estate, a configuration review that produces the annotated valkey.conf for your workload with the measurement that justifies each line, the upgrade to 9.1.2 with the encoding and memory sampling done before and after, and 24×7 consultative support under our standard S1 to S4 commitments once the estate is in steady state. The same team operates Redis and Valkey for customers on self-managed hardware, Kubernetes and every major cloud, and will say plainly when a managed service is the better answer for you.
Companion reading: our teardown of what changed inside the engine in Valkey 9.1 performance, the Valkey auto-scaling patterns we use for variable workloads, and the Redis 8.10 performance and reliability analysis for teams still deciding between the two. The upstream release notes are at valkey-io/valkey on GitHub and the 9.1 announcement at valkey.io. As always: test every directive here against your own workload before applying it to production, change one thing at a time, and keep the persistence and replication posture under a tested restore before the first CONFIG SET.
Running this in production?
MinervaDB provides Redis Support and NoSQL Database Support with 24x7 coverage and a 15-minute S1 response. Talk to an engineer.