pg_upgrade, and an EXPLAIN ANALYZE that reports buffer activity by default. The 18.x minor releases then kept moving the planner underneath you: PostgreSQL 18.4 alone changed uniqueness assumptions for collatable columns, repaired join removal, and widened partition pruning. If your tuning runbook still assumes PostgreSQL 15 behaviour, you are leaving latency on the table.
This guide is the field manual MinervaDB engineers use when they are dropped into a production incident. It is deliberately practical: every technique below is paired with the exact SQL you run, the plan evidence you look for, and the decision you make afterwards. You also get six animated diagrams that show what the executor is actually doing, and seven premium diagnostic scripts you can paste straight into psql.
Key takeaways for optimizing SQLs in PostgreSQL 18.4
- Measure before you tune.
pg_stat_statementsranks the offenders;EXPLAIN (ANALYZE, BUFFERS, SETTINGS)explains them. In PostgreSQL 18.4,BUFFERSis on by default withANALYZE. - Most bad plans are bad estimates. Roughly four out of five plan regressions we triage are statistics problems, not missing indexes.
- Skip scan changes index design. Multicolumn B-trees are now usable when the leading column is unconstrained, so some of your redundant indexes are finally droppable.
- Asynchronous I/O changes scan economics. With
io_methodand a realisticeffective_io_concurrency, large scans are cheaper than your cost settings assume. - Rewrites beat hints. PostgreSQL has no plan hints in core, so SQL shape, statistics, and indexes are your levers.
1. What changed in PostgreSQL 18.4 that affects SQL optimization
Before you touch a single query, calibrate your mental model. The table below lists the PostgreSQL 18 features and PostgreSQL 18.4 fixes that most often change the outcome when you are optimizing SQLs in PostgreSQL 18.4, together with the action each one implies.| Change | Where it lands | What you should do |
|---|---|---|
Asynchronous I/O subsystem (io_method, io_workers, io_max_concurrency) |
Sequential scans, bitmap heap scans, VACUUM | Re-benchmark scan-heavy reporting SQL; consider io_uring on Linux builds that support it |
| B-tree skip scan | Multicolumn indexes with unconstrained leading columns | Audit for now-redundant single-column indexes you can drop |
Self-join elimination (enable_self_join_elimination) |
Planner rewrite stage | ORM-generated SQL gets shorter plans for free; keep the GUC on |
| BUFFERS on by default in EXPLAIN ANALYZE | Diagnostics | Update your runbooks and plan-diffing tooling to expect buffer lines |
| Index lookups per index scan node in EXPLAIN ANALYZE | Diagnostics | Use it to prove whether skip scan or a loose index scan is efficient |
| Statistics retained by pg_upgrade | Major version upgrades | No more post-upgrade plan chaos, but still run ANALYZE on hot tables |
| IN (VALUES ...) converted to = ANY (...) | Planner rewrite stage | Better selectivity estimates for generated IN lists |
DISTINCT key reordering (enable_distinct_reordering) |
Sort and aggregate planning | Some DISTINCT queries stop sorting entirely |
| PostgreSQL 18.4: collation-aware uniqueness check | Planner correctness | Queries on nondeterministic-collation columns may now pick different, correct plans |
| PostgreSQL 18.4: wider partition pruning and repaired join removal | Partitioned tables, outer joins | Re-check plans that previously failed to prune or raised FULL JOIN errors |
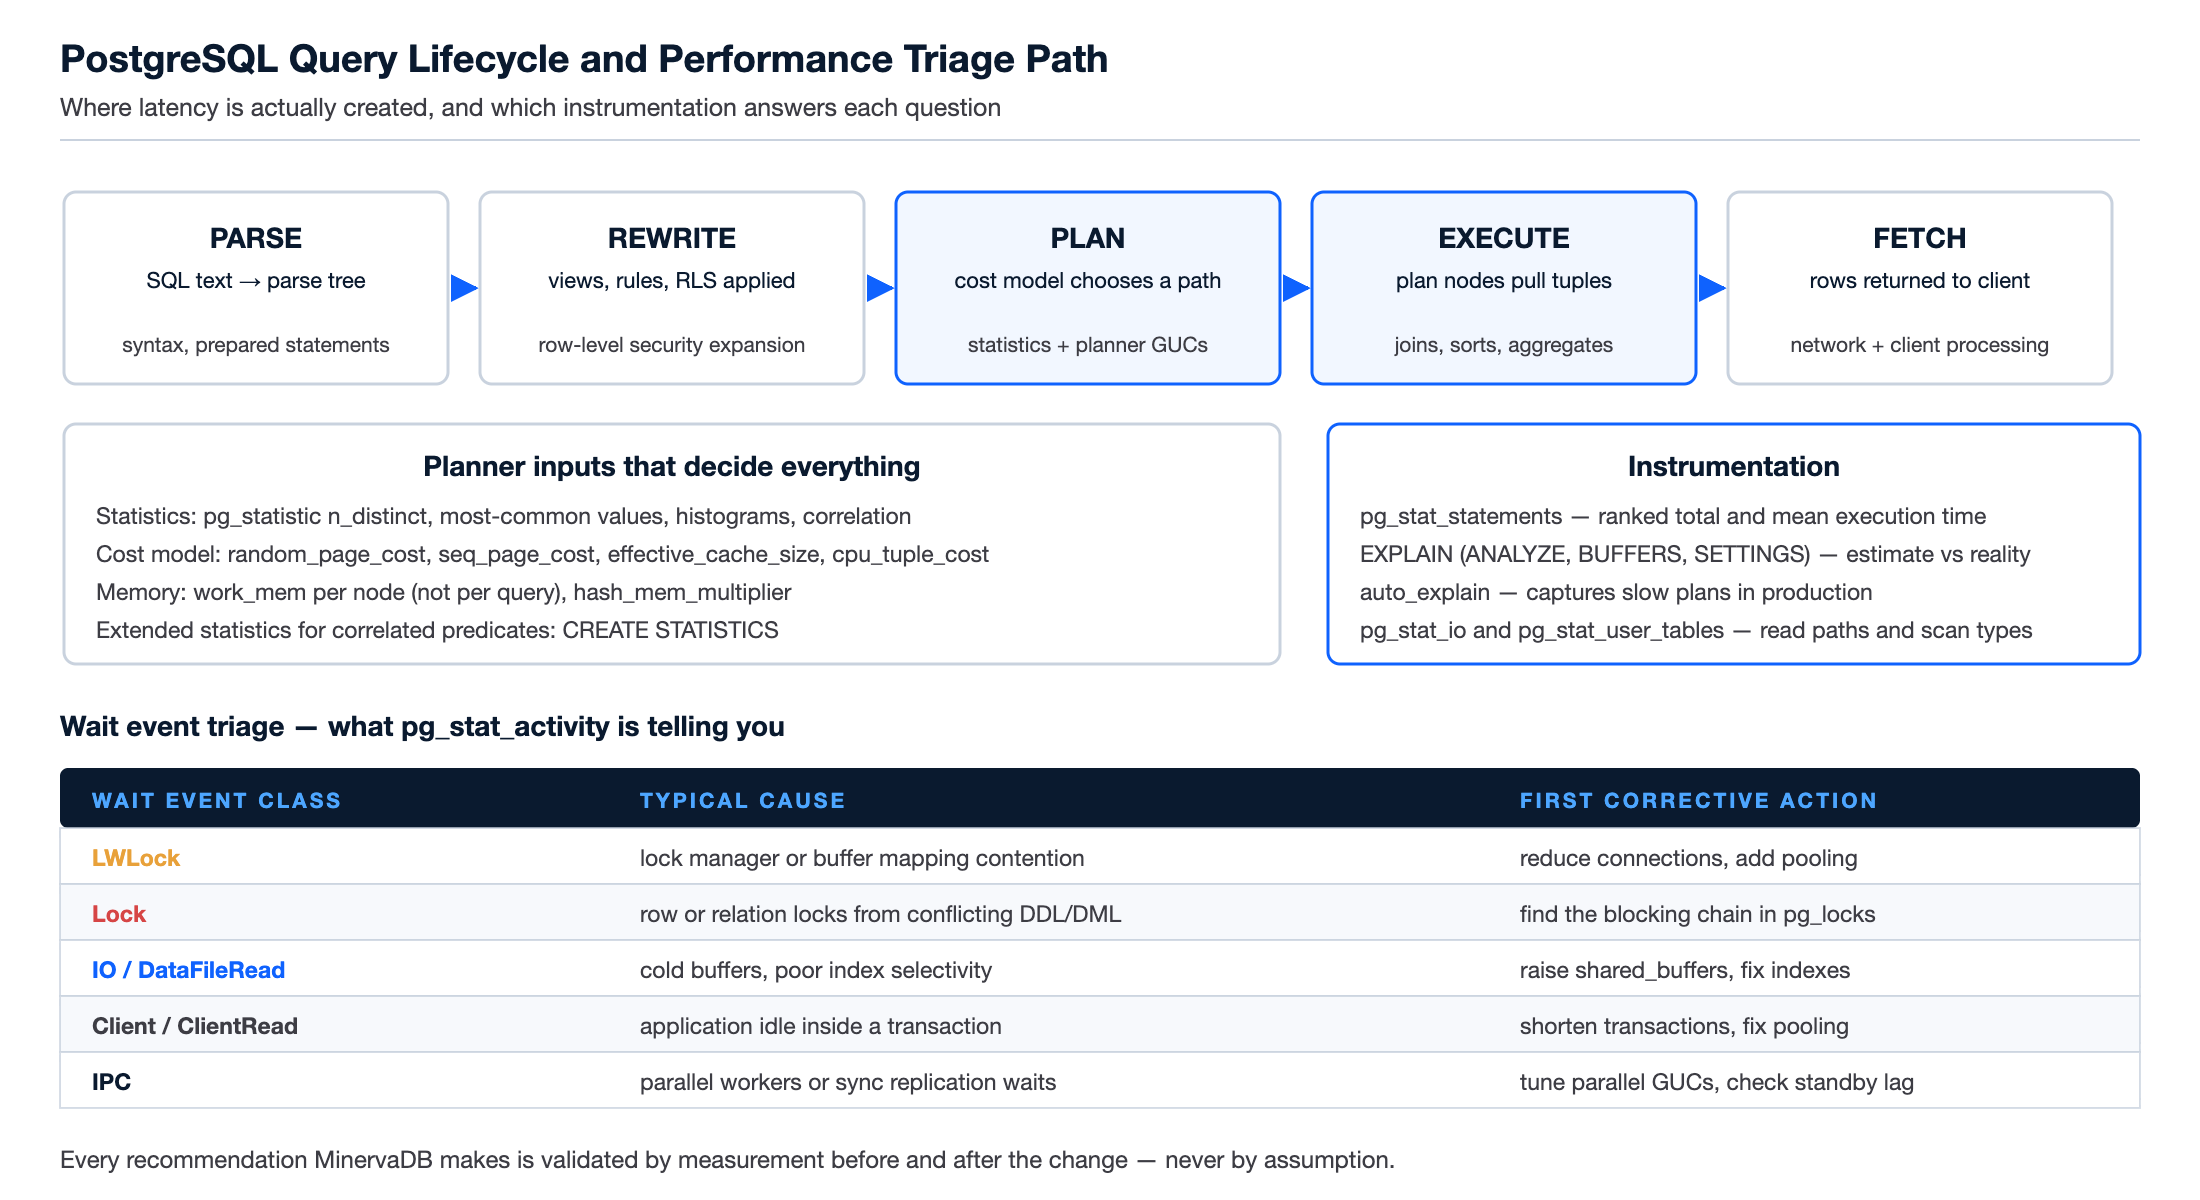
2. The PostgreSQL 18.4 query lifecycle: where latency actually comes from
Optimizing SQLs in PostgreSQL 18.4 starts with knowing which stage of the query lifecycle owns your latency. A statement that spends 40 ms planning and 3 ms executing needs a completely different fix from one that executes for 4 seconds because it read 900 MB of heap pages. The animation below walks a single statement through the five stages a backend performs.pg_stat_statements exposes total_plan_time and total_exec_time independently, and PostgreSQL 18.4 keeps that split for both top-level and nested statements when pg_stat_statements.track is set to all.
3. Reading EXPLAIN (ANALYZE, BUFFERS) in PostgreSQL 18.4
EXPLAIN is the only source of truth. In PostgreSQL 18.4, EXPLAIN ANALYZE includes buffer accounting automatically, reports fractional row estimates, marks disabled nodes explicitly, and tells you how many index lookups each index scan performed. That last addition is the single most useful diagnostic for skip scans and correlated subqueries.
The canonical invocation we use for optimizing SQLs in PostgreSQL 18.4:
-- Full-fidelity plan capture (PostgreSQL 18.4)
EXPLAIN (ANALYZE, VERBOSE, BUFFERS, WAL, SETTINGS, MEMORY, TIMING, COSTS, FORMAT TEXT)
SELECT o.order_id, o.placed_at, c.segment, sum(l.qty * l.unit_price) AS revenue
FROM   orders       o
JOIN   customers    c ON c.customer_id = o.customer_id
JOIN   order_lines  l ON l.order_id    = o.order_id
WHERE  o.tenant_id = 42
  AND  o.placed_at >= now() - interval '30 days'
  AND  c.segment    = 'ENTERPRISE'
GROUP  BY o.order_id, o.placed_at, c.segment
ORDER  BY revenue DESC
LIMIT  100;
The five numbers that decide your next move
- Estimated vs actual rows. A ratio worse than 10x on any node is a statistics problem. Fix estimates before touching indexes.
- Actual total time on the dominant node. Optimize the node that owns the time, not the node that looks ugly.
- Buffers: shared hit vs read. High
readmeans physical I/O; highhitwith slow timing means CPU-bound work such as filtering or sorting. - Index Searches. The PostgreSQL 18.4 per-node index lookup counter. Thousands of searches on one scan usually means a skip scan is degenerating or a loop is not being memoized.
- Sort Method and Memory.
external merge Diskmeanswork_memis too small for this query shape.
Limit  (cost=98421.55..98421.80 rows=100 width=52) (actual time=1841.7..1841.9 rows=100 loops=1)
  Buffers: shared hit=12894 read=61233
  ->  Sort  (cost=98421.55..98604.22 rows=73068 width=52) (actual time=1841.8..1849.2 rows=100 loops=1)
        Sort Key: (sum((l.qty * l.unit_price))) DESC
        Sort Method: top-N heapsort  Memory: 41kB
        ->  HashAggregate  (cost=... rows=73068 ...) (actual ... rows=73412 loops=1)
              Batches: 5  Memory Usage: 4249kB  Disk Usage: 21568kB      <-- spilling: raise work_mem
              ->  Hash Join  (cost=... rows=73068 ...) (actual ... rows=291877 loops=1)   <-- 4x underestimate
                    Hash Cond: (l.order_id = o.order_id)
                    ->  Seq Scan on order_lines l  (actual time=0.02..612.4 rows=8412990 loops=1)
                          Buffers: shared read=58712                      <-- no usable index, all physical reads
                    ->  Hash  (actual rows=73412 loops=1)
                          ->  Index Scan using orders_tenant_placed_idx on orders o
                                Index Cond: ((tenant_id = 42) AND (placed_at >= ...))
                                Index Searches: 1                          <-- healthy single descent
Planning Time: 0.412 ms
Execution Time: 1852.117 ms
Three defects are visible without any guessing: the hash aggregate spills to disk, the join cardinality is underestimated fourfold, and order_lines has no index supporting the join. That is the whole diagnosis. Our deep dive on troubleshooting slow PostgreSQL queries with EXPLAIN ANALYZE and pg_stat_statements walks through the same method on additional plan shapes, and the official Using EXPLAIN chapter documents every field.
4. How the PostgreSQL 18.4 cost model chooses a plan
PostgreSQL is a cost-based optimizer. It enumerates access paths and join orders, prices each one with a cost model built fromseq_page_cost, random_page_cost, cpu_tuple_cost, cpu_index_tuple_cost, cpu_operator_cost, parallel_setup_cost and parallel_tuple_cost, then keeps the cheapest. Cost units are relative and abstract; they are not milliseconds.
Cost settings that are wrong on most production clusters
random_page_cost= 4.0 is a 2005-era spinning-disk default. On NVMe or provisioned-IOPS cloud storage, 1.05 to 1.2 is realistic and it is the single highest-leverage cost change we make.effective_cache_sizeshould describe total usable cache, typically 60 to 75 percent of RAM. Too low and the planner rejects index scans it should love.work_memis per sort or hash node per worker, not per query. Raise it per session or per role for reporting SQL rather than globally.jit_above_costdefaults can trigger JIT on short OLTP statements that then spend more time compiling than executing.
EXPLAIN (SETTINGS) to prove which non-default settings were in effect for a captured plan; it is the fastest way to catch a session-level override that a connection pooler injected. See the query planning configuration reference for exact semantics.
5. PostgreSQL 18.4 indexing strategy: skip scans, covering and partial indexes
Indexing is where optimizing SQLs in PostgreSQL 18.4 diverges most sharply from older habits. PostgreSQL 18 taught the B-tree access method to perform skip scans, so a composite index can now serve queries that place no equality restriction on its leading column. Practically, an index on(tenant_id, placed_at) can answer a query filtered only on placed_at, provided tenant_id has low cardinality.
Index Searches counter is how you confirm it is working.Design rules we apply
- Order composite columns by selectivity and usage, not alphabetically. Equality predicates first, then range predicates, then columns needed only for ordering.
- Prefer one composite index over three single-column indexes. With skip scan, the composite index covers more query shapes, and you pay write amplification only once.
- Use
INCLUDEto buy index-only scans without inflating the ordered key. Verify withHeap Fetches: 0in the plan. - Partial indexes are free selectivity. A predicate such as
WHERE status <> 'ARCHIVED'can shrink an index by an order of magnitude. - Expression indexes must match the query expression exactly, including the collation and the immutability of the function.
- BRIN for append-only, physically correlated columns gives you 99 percent of the benefit at 1 percent of the size.
-- 1. Composite index that skip scan makes broadly useful
CREATE INDEX CONCURRENTLY orders_tenant_placed_idx
  ON orders (tenant_id, placed_at DESC);

-- 2. Covering index for an index-only scan (verify Heap Fetches: 0)
CREATE INDEX CONCURRENTLY orders_lookup_covering_idx
  ON orders (tenant_id, placed_at DESC)
  INCLUDE (status, total_amount);

-- 3. Partial index: index only the rows the application actually queries
CREATE INDEX CONCURRENTLY orders_open_idx
  ON orders (tenant_id, placed_at DESC)
  WHERE status IN ('NEW','PICKING','SHIPPED');

-- 4. Expression index matching a case-insensitive lookup
CREATE INDEX CONCURRENTLY customers_lower_email_idx
  ON customers (lower(email));

-- 5. BRIN for a 4 TB append-only fact table
CREATE INDEX CONCURRENTLY events_occurred_brin
  ON events USING brin (occurred_at) WITH (pages_per_range = 32);
Always build with CONCURRENTLY in production, and always validate afterwards, because a failed concurrent build leaves an INVALID index that the planner ignores while your writes still pay for it. Our guides on when and how to REINDEX, detecting and fixing index bloat with REINDEX CONCURRENTLY, and rogue index troubleshooting cover the maintenance side. For index type selection, the index types documentation and the index-only scans chapter are the primary sources.
6. Statistics: the root cause of most bad PostgreSQL 18.4 plans
If you remember one thing about optimizing SQLs in PostgreSQL 18.4, remember this: the planner is usually right about cost and wrong about cardinality. Bad cardinality estimates produce bad plans no matter how good your indexes are. There are four estimation failures we see repeatedly.6.1 Stale statistics
High-churn tables outrunautovacuum_analyze_scale_factor. Set per-table overrides on your hottest relations rather than lowering the global value.
ALTER TABLE orders SET (autovacuum_analyze_scale_factor = 0.02,
                        autovacuum_analyze_threshold    = 5000);
6.2 Insufficient histogram resolution
The defaultdefault_statistics_target of 100 is thin for skewed, high-cardinality columns. Raise it per column, not globally.
ALTER TABLE orders ALTER COLUMN tenant_id SET STATISTICS 1000;
ANALYZE orders (tenant_id);
6.3 Correlated columns
PostgreSQL assumes independence between predicates. Whencity and postal_code are correlated, a two-predicate filter is underestimated by the product of the selectivities. Extended statistics fix this.
CREATE STATISTICS addresses_city_zip_stx (dependencies, ndistinct, mcv)
  ON city, postal_code FROM addresses;
ANALYZE addresses;
6.4 Expressions the planner cannot estimate
A predicate such asWHERE date_trunc('month', placed_at) = date '2026-08-01' gets a hard-coded guess. Either rewrite it as a range predicate or create matching extended statistics on the expression.
The planner statistics chapter and CREATE STATISTICS reference document the estimators. For partitioned workloads, see our case study on how ANALYZE on partitioned tables fixed a slow query, and for the maintenance layer, diagnosing autovacuum lag and table bloat.
7. Join strategy tuning and self-join elimination
PostgreSQL has exactly three physical join methods, and every join performance problem is a mismatch between the method chosen and the true cardinality of the inputs. The animation below shows the mechanics of each one.Diagnosing the wrong join method
- Nested Loop with huge
loops=and no index on the inner side. Classic symptom of a cardinality underestimate. Fix statistics; add the inner index; only then consider disabling the method for a session to confirm your hypothesis. - Hash Join spilling to
Batches: > 1. The hash table did not fit inwork_mem. Raisework_memfor that workload or reduce the build side with an earlier filter. - Merge Join preceded by two explicit sorts. Usually a sign that the ordering could come from an index instead.
- Memoize node absent where it would help. Verify
enable_memoizeand check that the inner side has goodn_distinctstatistics.
-- Hypothesis test only. Revert immediately after measuring.
SET LOCAL enable_nestloop = off;
EXPLAIN (ANALYZE, BUFFERS) SELECT ...;
RESET enable_nestloop;

-- PostgreSQL 18 planner rewrites you can toggle for A/B comparison
SHOW enable_self_join_elimination;   -- default on
SHOW enable_distinct_reordering;     -- default on
PostgreSQL 18 also removes provably unnecessary table self-joins automatically. ORM-generated SQL and heavily layered views benefit the most: plans get shorter, estimates get better, and PostgreSQL 18.4 specifically repaired a case where a self-join on a bare boolean column raised an error. If your application generates that pattern, retest it on PostgreSQL 18.4.
8. Asynchronous I/O and the new economics of scans
The asynchronous I/O subsystem is the headline performance feature of PostgreSQL 18, and it changes how you should think about optimizing SQLs in PostgreSQL 18.4 for analytical workloads. A backend can now queue many read requests instead of blocking on one at a time, which makes sequential scans, bitmap heap scans and VACUUM materially faster on cloud storage with high latency and high parallelism.Settings to review on PostgreSQL 18.4
SELECT name, setting, unit, boot_val, source
FROM   pg_settings
WHERE  name IN ('io_method','io_workers','io_max_concurrency',
                'io_combine_limit','io_max_combine_limit',
                'effective_io_concurrency','maintenance_io_concurrency',
                'random_page_cost','seq_page_cost','effective_cache_size',
                'work_mem','max_parallel_workers_per_gather','jit',
                'jit_above_cost','enable_self_join_elimination')
ORDER  BY name;
io_methoddefaults toworker. On Linux builds compiled with liburing,io_uringremoves the worker hand-off and is usually faster for scan-heavy analytics.effective_io_concurrencyandmaintenance_io_concurrencynow default to 16, which is realistic for NVMe and cloud block storage.io_combine_limitis capped byio_max_combine_limit, which is start-up only. Raise both if you want larger combined reads.- Validate the effect with
pg_stat_io, which in PostgreSQL 18.4 reportsread_bytes,write_bytesandextend_bytesinstead of a fixed block size.
9. Parallel query and JIT: when they help, when they hurt
Parallel query is a throughput feature that costs latency at low concurrency and costs throughput at high concurrency. On an OLTP cluster running 4000 transactions per second, aggressive parallelism starves the pool. On a nightly batch window it is exactly what you want.- Right-size
max_parallel_workers_per_gatherper workload, using role-level or session-level settings rather than one global value. - Watch the PostgreSQL 18.4
pg_stat_statementscolumnsparallel_workers_to_launchandparallel_workers_launched. A persistent gap means your statements plan for parallelism they never get, which is the worst of both worlds. - Set
parallel_leader_participationdeliberately. Leaving the leader in the plan helps small parallel scans and hurts long ones. - JIT is for long analytical statements only. If
jit_generation_timeplusjit_optimization_timeis a meaningful fraction oftotal_exec_time, raisejit_above_costor disable JIT for that role.
-- JIT overhead audit (PostgreSQL 18.4)
SELECT substring(query, 1, 70) AS statement,
       calls,
       round(total_exec_time::numeric, 1)                          AS exec_ms,
       round((jit_generation_time + jit_optimization_time
              + jit_inlining_time + jit_emission_time)::numeric, 1) AS jit_ms,
       round(100 * (jit_generation_time + jit_optimization_time
              + jit_inlining_time + jit_emission_time)
             / nullif(total_exec_time, 0), 1)                       AS jit_pct
FROM   pg_stat_statements
WHERE  jit_functions > 0
ORDER  BY jit_ms DESC
LIMIT  20;
Reference material: Parallel Query and Just-in-Time Compilation.
10. SQL rewrites that unlock better PostgreSQL 18.4 plans
PostgreSQL core has no plan hints. That constraint is a gift: it forces you to fix the real problem. These are the rewrites that pay off most often when we are optimizing SQLs in PostgreSQL 18.4 for clients.10.1 Make predicates sargable
-- Before: function on the column defeats the index and the estimator
SELECT * FROM orders
WHERE  date_trunc('day', placed_at) = date '2026-08-11';

-- After: half-open range predicate, index friendly and correctly estimated
SELECT * FROM orders
WHERE  placed_at >= date '2026-08-11'
  AND  placed_at <  date '2026-08-11' + interval '1 day';
10.2 Replace NOT IN with NOT EXISTS
NOT IN against a nullable subquery column cannot be turned into an anti-join and produces a correlated filter with surprising NULL semantics. NOT EXISTS is both faster and safer.
-- Before
SELECT c.* FROM customers c
WHERE  c.customer_id NOT IN (SELECT o.customer_id FROM orders o);

-- After: planner produces an Anti Join
SELECT c.* FROM customers c
WHERE  NOT EXISTS (SELECT 1 FROM orders o WHERE o.customer_id = c.customer_id);
10.3 Break up OR predicates that block index usage
-- Before: one OR across two different columns often forces a seq scan
SELECT * FROM tickets WHERE assignee_id = 91 OR reporter_id = 91;

-- After: two index scans combined, duplicates removed once
SELECT * FROM tickets WHERE assignee_id = 91
UNION
SELECT * FROM tickets WHERE reporter_id = 91;
10.4 Use keyset pagination instead of large OFFSET
OFFSET 500000 still reads and discards 500,000 rows. Keyset pagination is O(1) per page.
-- Before
SELECT order_id, placed_at FROM orders
WHERE tenant_id = 42 ORDER BY placed_at DESC, order_id DESC
OFFSET 500000 LIMIT 50;

-- After: seek by the last row of the previous page
SELECT order_id, placed_at FROM orders
WHERE  tenant_id = 42
  AND  (placed_at, order_id) < ('2026-08-01 09:14:22+00', 8891245)
ORDER  BY placed_at DESC, order_id DESC
LIMIT  50;
10.5 Control CTE materialization deliberately
Since PostgreSQL 12 a CTE referenced once is inlined, but a CTE referenced twice is still materialized. Say what you mean.WITH recent AS NOT MATERIALIZED ( SELECT * FROM orders WHERE placed_at >= now() - interval '7 days' ) SELECT r.tenant_id, count(*) FROM recent r GROUP BY r.tenant_id; -- Force materialization when the CTE is expensive and reused WITH heavy AS MATERIALIZED ( SELECT tenant_id, sum(total_amount) AS revenue FROM orders GROUP BY tenant_id ) SELECT a.tenant_id, a.revenue, b.revenue AS peer_revenue FROM heavy a JOIN heavy b ON b.tenant_id <> a.tenant_id;
10.6 Replace self-joins with window functions
-- Before: correlated subquery per row
SELECT o.*, (SELECT max(o2.placed_at) FROM orders o2
             WHERE o2.customer_id = o.customer_id) AS last_order
FROM   orders o;

-- After: one pass
SELECT o.*, max(o.placed_at) OVER (PARTITION BY o.customer_id) AS last_order
FROM   orders o;
10.7 Use LATERAL for top-N-per-group
SELECT c.customer_id, c.name, o.order_id, o.placed_at
FROM   customers c
CROSS JOIN LATERAL (
  SELECT o.order_id, o.placed_at
  FROM   orders o
  WHERE  o.customer_id = c.customer_id
  ORDER  BY o.placed_at DESC
  LIMIT  3
) o
WHERE  c.segment = 'ENTERPRISE';
10.8 Batch large DML instead of one giant statement
A single 40 million rowUPDATE holds locks, bloats the table and produces a WAL spike. Chunk it. Our note on how to do UPDATE with LIMIT in PostgreSQL shows the standard-SQL-safe pattern, and resolving lock contention with pg_locks explains what to watch while it runs.
11. Partition pruning improvements in PostgreSQL 18.4
Partitioning only helps when pruning works. PostgreSQL 18.4 improved the planner match between partition key columns and sub-query outputs by stripping no-op placeholder expressions, which enables pruning in cases that previously scanned every partition. If you have a partitioned fact table behind a view or a sub-select, re-capture those plans on PostgreSQL 18.4 before assuming your old workarounds are still needed.Rules for prunable partitioned SQL
- Always filter on the partition key with a directly comparable constant or parameter. Wrapping the key in a function blocks pruning.
- Beware of implicit casts.
timestamptzversustimestampcomparisons can silently prevent pruning. - Check for runtime pruning, not just plan-time pruning. Look for
Subplans Removed:in theEXPLAIN ANALYZEoutput of parameterized statements. - Keep partition counts sane. Thousands of partitions inflate planning time; that shows up as
total_plan_timeinpg_stat_statements, not as execution time. - ANALYZE the parent as well as the children. Partitioned parents do not inherit statistics automatically from autovacuum in every case.
-- Prove pruning: expect a small number of partitions and Subplans Removed
EXPLAIN (ANALYZE, BUFFERS, SETTINGS)
SELECT sum(amount) FROM events_p
WHERE  occurred_at >= date_trunc('month', now())
  AND  occurred_at <  date_trunc('month', now()) + interval '1 month';

-- Planning-time cost of too many partitions
SELECT relname, count(*) AS partitions
FROM   pg_class c
JOIN   pg_inherits i ON i.inhrelid = c.oid
JOIN   pg_class p ON p.oid = i.inhparent
JOIN   LATERAL (SELECT p.relname) x ON true
GROUP  BY relname ORDER BY partitions DESC LIMIT 10;
Details are in the table partitioning documentation.
12. Seven premium scripts for PostgreSQL 18.4 SQL tuning
These are the scripts our consultants actually run. They assumepg_stat_statements is loaded via shared_preload_libraries, track_io_timing is on, and the connecting role holds pg_read_all_stats. Run them in order: rank the workload, find the structural defects, fix the estimates, then verify.
Before you start: CREATE EXTENSION IF NOT EXISTS pg_stat_statements; and confirm SHOW shared_preload_libraries; includes it. Also consider pg_buffercache and pgstattuple for the deeper audits.
Script 1 — MinervaDB Top SQL ranker for PostgreSQL 18.4
Ranks the workload by total execution time and enriches every row with the derived metrics that tell you why a statement is expensive: cache hit ratio, latency tail, temp spill, WAL volume, JIT overhead and the PostgreSQL 18.4 parallel worker deficit.-- minervadb_top_sql_184.sql
WITH raw AS (
SELECT queryid, toplevel, query, calls, rows,
total_exec_time, mean_exec_time, stddev_exec_time,
total_plan_time, shared_blks_hit, shared_blks_read,
temp_blks_read, temp_blks_written,
shared_blk_read_time, shared_blk_write_time,
wal_bytes, wal_buffers_full,
jit_functions, jit_generation_time, jit_optimization_time,
jit_inlining_time, jit_emission_time,
parallel_workers_to_launch, parallel_workers_launched
FROM pg_stat_statements
WHERE dbid = (SELECT oid FROM pg_database WHERE datname = current_database())
)
SELECT round(100 * total_exec_time / nullif(sum(total_exec_time) OVER (), 0), 2)
AS pct_of_workload,
calls,
round(mean_exec_time::numeric, 2) AS mean_ms,
round((mean_exec_time + 2 * stddev_exec_time)::numeric, 2) AS tail_ms,
round(total_exec_time::numeric / 1000, 1) AS total_s,
round(total_plan_time::numeric / 1000, 1) AS plan_s,
round(rows::numeric / nullif(calls, 0), 1) AS rows_per_call,
round(100.0 * shared_blks_hit
/ nullif(shared_blks_hit + shared_blks_read, 0), 2) AS cache_hit_pct,
pg_size_pretty((shared_blks_read * 8192)::bigint) AS heap_read,
pg_size_pretty(((temp_blks_read + temp_blks_written) * 8192)::bigint) AS temp_io,
pg_size_pretty(wal_bytes::bigint) AS wal,
wal_buffers_full,
round((jit_generation_time + jit_optimization_time
+ jit_inlining_time + jit_emission_time)::numeric, 1) AS jit_ms,
parallel_workers_to_launch - parallel_workers_launched AS worker_deficit,
left(regexp_replace(query, '\s+', ' ', 'g'), 140) AS statement
FROM raw
WHERE toplevel
AND calls > 5
ORDER BY total_exec_time DESC
LIMIT 25;
Script 2 — Structural defect finder: sequential scan pressure
Finds large tables that are being read sequentially at scale. Every row here is either a missing index, a non-sargable predicate, or a legitimate analytical scan you should push to a replica.-- minervadb_seqscan_pressure.sql
SELECT s.schemaname,
s.relname,
s.seq_scan,
s.last_seq_scan,
s.idx_scan,
s.seq_tup_read,
(s.seq_tup_read / nullif(s.seq_scan, 0)) AS avg_rows_per_scan,
pg_size_pretty(pg_total_relation_size(s.relid)) AS total_size,
s.n_live_tup,
s.n_dead_tup,
round(100.0 * s.n_dead_tup
/ nullif(s.n_live_tup + s.n_dead_tup, 0), 1) AS dead_pct,
round((s.total_autovacuum_time / 1000.0)::numeric, 1) AS autovac_s,
round((s.total_autoanalyze_time / 1000.0)::numeric, 1) AS autoanalyze_s
FROM pg_stat_user_tables s
WHERE s.seq_scan > 0
AND pg_total_relation_size(s.relid) > 64 * 1024 * 1024
AND (s.seq_tup_read / nullif(s.seq_scan, 0)) > 10000
ORDER BY s.seq_tup_read DESC
LIMIT 25;
Script 3 — Index efficiency and skip-scan redundancy audit
Two-part audit. Part A lists indexes nobody uses. Part B lists B-tree indexes whose key list is a strict prefix of another index on the same table — the exact category that PostgreSQL 18 skip scan makes safe to drop.-- minervadb_index_audit_184.sql
-- Part A: unused, non-constraint indexes larger than 8 MB
SELECT s.schemaname, s.relname AS table_name, s.indexrelname AS index_name,
s.idx_scan, s.last_idx_scan,
pg_size_pretty(pg_relation_size(s.indexrelid)) AS index_size,
format('DROP INDEX CONCURRENTLY %I.%I;', s.schemaname, s.indexrelname) AS suggestion
FROM pg_stat_user_indexes s
JOIN pg_index i ON i.indexrelid = s.indexrelid
WHERE s.idx_scan = 0
AND NOT i.indisunique
AND NOT i.indisprimary
AND pg_relation_size(s.indexrelid) > 8 * 1024 * 1024
ORDER BY pg_relation_size(s.indexrelid) DESC;
-- Part B: prefix-redundant B-tree indexes (skip-scan aware)
WITH idx AS (
SELECT i.indexrelid, i.indrelid, i.indisunique,
n.nspname AS schema_name, t.relname AS table_name, c.relname AS index_name,
am.amname, i.indpred IS NOT NULL AS is_partial,
i.indexprs IS NOT NULL AS has_expr,
pg_relation_size(i.indexrelid) AS bytes,
(SELECT array_agg(a.attname ORDER BY k.ord)
FROM unnest(string_to_array(i.indkey::text, ' ')::int[])
WITH ORDINALITY AS k(attnum, ord)
JOIN pg_attribute a
ON a.attrelid = i.indrelid AND a.attnum = k.attnum
WHERE k.ord <= i.indnkeyatts) AS key_cols
FROM pg_index i
JOIN pg_class c ON c.oid = i.indexrelid
JOIN pg_class t ON t.oid = i.indrelid
JOIN pg_namespace n ON n.oid = t.relnamespace
JOIN pg_am am ON am.oid = c.relam
WHERE n.nspname NOT IN ('pg_catalog', 'information_schema')
)
SELECT a.schema_name, a.table_name,
a.index_name AS redundant_index,
a.key_cols AS redundant_keys,
b.index_name AS covering_index,
b.key_cols AS covering_keys,
pg_size_pretty(a.bytes) AS reclaimable,
format('DROP INDEX CONCURRENTLY %I.%I;', a.schema_name, a.index_name) AS suggestion
FROM idx a
JOIN idx b
ON a.indrelid = b.indrelid
AND a.indexrelid <> b.indexrelid
AND a.amname = 'btree' AND b.amname = 'btree'
AND NOT a.is_partial AND NOT b.is_partial
AND NOT a.has_expr AND NOT b.has_expr
AND NOT a.indisunique
AND array_length(b.key_cols, 1) > array_length(a.key_cols, 1)
AND b.key_cols[1:array_length(a.key_cols, 1)] = a.key_cols
ORDER BY a.bytes DESC;
Script 4 — Statistics health check and extended statistics generator
Part A finds tables whose statistics have drifted. Part B emits ready-to-runCREATE STATISTICS DDL for every multicolumn B-tree index that has no matching extended statistics object, which is the cheapest way to eliminate correlated-predicate underestimates at scale.
-- minervadb_stats_health.sql
-- Part A: statistics drift
SELECT schemaname, relname, n_live_tup, n_mod_since_analyze,
       round(100.0 * n_mod_since_analyze / nullif(n_live_tup, 0), 1) AS churn_pct,
       last_analyze, last_autoanalyze,
       format('ANALYZE %I.%I;', schemaname, relname) AS suggestion
FROM   pg_stat_user_tables
WHERE  n_mod_since_analyze > greatest(1000, n_live_tup * 0.05)
ORDER  BY n_mod_since_analyze DESC
LIMIT  30;

-- Part B: generate extended statistics for correlated column groups
WITH cand AS (
  SELECT n.nspname AS sch, t.relname AS tbl, i.indrelid,
         (SELECT array_agg(a.attname ORDER BY k.ord)
            FROM   unnest(string_to_array(i.indkey::text, ' ')::int[])
                     WITH ORDINALITY AS k(attnum, ord)
            JOIN   pg_attribute a
                     ON a.attrelid = i.indrelid AND a.attnum = k.attnum
           WHERE   k.ord <= i.indnkeyatts) AS cols
  FROM   pg_index i
  JOIN   pg_class t     ON t.oid = i.indrelid
  JOIN   pg_namespace n ON n.oid = t.relnamespace
  WHERE  i.indnkeyatts BETWEEN 2 AND 4
    AND  i.indpred   IS NULL
    AND  i.indexprs  IS NULL
    AND  n.nspname NOT IN ('pg_catalog', 'information_schema')
)
SELECT DISTINCT
       format('CREATE STATISTICS IF NOT EXISTS %I.%I (dependencies, ndistinct, mcv) ON %s FROM %I.%I;',
              c.sch,
              left('stx_' || c.tbl || '_' || array_to_string(c.cols, '_'), 63),
              array_to_string(c.cols, ', '),
              c.sch, c.tbl) AS ddl
FROM   cand c
WHERE  c.cols IS NOT NULL
  AND  NOT EXISTS (SELECT 1
                   FROM   pg_statistic_ext e
                   WHERE  e.stxrelid = c.indrelid)
ORDER  BY 1;
Script 5 — Plan capture and regression harness
Stores every captured plan as JSON so you can diff plan shape and execution time across releases, deploys and statistics refreshes. This is how you prove a tuning change worked instead of hoping it did.-- minervadb_plan_harness.sql
CREATE SCHEMA IF NOT EXISTS minervadb;
CREATE TABLE IF NOT EXISTS minervadb.plan_history (
id bigserial PRIMARY KEY,
captured_at timestamptz NOT NULL DEFAULT now(),
label text NOT NULL,
pg_version text NOT NULL DEFAULT current_setting('server_version'),
plan jsonb NOT NULL,
total_cost numeric GENERATED ALWAYS AS
(((plan -> 0 -> 'Plan') ->> 'Total Cost')::numeric) STORED,
exec_ms numeric GENERATED ALWAYS AS
(((plan -> 0) ->> 'Execution Time')::numeric) STORED,
plan_ms numeric GENERATED ALWAYS AS
(((plan -> 0) ->> 'Planning Time')::numeric) STORED,
root_node text GENERATED ALWAYS AS
(((plan -> 0 -> 'Plan') ->> 'Node Type')) STORED
);
CREATE OR REPLACE FUNCTION minervadb.capture_plan(p_label text, p_sql text)
RETURNS bigint LANGUAGE plpgsql AS $fn$
DECLARE
v_plan jsonb;
v_id bigint;
BEGIN
EXECUTE 'EXPLAIN (ANALYZE, BUFFERS, VERBOSE, SETTINGS, FORMAT JSON) ' || p_sql
INTO v_plan;
INSERT INTO minervadb.plan_history (label, plan)
VALUES (p_label, v_plan)
RETURNING id INTO v_id;
RETURN v_id;
END;
$fn$;
-- Usage
SELECT minervadb.capture_plan('orders_revenue_top100', $q$
SELECT o.order_id, sum(l.qty * l.unit_price) AS revenue
FROM orders o JOIN order_lines l ON l.order_id = o.order_id
WHERE o.tenant_id = 42
GROUP BY o.order_id ORDER BY revenue DESC LIMIT 100
$q$);
-- Regression report: latest vs previous capture per label
SELECT label, pg_version, root_node, captured_at,
exec_ms,
exec_ms - lag(exec_ms) OVER (PARTITION BY label ORDER BY captured_at) AS delta_ms,
total_cost,
root_node IS DISTINCT FROM
lag(root_node) OVER (PARTITION BY label ORDER BY captured_at) AS plan_shape_changed
FROM minervadb.plan_history
ORDER BY label, captured_at DESC;
Script 6 — Asynchronous I/O effectiveness report
Confirms that the PostgreSQL 18.4 I/O subsystem is actually doing work for you, and exposes per-read latency by backend type and context. Requirestrack_io_timing = on.
-- minervadb_aio_report.sql
SELECT current_setting('io_method')               AS io_method,
       current_setting('io_workers')              AS io_workers,
       current_setting('io_combine_limit')        AS io_combine_limit,
       current_setting('effective_io_concurrency') AS eff_io_conc;

SELECT backend_type, object, context,
       reads,
       pg_size_pretty(read_bytes)                            AS read_volume,
       round(read_time::numeric, 1)                          AS read_ms,
       round((read_time / nullif(reads, 0))::numeric, 3)     AS ms_per_read,
       writes,
       pg_size_pretty(write_bytes)                           AS write_volume,
       hits,
       evictions,
       round(100.0 * hits / nullif(hits + reads, 0), 2)      AS hit_pct
FROM   pg_stat_io
WHERE  reads > 0 OR writes > 0
ORDER  BY read_time DESC NULLS LAST;
Script 7 — Workload delta snapshots
pg_stat_statements is cumulative, which hides intraday regressions. Snapshot it on a schedule and diff two points in time to see what changed during the incident window rather than since the last restart.
-- minervadb_pgss_delta.sql
CREATE SCHEMA IF NOT EXISTS minervadb;

CREATE TABLE IF NOT EXISTS minervadb.pgss_snapshot AS
  SELECT now() AS snap_at, * FROM pg_stat_statements WITH NO DATA;

CREATE INDEX IF NOT EXISTS pgss_snapshot_snap_at_idx
  ON minervadb.pgss_snapshot (snap_at);

-- Run from cron or pg_cron every 5 minutes
INSERT INTO minervadb.pgss_snapshot
SELECT now(), * FROM pg_stat_statements;

-- Diff the two most recent snapshots
WITH bounds AS (
  SELECT max(snap_at) AS t2,
         max(snap_at) FILTER (WHERE snap_at < (SELECT max(snap_at)
                                               FROM minervadb.pgss_snapshot)) AS t1
  FROM   minervadb.pgss_snapshot
),
b AS (SELECT s.* FROM minervadb.pgss_snapshot s, bounds WHERE s.snap_at = bounds.t1),
e AS (SELECT s.* FROM minervadb.pgss_snapshot s, bounds WHERE s.snap_at = bounds.t2)
SELECT e.queryid,
       e.calls - coalesce(b.calls, 0)                                   AS calls_delta,
       round((e.total_exec_time - coalesce(b.total_exec_time, 0))::numeric / 1000, 2) AS exec_s_delta,
       round(((e.total_exec_time - coalesce(b.total_exec_time, 0))
              / nullif(e.calls - coalesce(b.calls, 0), 0))::numeric, 3) AS mean_ms_in_window,
       (e.shared_blks_read - coalesce(b.shared_blks_read, 0))           AS blks_read_delta,
       (e.temp_blks_written - coalesce(b.temp_blks_written, 0))         AS temp_written_delta,
       left(regexp_replace(e.query, '\s+', ' ', 'g'), 120)               AS statement
FROM   e LEFT JOIN b USING (queryid, userid, dbid, toplevel)
WHERE  e.calls - coalesce(b.calls, 0) > 0
ORDER  BY exec_s_delta DESC
LIMIT  25;
If you would rather not build this yourself, our wait event analysis guide pairs these scripts with pg_stat_activity sampling, and PgBouncer connection pooling covers the connection layer that so often masquerades as slow SQL.
13. The MinervaDB PostgreSQL 18.4 optimization playbook
Tuning is a loop, not a project. This is the cadence we install at client sites so that optimizing SQLs in PostgreSQL 18.4 becomes routine engineering instead of firefighting.A realistic first two weeks
- Days 1–2: enable
pg_stat_statementsandtrack_io_timing, deploy Script 7 snapshots, setlog_min_duration_statementto a value that captures the top 1 percent of statements. - Days 3–4: run Scripts 1, 2 and 6. Produce a ranked list of the ten statements that own 80 percent of database time.
- Days 5–7: capture plans for all ten with Script 5. Classify each as estimation, indexing, I/O, memory or SQL-shape.
- Week 2: fix estimates first with Script 4, then indexes with Script 3, then rewrites from section 10. One change at a time, with a before-and-after plan capture for each.
- Ongoing: a weekly 30-minute review of the Script 7 delta report. This is what stops regressions from becoming outages.
14. PostgreSQL 18.4 anti-patterns to eliminate
| Anti-pattern | Why it hurts | Fix |
|---|---|---|
SELECT * in application code |
Blocks index-only scans, inflates network and TOAST reads | Project only the columns you use |
Global work_mem increase to stop one query spilling |
Multiplies by nodes and workers; risks OOM | Set per role or per session for that workload |
Leaving enable_nestloop = off in postgresql.conf |
Cripples every OLTP lookup on the cluster | Use only as a session-scoped hypothesis test |
| Indexing every column mentioned in a WHERE clause | Write amplification, bloat, longer VACUUM | Composite plus partial indexes, then audit with Script 3 |
Tuning from EXPLAIN without ANALYZE |
You see estimates, never reality | Always capture actual rows, timing and buffers |
| Running reports on the primary during peak | Buffer cache eviction and I/O contention | Route to a read replica with its own cost settings |
Very high max_connections instead of pooling |
Context switching and lock contention look like slow SQL | Use PgBouncer in transaction pooling mode |
| Ignoring bloat while tuning queries | A bloated heap makes every scan read dead space | Tune autovacuum first, then re-measure |
15. Frequently asked questions
Is optimizing SQLs in PostgreSQL 18.4 different from PostgreSQL 17?
Yes, in three concrete ways. B-tree skip scans make composite indexes useful for more query shapes, the asynchronous I/O subsystem changes the real cost of large scans, andEXPLAIN ANALYZE now reports buffers and per-node index searches by default. The method stays the same; the evidence you collect and the conclusions you draw both change.
Does PostgreSQL 18.4 support query hints?
Not in core. You influence the planner through statistics, indexes, SQL shape and cost settings. Theenable_* GUCs exist for diagnosis, not production. Third-party extensions such as pg_hint_plan exist, but we treat them as a last resort because they freeze decisions that should adapt to changing data.
Why is my query slower after upgrading to PostgreSQL 18?
Start by comparing plans, not settings. Because 18 retains optimizer statistics throughpg_upgrade, the usual post-upgrade cause is a genuine planner behaviour change: self-join elimination, DISTINCT reordering, skip scan preference, or on PostgreSQL 18.4 the stricter collation-aware uniqueness check. Capture the old and new plans with Script 5 and the difference will be obvious in the node types.
How do I know whether a skip scan is actually helping?
Look at theIndex Searches line that PostgreSQL 18.4 adds to each index scan node in EXPLAIN ANALYZE. A handful of searches means the skip scan is descending once per distinct prefix value and working as designed. Thousands of searches means the leading column has too many distinct values and you need a dedicated index.
What is the single highest-impact setting change for SQL performance?
On modern storage, loweringrandom_page_cost to roughly 1.1 while setting effective_cache_size to 60–75 percent of RAM. Together they stop the planner from rejecting index scans that are in fact cheap. Always validate with plan captures before and after.
How much of a workload should one statement own before I tune it?
If a single normalized statement owns more than 10 percent of total database time in the Script 1 output, it is worth a dedicated tuning session. Below 2 percent, you will usually get more benefit from schema or index consolidation than from tuning that individual statement.Do I still need autovacuum tuning if my SQL is optimized?
Absolutely. Bloat inflates every scan and every index, so a perfectly written statement on a 40 percent bloated table still reads dead space. Treat autovacuum tuning as a prerequisite, not an afterthought.Conclusion: make optimization a habit, not an event
Optimizing SQLs in PostgreSQL 18.4 comes down to a repeatable loop: rank the workload by time, capture real plans with buffers, fix the estimate before you fix the index, change one thing, and verify with a recorded plan. PostgreSQL 18 gave you better tools for every one of those steps — skip scans, asynchronous I/O, richerEXPLAIN output, statistics that survive upgrades — and PostgreSQL 18.4 quietly improved planner correctness around collations, join removal and partition pruning. The teams that win are the ones that measure continuously rather than heroically.
Need help optimizing SQLs in PostgreSQL 18.4 at scale?
MinervaDB runs 24x7 consultative support, performance audits and custom engineering for PostgreSQL fleets from single instances to multi-region clusters. We will bring the scripts above, the plan history, and the accountability.
Further reading from MinervaDB
- Troubleshooting slow PostgreSQL queries with EXPLAIN ANALYZE and pg_stat_statements
- PostgreSQL 18 performance configuration matrix
- btree_gist improvements in PostgreSQL 18
- PostgreSQL wait event analysis with pg_stat_activity
- Troubleshooting PostgreSQL streaming replication lag
- Using pgvector for timeseries anomaly detection
Running PostgreSQL in production? MinervaDB provides PostgreSQL consulting, 24×7 PostgreSQL support and PostgreSQL remote DBA services as part of its database consulting services.
Running this in production?
MinervaDB provides PostgreSQL Consulting, PostgreSQL Support and PostgreSQL Remote DBA with 24x7 coverage and a 15-minute S1 response. Talk to an engineer.