ANALYZE on the parent relation can turn a crawling query into an instant one.
If you run declarative partitioning in production, understanding partitioned table statistics is not optional. It is the difference between predictable query latency and mysterious regressions that appear only after your data grows.
Why partitioned table statistics behave differently
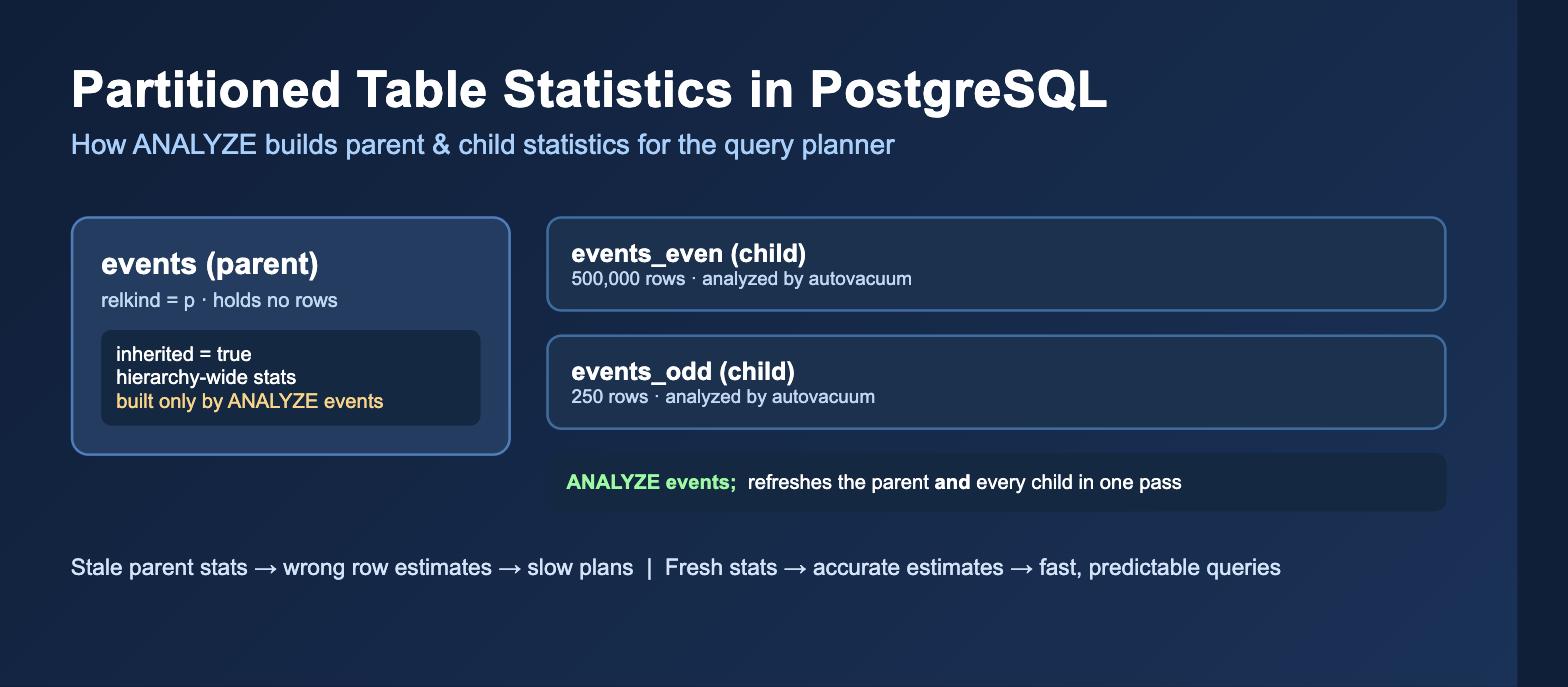
Before diving in, it helps to frame the problem: partitioned table statistics are simply the distribution data the planner keeps about a partitioned hierarchy, and they live in more than one place. When you create a partitioned table in PostgreSQL, you are really creating two kinds of objects. There is the partitioned parent, which holds no rows itself, and there are the child partitions, which store the actual data. This split is the root cause of most confusion around optimizer statistics, because each object maintains its own statistics catalog entries and each is analyzed under different rules. The PostgreSQL planner relies on statistics stored inpg_statistic (exposed through the readable view pg_stats) plus per-relation summary numbers such as reltuples and relpages in pg_class. For an ordinary table, autovacuum keeps these numbers current as rows are inserted, updated, and deleted. For a partitioned hierarchy, the picture is more nuanced: the parent needs its own aggregated statistics, and those are not always refreshed automatically the way you might expect.
This is the single most important fact to internalize: autovacuum analyzes individual partitions, but it does not automatically maintain statistics on the partitioned parent. The parent's statistics only get built when you explicitly run ANALYZE against it, or against the whole database. Until that happens, the parent can be left with stale or empty statistics even while every child is perfectly up to date.
Setting up a reproducible example
Let's build a small but realistic example so we can watch the optimizer's behavior change. We create a range-partitioned table split into two partitions, then load an intentionally skewed distribution of rows so the planner's estimates matter.-- Create a range-partitioned parent table
CREATE TABLE events (
id bigint NOT NULL,
bucket integer NOT NULL,
payload text
) PARTITION BY RANGE (bucket);
-- Two partitions: even and odd buckets
CREATE TABLE events_even PARTITION OF events
FOR VALUES FROM (0) TO (1000);
CREATE TABLE events_odd PARTITION OF events
FOR VALUES FROM (1000) TO (2000);
-- Load a skewed distribution:
-- 500,000 rows into the "even" partition
INSERT INTO events (id, bucket, payload)
SELECT g, 500, repeat('x', 20)
FROM generate_series(1, 500000) AS g;
-- Only 250 rows into the "odd" partition
INSERT INTO events (id, bucket, payload)
SELECT g, 1500, repeat('x', 20)
FROM generate_series(1, 250) AS g;
At this point the data is loaded, but no partitioned table statistics exist yet. If you query the table now, the planner is working almost blind, guessing row counts from raw page counts rather than real distribution data. This is exactly the situation many teams find themselves in right after a bulk load or a migration.
The slow query: what stale statistics cost you
Consider a simple aggregate query that touches the whole partitioned table. Before we analyze anything, let's ask the planner what it thinks the query will cost.-- Inspect the plan BEFORE gathering statistics EXPLAIN (ANALYZE, BUFFERS) SELECT bucket, count(*) FROM events GROUP BY bucket;Without proper partitioned table statistics, the planner tends to fall back on hard-coded defaults. In other words, missing partitioned table statistics force the optimizer to guess. Historically PostgreSQL assumes a freshly created relation contains a fixed default number of rows when it has no better information. That default estimate can be wildly wrong for a table holding half a million rows, and the mistake cascades: the planner may choose the wrong join strategy, misjudge whether a parallel plan is worthwhile, allocate too little memory for hashing and sorting, and pick a nested loop where a hash join would win. The consequences are not academic. A row-count estimate that is off by three orders of magnitude routinely produces a plan that is hundreds of times slower than the optimal one. The query still returns correct results, which is precisely why these problems slip past testing and only surface under production load.
Fixing it with a single ANALYZE
Now we gather partitioned table statistics. The key insight is that runningANALYZE on the parent relation does two things at once: it collects statistics for the parent hierarchy as a whole and, by default, it recurses into every child partition.
-- Gather statistics for the parent AND all children
ANALYZE events;
After this command runs, re-run the same
EXPLAIN (ANALYZE) and the difference is dramatic. The estimated row counts now line up closely with the actual row counts, the planner sizes its hash tables correctly, and it makes a sound decision about parallelism. The query that felt sluggish now completes quickly, and critically, it does so predictably as the data grows.
This is the headline lesson of the whole exercise: a slow query on a partitioned table is very often not an indexing problem or a hardware problem. It is a statistics problem, and the fix is a single, cheap ANALYZE.
Reading partitioned table statistics directly
You do not have to guess whether partitioned table statistics exist. PostgreSQL exposes everything through system catalogs, and inspecting them is the fastest way to diagnose an estimation problem. The behavior of the command is documented in detail in the official PostgreSQL ANALYZE documentation. Start with the per-relation row and page counts.-- Compare estimated tuples across the hierarchy
SELECT c.relname,
c.relkind,
c.reltuples::bigint AS estimated_rows,
c.relpages AS pages
FROM pg_class c
JOIN pg_namespace n ON n.oid = c.relnamespace
WHERE c.relname IN ('events', 'events_even', 'events_odd')
ORDER BY c.relname;
Here relkind tells you what each object is: a value of p marks the partitioned parent, while r marks an ordinary child partition that physically stores rows. A parent showing reltuples of -1 or 0 while its children show large counts is a clear signal that the parent has never been analyzed.
You can also inspect column-level statistics through pg_stats. The inherited column is the crucial detail for partitioning, because it distinguishes statistics that describe only the local relation from statistics that describe the entire inheritance tree.
-- Distinguish local vs. inherited (hierarchy-wide) statistics
SELECT tablename,
       attname,
       inherited,
       n_distinct,
       null_frac
FROM pg_stats
WHERE tablename IN ('events', 'events_even', 'events_odd')
ORDER BY tablename, inherited, attname;
When inherited is true, the row describes the combined distribution across the parent and all its partitions. When it is false, the row describes just that one relation's own contents. The planner uses the inherited statistics when it estimates a query written against the parent, which is why those inherited entries must exist and be current.
Why analyzing children alone is not enough
A common mistake with partitioned table statistics is to assume that because autovacuum keeps every child partition analyzed, the whole hierarchy must be covered. It is not. The inherited, hierarchy-wide statistics attached to the parent are a separate set of catalog entries, and they are produced only by an explicitANALYZE on the parent (or on the database).
You can prove this to yourself. Analyze only the children and then examine the parent's inherited statistics.
-- Analyze only the individual partitions
ANALYZE events_even;
ANALYZE events_odd;

-- The parent's inherited statistics are still missing
SELECT tablename, attname, inherited
FROM pg_stats
WHERE tablename = 'events'
  AND inherited = true;
The query above frequently returns zero rows even though both children are fully analyzed. The planner, when estimating a query against
events, has no hierarchy-wide distribution to consult and must fall back on cruder heuristics. This is exactly why partitioned table statistics require deliberate attention. This is the trap that catches so many teams: monitoring shows autovacuum running happily, dashboards look green, and yet the parent-level statistics that actually drive planning are absent. For a deeper look at how the background worker behaves, see our guide to PostgreSQL autovacuum tuning.
How the planner combines partition statistics
It is worth understanding what the optimizer does with these partitioned table statistics when it plans a query over a partitioned table. The official guide to how the planner uses statistics is a useful companion to this section. Partitioned table statistics feed directly into this process. When a query targets the parent, PostgreSQL builds an append plan that unions the scans of the relevant partitions. Partition pruning removes partitions that cannot match the query's conditions, so only the surviving partitions contribute to the cost estimate. For each surviving partition, the planner estimates the number of rows the scan will return using that partition's own statistics. It then combines those per-partition estimates to size the append node and everything above it in the plan tree. If the parent's inherited statistics are available, they inform selectivity estimates for predicates and grouping that span the whole hierarchy. When those inherited statistics are missing, the combined estimate degrades and the plan above the append node is built on sand.Parallel plans and partition statistics
Skewed data makes the partitioned table statistics story even more interesting once parallelism enters the picture. PostgreSQL decides how many parallel workers to consider based on the estimated size of each relation being scanned. A partition estimated at a few megabytes may justify a single worker, while a larger one justifies more. Because the planner also accounts for the coordinating leader process, the effective number of workers it credits is not a clean integer. Consider our skewed example: one partition holds half a million rows and the other holds only a couple hundred. A correct set of statistics lets the planner allocate parallel resources sensibly, giving the large partition the workers it needs while not wasting effort on the tiny one. With broken statistics, the planner may either over-parallelize a trivial scan or refuse to parallelize a scan that would have benefited enormously. Either way you leave performance on the table.-- Encourage parallelism and observe worker allocation per partition SET max_parallel_workers_per_gather = 4; EXPLAIN (ANALYZE, BUFFERS, VERBOSE) SELECT count(*) FROM events WHERE payload LIKE 'x%';In the plan output you will see a
Parallel Append node with a child scan per surviving partition. The loops value on each scan reflects how many worker processes actually touched that partition, and the estimated rows on each node reflect the per-partition statistics. When estimates match reality, the actual and estimated numbers converge, which is the visual signature of a well-tuned partitioned query.
Automating partitioned table statistics maintenance
Since autovacuum will not maintain parent-level partitioned table statistics for you, you need a deliberate strategy for partitioned table statistics maintenance. There are several complementary approaches, and mature deployments usually combine them. The most robust habit is to runANALYZE on the parent immediately after any operation that changes the shape of the data significantly. Bulk loads, backfills, large deletes, and the attachment of a freshly populated partition are all events that should trigger a targeted analyze. Because ANALYZE events refreshes both the parent and its children in one pass, it is cheap insurance.
-- Refresh statistics right after attaching a pre-loaded partition
ALTER TABLE events ATTACH PARTITION events_2026
    FOR VALUES FROM (2000) TO (3000);

ANALYZE events;
For steady-state workloads, schedule a periodic maintenance job that analyzes your partitioned parents on a cadence that matches how quickly their aggregate distribution shifts. A nightly database-wide ANALYZE is a blunt but effective safety net for smaller systems, while large systems benefit from targeting only the hot partitioned tables so the maintenance window stays short.
-- Targeted maintenance: analyze only the partitioned parents you care about
ANALYZE VERBOSE events;

-- Or verify what the sampling produced afterward
SELECT relname, last_analyze, last_autoanalyze
FROM pg_stat_user_tables
WHERE relname IN ('events', 'events_even', 'events_odd');
Tuning the statistics target for skewed data
The default statistics target behind your partitioned table statistics controls how many buckets PostgreSQL uses in its histograms and how many most-common values it tracks. For a column with highly skewed data across partitions, the default may not capture enough detail for the planner to distinguish common values from rare ones. You can raise the target on individual columns where accuracy matters most, then re-analyze.-- Increase histogram resolution on a skewed column ALTER TABLE events ALTER COLUMN bucket SET STATISTICS 500; -- Re-gather statistics with the new, finer target ANALYZE events;Raising the statistics target increases the sampling and planning cost slightly, so treat it as a targeted tool rather than a global default. Apply it to the columns that appear in your selective predicates and join conditions, measure the effect on your real plans, and keep what pays for itself.
Extended statistics for correlated columns
Standard per-column statistics assume that columns are independent. When two columns in a partitioned table are correlated, the planner multiplies their individual selectivities and badly underestimates the combined result size. Extended statistics let you tell PostgreSQL that certain columns move together, which sharpens estimates for multi-column predicates.-- Declare functional dependency / multi-column distribution
CREATE STATISTICS events_bucket_id (dependencies, ndistinct)
ON bucket, id
FROM events;
ANALYZE events;
Extended statistics are especially valuable on partitioned tables because partitioning keys are frequently correlated with other business columns. Declaring these relationships gives the optimizer a much more faithful model of your data and prevents the compounding errors that plague multi-predicate queries.
A practical diagnostic checklist
When a query is slow and you suspect partitioned table statistics, work through a short, repeatable checklist rather than guessing. First, runEXPLAIN (ANALYZE, BUFFERS) and compare estimated rows against actual rows at every node; a large divergence points straight at statistics. Second, check pg_stat_user_tables to confirm when the parent and each child were last analyzed. Third, query pg_stats with a filter on inherited = true to verify the parent actually has hierarchy-wide statistics. Fourth, run ANALYZE on the parent and re-check the plan. In the overwhelming majority of cases, that sequence either fixes the problem outright or tells you exactly where to look next.
Related reading on PostgreSQL performance
Effective use of partitioned table statistics fits into a broader PostgreSQL tuning practice. For deeper context, explore our other guides on PostgreSQL performance, PostgreSQL DBA best practices, and PostgreSQL troubleshooting. Combining sound statistics maintenance with these disciplines keeps your entire cluster fast and predictable.Key takeaways
PostgreSQL's declarative partitioning is powerful, but it shifts some responsibility for partitioned table statistics onto you. Autovacuum keeps child partitions analyzed, yet it does not build the inherited, parent-level statistics that the planner needs to reason about the hierarchy as a whole. That gap is the hidden cause behind a surprising number of slow partitioned queries. The remedy is simple and cheap. RunANALYZE on the parent after significant data changes, schedule regular maintenance for your partitioned parents, verify your assumptions by reading pg_stats and pg_class directly, and reach for a higher statistics target or extended statistics when your data is skewed or correlated. Master these habits and your partitioned table statistics will keep the optimizer honest, your plans stable, and your query latency predictable as your data grows.Running this in production?
MinervaDB provides PostgreSQL Consulting, PostgreSQL Support and PostgreSQL Remote DBA with 24x7 coverage and a 15-minute S1 response. Talk to an engineer.