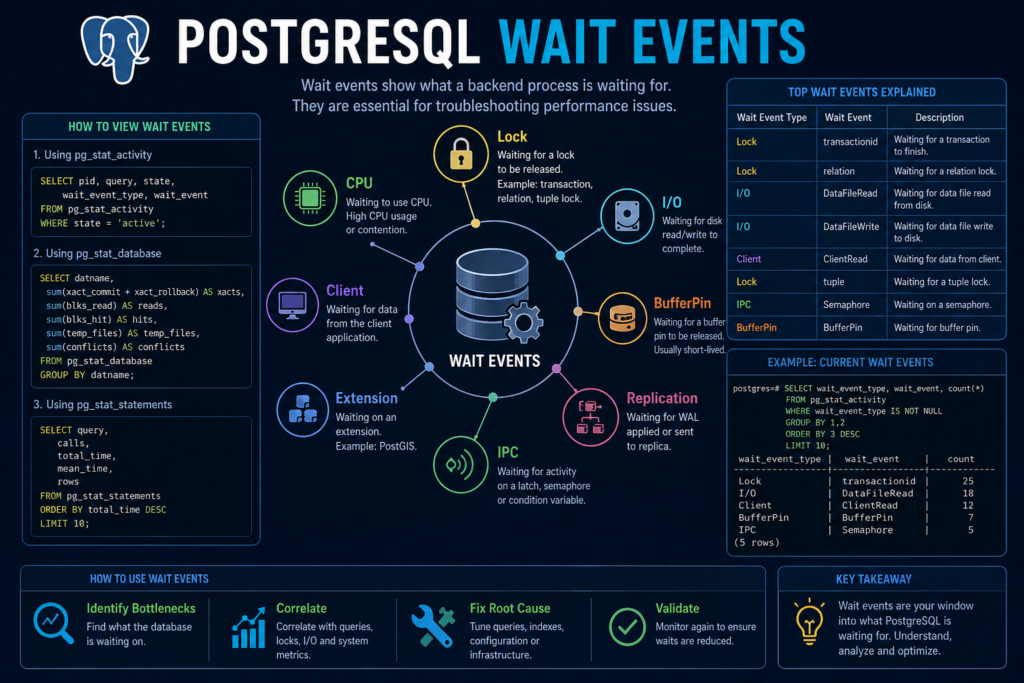
PostgreSQL wait events answer the question that query plans cannot: when a backend is not executing on CPU, what exactly is it waiting for? Wait-event analysis is how we resolve the incidents where every individual query "looks fine" in EXPLAIN yet application latency has tripled — because the time is going to lock queues, WAL flushes, buffer contention, or the client itself. Since PostgreSQL 9.6 introduced wait_event_type and wait_event in pg_stat_activity, and with the taxonomy refined through PostgreSQL 17, sampling these two columns is the closest thing PostgreSQL has to Oracle-style wait interface diagnostics — provided you sample correctly and read the categories for what they actually mean.
How Wait Event Sampling Works — and Its One Big Caveat
pg_stat_activity shows the instantaneous wait state of each backend. PostgreSQL does not natively accumulate time per wait event (unlike pg_stat_statements for query time), so a single query of the view is an anecdote, not a profile. The discipline is repeated sampling: poll every 1–10 seconds, store the samples, and analyze the distribution. A wait event that appears in 60% of samples for a backend approximates 60% of that backend's wall time — standard sampling-profiler logic.
-- Minimal sampler: run via cron/pg_cron every 10s into a history table
INSERT INTO ops.wait_samples
SELECT
    NOW()            AS sampled_at,
    pid,
    usename,
    state,
    wait_event_type,
    wait_event,
    query_start,
    LEFT(query, 100) AS query_head
FROM pg_stat_activity
WHERE state <> 'idle'
  AND pid <> pg_backend_pid();
Then profile an incident window:
SELECT
    wait_event_type,
    wait_event,
    COUNT(*)                                        AS samples,
    ROUND(100.0 * COUNT(*) / SUM(COUNT(*)) OVER (), 1) AS pct
FROM ops.wait_samples
WHERE sampled_at BETWEEN '2026-07-28 14:00' AND '2026-07-28 14:30'
GROUP BY wait_event_type, wait_event
ORDER BY samples DESC;
For continuous production coverage, the pg_wait_sampling extension does this in shared memory at high frequency with far lower overhead, and pairs each sample with queryid so you can join wait profiles to pg_stat_statements. On managed platforms you typically get the equivalent built in — RDS Performance Insights, Cloud SQL query insights, Azure Query Store wait statistics — all built on the same wait-event taxonomy.
One reading rule before the categories: wait_event IS NULL with state = 'active' means the backend is on CPU (or in an uninstrumented code path). A workload showing mostly NULL waits under high latency is CPU-bound — scale compute or reduce per-query work; there is no wait to tune away.
Lock Waits: Someone Is Holding What You Need
wait_event_type = 'Lock' is heavyweight-lock waiting: relation, tuple, transactionid, virtualxid. This is application-visible blocking, and the resolution is always to find the holder:
SELECT
    w.pid                     AS waiting_pid,
    w.wait_event,
    NOW() - w.query_start     AS waiting_for,
    b.pid                     AS blocking_pid,
    b.state                   AS blocker_state,
    NOW() - b.xact_start      AS blocker_xact_age,
    LEFT(w.query, 60)         AS waiting_query,
    LEFT(b.query, 60)         AS blocking_query
FROM pg_stat_activity AS w
JOIN LATERAL UNNEST(pg_blocking_pids(w.pid)) AS blocker(bpid) ON TRUE
JOIN pg_stat_activity AS b ON b.pid = blocker.bpid
WHERE w.wait_event_type = 'Lock';
The three patterns that cover most production lock storms: an idle in transaction session holding row locks while the application does non-database work (fix: idle_in_transaction_session_timeout, and fix the application's transaction scope); DDL taking ACCESS EXCLUSIVE behind a long reader, queueing everything behind it (fix: lock_timeout = '5s' in every migration session so DDL fails fast instead of stalling the system); and transactionid waits from concurrent updates to the same hot rows — a data-model concurrency ceiling that no parameter fixes, addressed with batching, ordered updates, or splitting hot counters.
Set log_lock_waits = on (reload) so every wait exceeding deadlock_timeout (default 1s) is logged with holder and waiter — the forensic record you'll want after the incident.
LWLock Waits: Internal Contention
LWLock waits are contention on PostgreSQL's internal short-duration locks — invisible to applications but decisive at high concurrency. The ones that matter in practice:
WALWrite / WALInsert. Backends queueing to write or insert WAL. Dominant WALWrite waits under a commit-heavy workload point at fsync latency on the WAL device. Fixes in ascending invasiveness: group commit tuning (commit_delay/commit_siblings — measure, results vary), moving WAL to lower-latency storage, and for workloads that can tolerate bounded loss on crash, synchronous_commit = off per-session for the specific ingestion role (never globally on systems with strict durability requirements; it does not risk corruption, only last-transactions loss).
buffer_content / buffer_mapping. Contention on individual buffer pages — classically the upper levels of a hot B-tree index, or hint-bit/freeze activity storms. A right-leaning sequential index (all inserts hitting the last leaf page) shows up here at scale; PostgreSQL 15+ substantially improved relation extension behavior, and hash-partitioning a monotonic-key hot table spreads the pressure.
LockManager (lock_manager pre-16 naming). Contention on the lock manager's internal partitions, typically from extreme rates of lock acquisition — thousands of tiny transactions per second touching many relations, or per-statement savepoint abuse. Reduce lock churn: batch work, reuse transactions, prune unused partitions/indexes the planner must still lock.
SubtransSLRU / MultiXact* (Pre-17: subtrans, multixact_offset, multixact_member). SLRU cache thrashing from heavy subtransaction use (ORMs issuing SAVEPOINT per statement, PL/pgSQL EXCEPTION blocks in hot paths) or from SELECT ... FOR SHARE/foreign-key multixact pressure. PostgreSQL 17 made SLRU cache sizes configurable (e.g., subtransaction_buffers, multixact_member_buffers); on earlier versions the fix is workload-side — eliminate the subtransaction storm. This exact pattern has caused several famous production outages at scale.
IO Waits: Reading the Storage Story
IO-type waits (DataFileRead, DataFileWrite, WALSync, WALWrite...) map backend time to filesystem operations. Interpret jointly with buffer statistics rather than in isolation:
-- PostgreSQL 16+: per-backend-type, per-context I/O accounting
SELECT backend_type, object, context,
       reads, read_time, writes, write_time, extends, fsyncs
FROM pg_stat_io
WHERE reads > 0 OR writes > 0
ORDER BY read_time + write_time DESC;
Dominant DataFileRead waits with a falling buffer hit ratio mean the working set no longer fits — the conversation is shared_buffers sizing, index efficiency (are queries reading pages they don't need?), and bloat (are the pages half air?). Dominant WALSync/WALWrite waits are commit-path storage latency, as above. Heavy DataFileWrite waits in ordinary backends — rather than in the background writer or checkpointer, which pg_stat_io now lets you distinguish on 16+ — indicate backends forced to evict dirty buffers themselves: raise checkpoint throughput headroom (max_wal_size, checkpoint_completion_target) and background writer aggressiveness before blaming the disks.
Client and IPC Waits: The Database Waiting on Everyone Else
Client: ClientRead in an active transaction means PostgreSQL is waiting for the application mid-transaction — slow application processing between statements, or a congested network path. Fleet-wide ClientRead dominance with rising idle in transaction counts is an application or connection-pool pathology, not a database one; it still causes database harm by holding snapshots and locks. IPC waits like ParallelFinish or BgWorkerShutdown spotlight parallel-query coordination overhead — if parallel workers spend their lives synchronizing, revisit max_parallel_workers_per_gather and whether the plans should be parallel at all. Timeout-type events (PgSleep, VacuumDelay) are usually self-explanatory; a profile dominated by VacuumDelay is autovacuum cost-throttling made visible — raise the cost limit if vacuum is behind.
From Wait Profile to Action: A Worked Triage
A real profile from a payments platform incident (PostgreSQL 15, 30-minute window, 10-second sampling): 41% Lock:transactionid, 22% LWLock:WALWrite, 14% NULL (CPU), 9% Client:ClientRead, remainder scattered. Reading it: the headline is row-level write contention — concurrent updates against the same rows (confirmed: a balance table with per-merchant hot rows). The WALWrite share is a secondary commit-path pressure amplified by retry storms from the lock waits. The fix sequence was application-side row-batching per merchant plus ordered updates (eliminating the transactionid convoy), then WAL device latency review — and the post-fix profile showed Lock waits under 3% with p99 restored.
The general lesson: fix the dominant wait class first; secondary classes often shrink on their own because they were downstream of the convoy.
Attributing Waits to Queries: Joining the Two Telemetry Planes
A wait profile tells you the system is 40% WALWrite; it doesn't tell you which statement to fix. Closing that gap requires joining wait samples to query identity. Three tiers, in ascending fidelity. Tier one, core-only: your sampler already captures query_head per sample — group waits by the leading 100 characters and you get coarse attribution free. Tier two, core 14+: enable compute_query_id = on (reload) and capture query_id from pg_stat_activity in the sampler; now wait samples join exactly to pg_stat_statements.queryid, giving per-normalized-statement wait profiles:
SELECT
    s.query_id,
    ws.wait_event_type,
    ws.wait_event,
    COUNT(*)                                   AS samples,
    MAX(LEFT(pss.query, 60))                   AS query_head
FROM ops.wait_samples AS ws
JOIN LATERAL (SELECT ws.query_id) AS s ON TRUE
LEFT JOIN pg_stat_statements AS pss
    ON pss.queryid = ws.query_id
WHERE ws.sampled_at > NOW() - INTERVAL '1 hour'
GROUP BY s.query_id, ws.wait_event_type, ws.wait_event
ORDER BY samples DESC
LIMIT 25;
Tier three, extension: pg_wait_sampling's pg_wait_sampling_profile view accumulates exactly this join in shared memory at ~10 ms resolution with negligible overhead — the production-grade answer for self-managed fleets, and functionally what RDS Performance Insights renders as its per-SQL wait bars. Whichever tier you run, the analytical move is the same: for the top statement by total time in pg_stat_statements, split its time into CPU (NULL waits) versus each wait class. A statement that is 80% Lock waits gets a concurrency fix; the same statement at 80% NULL gets a plan fix. Skipping this split is how teams rewrite SQL to fix a lock queue.
Building the Wait Dashboard That Ops Actually Uses
The dashboards that survive incidents share a shape. Panel one: stacked area of wait-class share over time (Lock / LWLock / IO / Client / CPU-NULL), because regressions announce themselves as a color changing width — the fastest anomaly detector humans own. Panel two: top wait events within the currently dominant class, with drill-through to the per-query attribution above. Panel three: correlates — TPS, p99 latency, active backends, and checkpoint timing (pg_stat_bgwriter / pg_stat_checkpointer on 17+) on the same time axis, so a WALWrite surge lines up visually with the checkpoint that caused it.
Alerting discipline: alert on sustained share shifts (Lock class > 20% of samples for 5 minutes), never on the mere presence of a wait event; every wait event exists on a healthy system, and presence-based alerts train responders to ignore the channel. postgres_exporter plus a 10-second sampler covers all of this on self-managed; on RDS/Aurora, export Performance Insights metrics via the API into the same Grafana so your runbooks reference one visual language across the fleet.
Second Worked Case: The Invisible Checkpoint Storm
SaaS analytics platform, PostgreSQL 14, complaint: "random 2–3 second latency spikes, no slow queries in the log." The wait dashboard showed a metronomic pattern — every ~4 minutes, IO:DataFileWrite and LWLock:WALWrite jointly spiking to 55% of samples for ~20 seconds. That periodicity is a checkpoint signature: pg_stat_bgwriter confirmed checkpoints_req outnumbering checkpoints_timed 6:1 — the instance was blowing through max_wal_size (default 1 GB) under write load, forcing back-to-back requested checkpoints, each followed by a full-page-image WAL amplification wave that saturated the volume.
Changes, staged: max_wal_size 1 GB → 16 GB (reload; costs recovery time, bounded and accepted at ~3 minutes), checkpoint_completion_target 0.9 confirmed, checkpoint_timeout 5 min → 15 min (reload). Post-change, requested checkpoints fell to zero, the periodic wait spike disappeared, and p99 flattened — zero SQL was touched. The moral generalizes: sub-minute periodic wait patterns are almost never queries; they are background machinery (checkpoints, autovacuum cost cycles, batch crons), and the wait timeline is the instrument that makes their fingerprints legible.
Wait Signatures of Maintenance and Bulk Operations
Planned operations have recognizable wait fingerprints, and knowing them separates "expected cost of the migration" from "the migration is about to cause an incident." A CREATE INDEX CONCURRENTLY shows up as sustained IO:DataFileRead in the builder backend plus — the dangerous part — brief fleet-wide Lock:relation ripples at its two transaction-boundary points; if those ripples become plateaus, a long-running transaction is blocking the index build's wait-for-snapshots phase, and every subsequent DML is now queueing behind an operation everyone believed was "fully online." The responder's move is to identify and end the elderly transaction, not to cancel the build.
Bulk COPY loads profile as WALWrite/WALSync plus DataFileExtend — and DataFileExtend dominance specifically signals relation-extension contention from many loaders hitting one table, which PostgreSQL 16 substantially improved and which you mitigate on any version by pre-partitioning the load targets. Logical dump/restore (pg_restore -j) shows the same signature plus bursts of LWLock:LockManager when parallel workers create constraints simultaneously — sequence the post-data phase if it destabilizes a shared instance.
A long pg_basebackup or snapshot backup reads as elevated DataFileRead with rising ClientWrite on the walsender — if application queries simultaneously shift toward DataFileRead, the backup is evicting the working set, and the fix is backup-source placement (run it against a standby) rather than query tuning. The general protocol our runbooks encode: before any maintenance window, capture a 30-minute baseline wait profile; during the operation, watch for the operation's expected signature and alert only on classes outside it; afterward, confirm return to baseline within one traffic cycle.
Maintenance that cannot pass that three-step check has an unbudgeted side effect — better discovered while the change ticket is still open than from next week's latency regression review.
Version Landscape: What Changed Where
Wait-event tooling has moved quickly, and your diagnostic ceiling depends on the version you run.
PostgreSQL 13: baseline taxonomy, backend_type filtering. 14: compute_query_id unlocks clean joins between activity, statements, and wait event
log lines — the single biggest observability upgrade in the modern series. 15: log_checkpoints = on by default (free forensic record) and jsonlog output for structured pipelines. 16: pg_stat_io — per-backend-type, per-context I/O with timing, finally separating "backend forced to write" from "checkpointer writing as designed"; also standby-visible statistics improvements. 17: pg_stat_checkpointer split from bgwriter stats, configurable SLRU buffer sizes with matching wait-event renames, and pg_stat_statements plan/exec time separation maturing.
If you operate 13 or 14 today, the observability delta alone — before any performance feature — is a defensible line item in the upgrade business case; we have justified major-version upgrades to CFO audiences on reduced incident MTTR, and the wait-interface improvements are the mechanism.
Quick Reference
| Wait profile dominated by | Meaning | First evidence to pull | Primary fix direction |
|---|---|---|---|
| Lock:relation / tuple / transactionid | Application-visible blocking | pg_blocking_pids chain; log_lock_waits | Transaction scope, lock_timeout, hot-row redesign |
| LWLock:WALWrite / WALInsert | Commit-path WAL pressure | WAL device latency; pg_stat_io fsyncs | WAL storage, group commit, per-role synchronous_commit |
| LWLock:buffer_content | Hot page/index contention | Hot index identification | Partitioning, key design (PG15+ improvements) |
| LWLock:SubtransSLRU / MultiXact* | SLRU thrashing | ORM savepoint audit | Remove subtransactions; PG17 SLRU buffers |
| IO:DataFileRead | Working set exceeds cache | pg_stat_io; hit ratio trend | shared_buffers, index efficiency, bloat |
| Client:ClientRead (active xact) | App/network holding transactions open | idle-in-xact counts; pool config | App transaction scope, pooler mode |
| NULL (state=active) | CPU-bound | Host CPU; pg_stat_statements | Query CPU cost, capacity |
Frequently Asked Questions (FAQ)
Why doesn’t PostgreSQL record cumulative wait time natively?
Design choice: instantaneous exposure keeps the instrumentation nearly free. Sampling reconstructs the distribution statistically; pg_wait_sampling or managed-platform insights productize exactly that.
What sampling interval is right?
1s resolves most incidents crisply; 10s is adequate for capacity trending and cheap enough to run permanently. Sub-second intervals add little beyond what pg_wait_sampling already does better in shared memory.
Are LWLock waits ever “normal”?
A low single-digit percentage is background noise on busy systems. They become a finding when a single LWLock event dominates the profile or correlates with the latency regression you're chasing.
How do wait events relate to EXPLAIN ANALYZE?
Complementary axes: EXPLAIN explains CPU-and-rows cost of a plan; wait events explain where wall time went when the backend wasn't executing. A query fast in isolation but slow in production is almost always a wait-event story.
Do wait event names change between versions?
Yes — names and granularity have evolved (e.g., SLRU-related renames in 17, pg_stat_io arriving in 16). Pin your dashboards' event lists to your server version and re-validate on every major upgrade.
Turn Wait Data into an Operating Practice
MinervaDB builds wait-event observability into every PostgreSQL environment we operate — continuous sampling, per-query wait attribution, and runbooks keyed to wait profiles — across self-managed and cloud PostgreSQL. If your team is diagnosing latency by intuition instead of instrumentation, our consulting and 24×7 support teams can change that: minervadb.com/contact-us · contact@minervadb.com.
Test all parameter changes and sampling infrastructure in staging before production rollout, and keep your backup and DR posture verified before any storage or WAL configuration change.
PostgreSQL Wait Event Analysis: Reference Taxonomy and Further Reading
PostgreSQL wait event analysis is only as reliable as the taxonomy behind it, and that taxonomy changes between major releases. Validate every PostgreSQL wait event name against the documentation for the exact version you run. These are the primary sources behind the PostgreSQL wait event mappings used throughout this guide:
- PostgreSQL documentation: wait event tables - the canonical list of every PostgreSQL wait event, grouped by wait event type.
- pg_stat_activity view reference - column semantics for
wait_event_type,wait_eventandstate. - pg_wait_sampling - continuous PostgreSQL wait event sampling in shared memory with negligible overhead.
- pg_stat_statements documentation - the query-identity side of the join described above.
PostgreSQL Wait Event Analysis Checklist
Use this as the standing operating procedure for PostgreSQL wait event analysis in production:
- Sample
pg_stat_activityevery 1-10 seconds into a history table. A single query is an anecdote, not a profile. - Read the PostgreSQL wait event class before you read any individual event name.
- Treat NULL waits on active backends as CPU time, not as a missing PostgreSQL wait event.
- Join every PostgreSQL wait event sample to
query_idso waits map back to statements. - Fix the dominant PostgreSQL wait event class first. Secondary classes usually shrink on their own.
- Re-validate dashboards after each major upgrade, because PostgreSQL wait event names keep evolving.
Done consistently, wait event sampling turns a vague latency complaint into a ranked list of wait event classes, and every wait event class has a known fix direction.
Running this in production?
MinervaDB provides PostgreSQL Consulting, PostgreSQL Support and PostgreSQL Remote DBA with 24x7 coverage and a 15-minute S1 response. Talk to an engineer.