MongoDB performance troubleshooting changed materially with MongoDB 8.3 (GA 2026-05-04, current patch 8.3.8): the Cost-Based Ranker (CBR) is now part of the default plan-selection mechanism, query memory is finally a first-class measurable quantity, and slow queries can be logged while they are still running. If your diagnostic playbook was written for MongoDB 6.0 or 7.0, parts of it are now incomplete — and one part of it (index filters) is deprecated outright.
This MongoDB performance troubleshooting walkthrough covers a triage workflow and six production scenarios — seven proven diagnostics in total — each with runnable commands, the metric that justifies the fix, and a verification step — a complete MongoDB performance troubleshooting routine you can run on any 8.3 cluster. Everything is version-pinned to MongoDB 8.x. Command output shown below is abridged and illustrative of shape only; your field values will differ. As always: test in staging before applying anything to production, and keep your DR posture intact.
Why MongoDB 8.3 Changes Your Troubleshooting Playbook
MongoDB moved to a major + minor release model: minor releases (8.2, 8.3) now ship for both Atlas and self-managed deployments, must be upgraded sequentially, and carry short lifecycles — MongoDB 8.2 already reached EOL on 2026-07-31. MongoDB 8.3 is the current stable release, and it rewires the diagnostic surface:
| Change | Since | Why it matters for troubleshooting |
|---|---|---|
| Multi-planning with Cost-Based Ranker (CBR) backup becomes the default plan-selection mechanism | MongoDB 8.3 | The single biggest optimizer change since 8.0 — and the primary plan-regression risk in an 8.0 → 8.3 upgrade |
inUseTrackedMemBytes / peakTrackedMemBytes in $currentOp, profiler, and slow query logs | MongoDB 8.3 | Per-operation memory attribution — no more guessing which query is eating the heap |
Standardized spill metrics (spills, spilledBytes, spilledRecords, spilledDataStorageSize) in explain output | MongoDB 8.2 | Memory pressure is measurable rather than inferred |
Slow in-progress query logging via defaultSlowInProgMS | MongoDB 8.3 | Catch runaway queries before they finish (or never finish) |
| Ingress connection-establishment rate limiting | MongoDB 8.2 | A native defense against the connection-storm CPU collapse pattern |
metrics.repl.network.oplogFetcherLagSeconds | MongoDB 8.3 | Direct oplog fetcher lag measurement instead of timestamp arithmetic |
WiredTiger cache-pressure transaction eviction (cachePressureQueryPeriodMilliseconds) | MongoDB 8.3 | The server now aborts the oldest transaction under sustained cache pressure — a new failure signature to recognize |
FTDC now captures connPoolStats on mongod | MongoDB 8.3 | Retrospective connection-pool forensics from diagnostic.data |
For MongoDB performance troubleshooting on the current release, full details are in the MongoDB 8.3 release notes.
Step 1 — The MongoDB Performance Troubleshooting Triage Workflow
Effective MongoDB performance troubleshooting starts before you touch any config: localize the problem to a subsystem. Two serverStatus() snapshots and a filtered $currentOp answer most "why is MongoDB slow" questions in under five minutes.
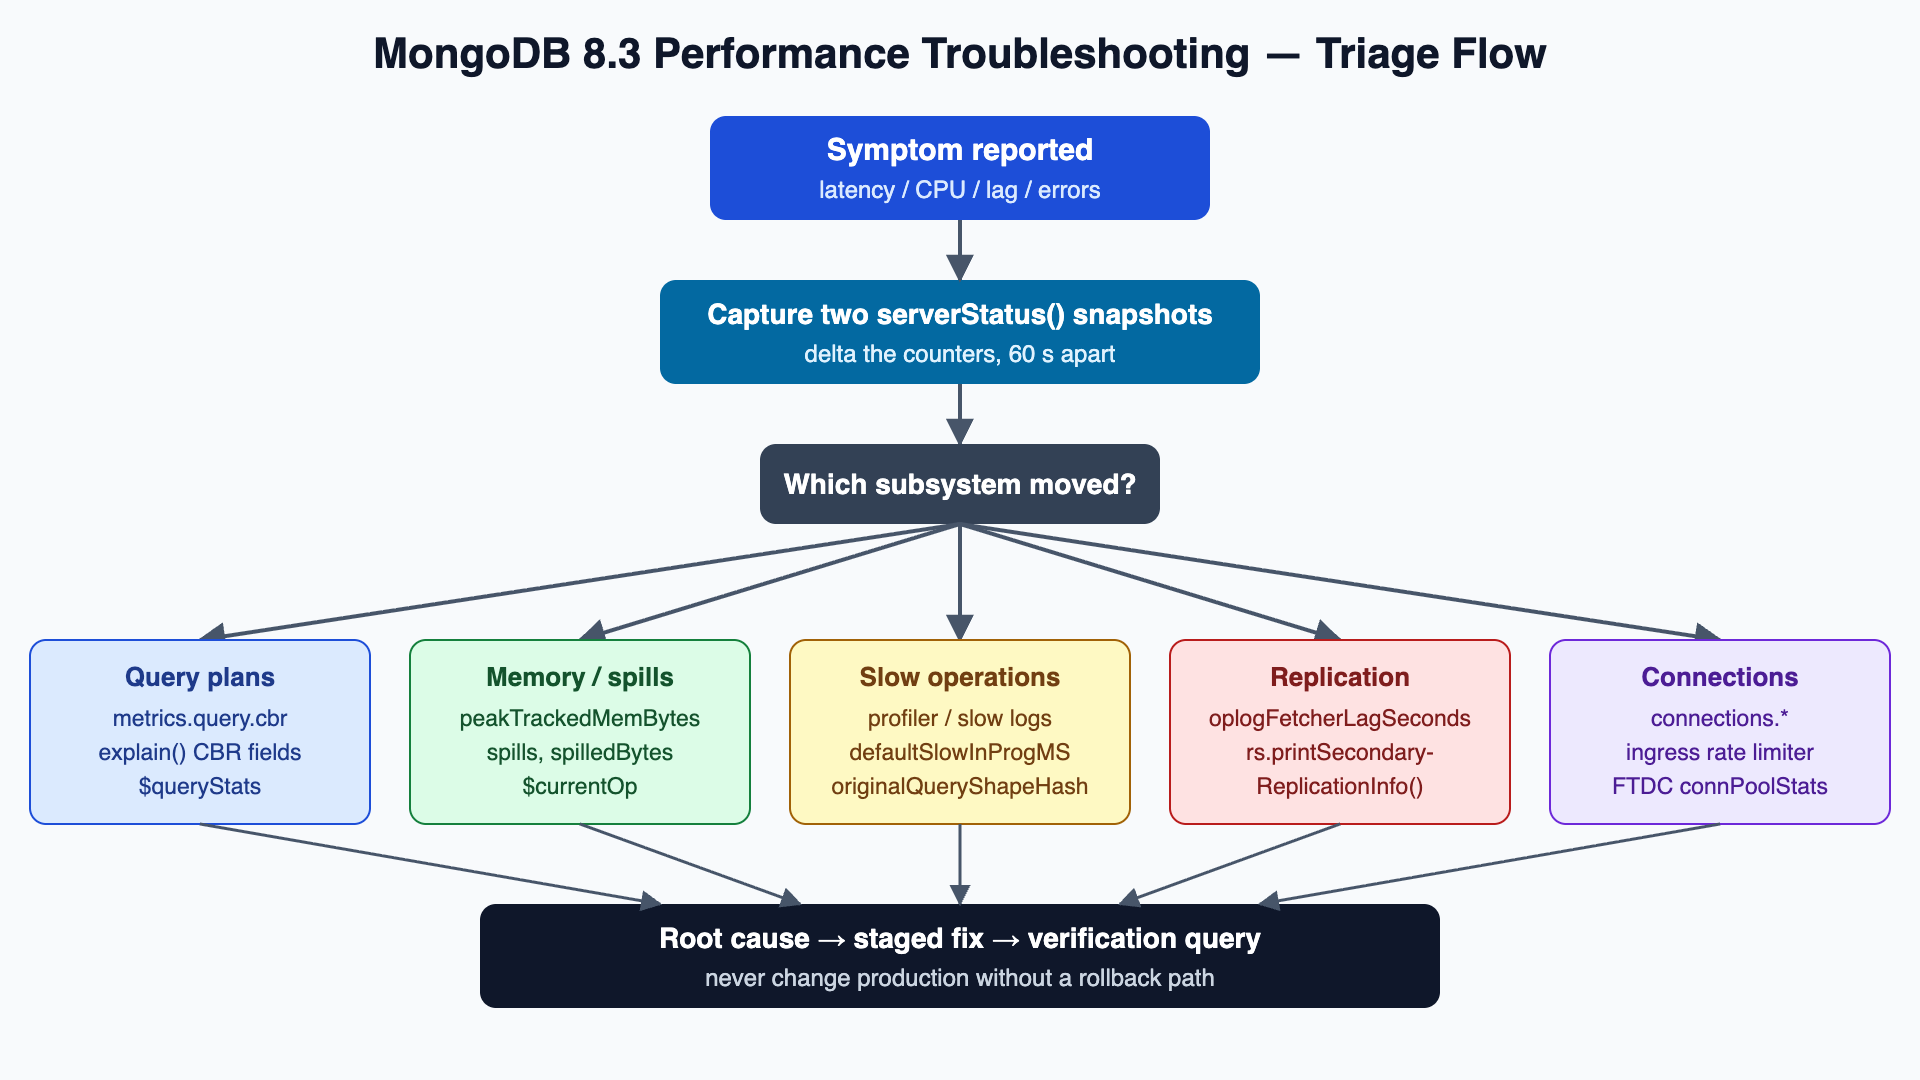
Capture deltas, not absolutes — counters only mean something as rates:
// mongosh — capture two snapshots 60 s apart and diff the interesting counters
const s1 = db.serverStatus();
sleep(60000);
const s2 = db.serverStatus();

const delta = (path) => {
  const get = (o, p) => p.split('.').reduce((a, k) => a?.[k], o);
  return get(s2, path) - get(s1, path);
};

print('opcounters.query/s : ' + delta('opcounters.query') / 60);
print('CBR invocations/s  : ' + delta('metrics.query.cbr.count') / 60);   // since MongoDB 8.3
print('TTL deletes/s      : ' + delta('metrics.ttl.deletedKeys') / 60);   // since MongoDB 8.3
print('oplog fetcher lag  : ' + s2.metrics.repl.network.oplogFetcherLagSeconds + ' s'); // 8.3, secondaries
Then list the operations that are actually hurting right now, with their memory footprint — possible since MongoDB 8.3 exposes tracked memory per operation:
// Long-running operations with per-operation memory attribution (MongoDB 8.3+)
db.getSiblingDB('admin').aggregate([
  { $currentOp: { allUsers: true, idleSessions: false } },
  { $match: { secs_running: { $gt: 5 } } },
  { $project: {
      opid: 1,
      ns: 1,
      secs_running: 1,
      planSummary: 1,
      inUseTrackedMemBytes: 1,
      peakTrackedMemBytes: 1
  } },
  { $sort: { peakTrackedMemBytes: -1 } }
]);
/* Illustrative output shape — values will differ on your cluster
{
  "opid": 88231,
  "ns": "orders.events",
  "secs_running": 41,
  "planSummary": "COLLSCAN",
  "inUseTrackedMemBytes": 214748364,
  "peakTrackedMemBytes": 322122547
}
*/
A COLLSCAN with 300 MB of peak tracked memory and 41 seconds of runtime is your suspect. The sections below map each triage branch to a fix, and together they form a repeatable MongoDB performance troubleshooting routine.
Scenario 1 — Plan Regressions After Upgrading to 8.3: The Cost-Based Ranker
This is the MongoDB performance troubleshooting scenario upgraders hit most. Symptom: after an 8.0 → 8.3 upgrade, a handful of previously fast query shapes run 5–50× slower. Application logs show timeouts; nothing else changed.
Since MongoDB 8.3, plan selection works like this: the classic multi-planner runs a short competitive trial; if no qualifying plan emerges within the trial period, the Cost-Based Ranker estimates a cost for each candidate plan node and picks the cheapest — without timed execution. That is a fundamentally different selection path than 8.0, and it is exactly where regressions hide.
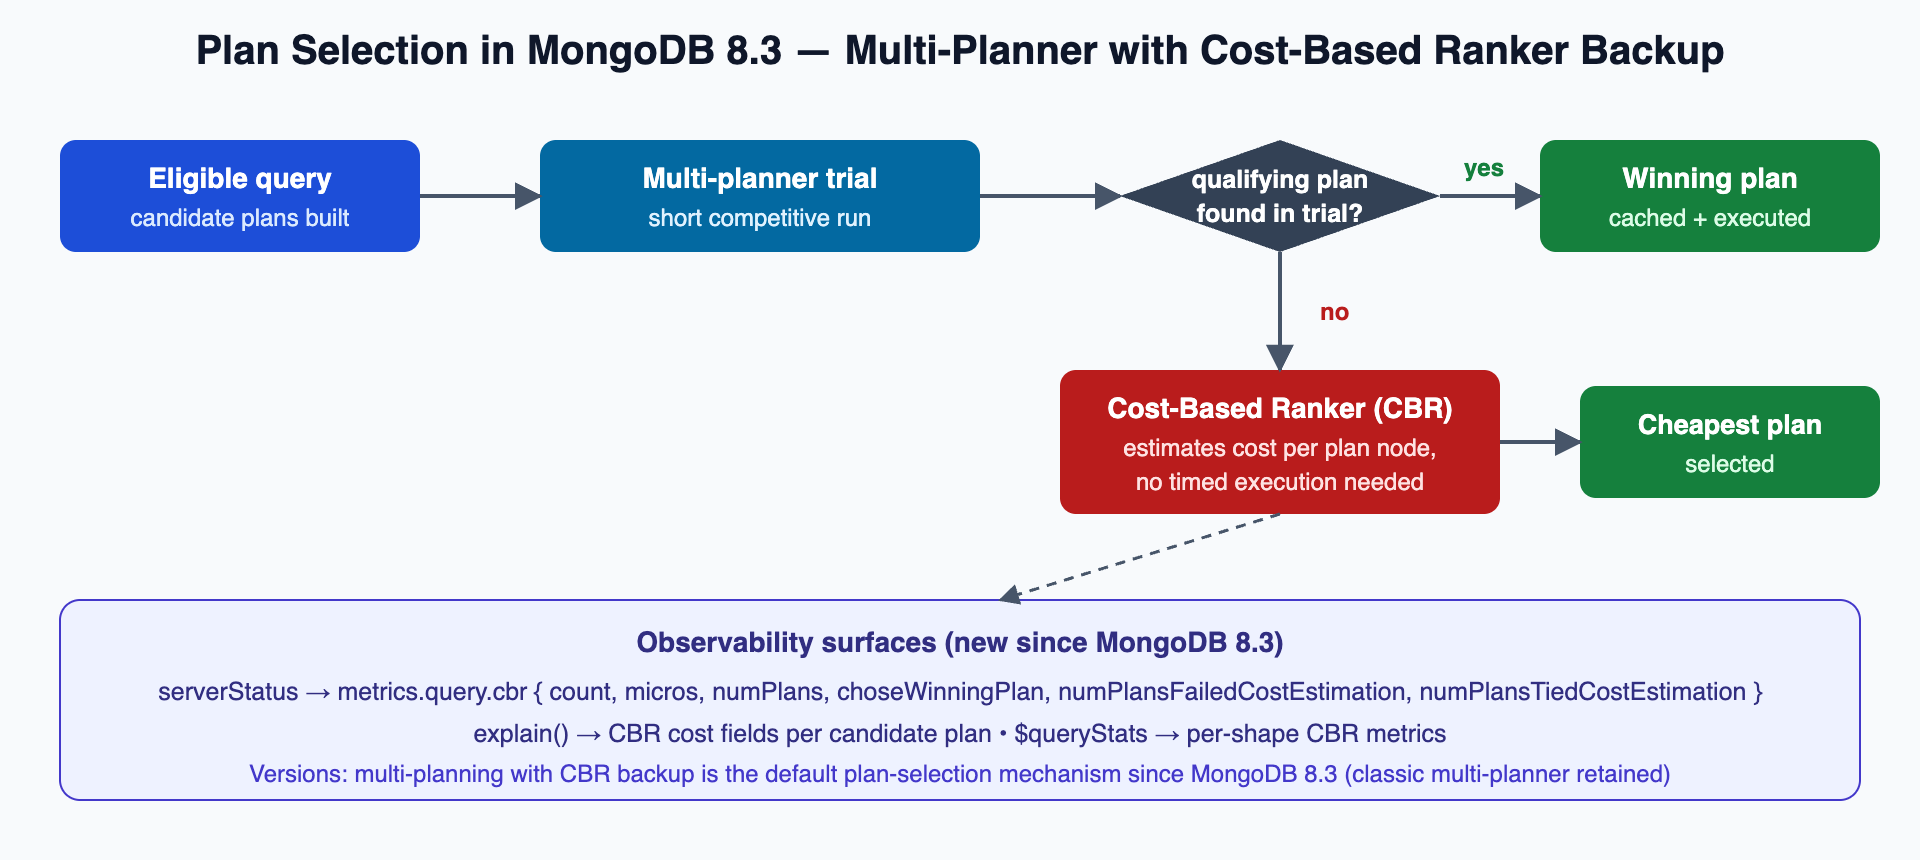
Diagnose. First confirm CBR is actually involved for the affected shape — explain() carries CBR fields since 8.3, and serverStatus exposes aggregate CBR behavior:
// Per-query: inspect plan selection for the regressed shape
db.orders.find({ customer_id: 4711, status: 'OPEN' })
         .sort({ created_at: -1 })
         .explain('executionStats');
// In 8.3+, look for CBR cost fields on candidate plans in queryPlanner,
// and compare totalKeysExamined / totalDocsExamined vs the pre-upgrade plan.

// Cluster-wide: is CBR choosing plans, and how often does costing fail or tie?
const cbr = db.serverStatus().metrics.query.cbr;
printjson({
  count: cbr.count,
  micros: cbr.micros,
  numPlans: cbr.numPlans,
  numPlansFailedCostEstimation: cbr.numPlansFailedCostEstimation,
  numPlansTiedCostEstimation: cbr.numPlansTiedCostEstimation
});
A climbing numPlansFailedCostEstimation or a large tie count on a workload that regressed is the measurement that justifies intervention — document it before you change anything.
Fix, staged. Quick mitigation first, durable fix second. Index filters are deprecated since MongoDB 8.0 — use Query Settings, which persist across restarts and apply cluster-wide:
// Quick mitigation: pin the known-good index for the regressed query shape
db.adminCommand({
  setQuerySettings: {
    find: 'orders',
    filter: { customer_id: 4711, status: 'OPEN' },
    sort: { created_at: -1 },
    $db: 'shop'
  },
  settings: {
    indexHints: { ns: { db: 'shop', coll: 'orders' },
                  allowedIndexes: [ { customer_id: 1, status: 1, created_at: -1 } ] }
  }
});

// Verification: the plan cache should now show the pinned index
db.orders.aggregate([ { $planCacheStats: {} },
                      { $match: { 'createdFromQuery.query.customer_id': 4711 } },
                      { $project: { planCacheShapeHash: 1, isActive: 1, planSummary: 1 } } ]);
The durable fix is usually a better compound index for the shape, after which you remove the setting with removeQuerySettings. Roll back path: removeQuerySettings restores default plan selection instantly — no restart, no data movement.
Prevention: capture plan shapes before any 8.x upgrade ($planCacheStats export per collection) and diff after. Treat this as a mandatory upgrade gate, the same way you would treat a compatibility-level change on a relational engine.
Scenario 2 — Memory Pressure and Disk Spills You Can Now Measure
Memory is the second MongoDB performance troubleshooting frontier. Symptom: aggregation-heavy workload; intermittent latency spikes; host-level RSS growth; occasionally QueryExceededMemoryLimitNoDiskUseAllowed in application logs.
Since MongoDB 8.2, spill behavior is standardized in explain output: spills, spilledBytes, spilledRecords, and spilledDataStorageSize appear per stage, and serverStatus carries corresponding counters. Since 8.3, peakTrackedMemBytes also lands in explain results, the profiler, and slow query logs. Combined, they turn “the node feels swappy” into an attributable, per-stage number.
// Which stage of this pipeline spills, and how much?
db.events.explain('executionStats').aggregate([
  { $match: { tenant_id: 'acme', ts: { $gte: ISODate('2026-08-01') } } },
  { $group: { _id: '$session_id', n: { $sum: 1 }, last: { $max: '$ts' } } },
  { $sort: { n: -1 } }
], { allowDiskUse: true });
/* Illustrative output shape — per-stage spill accounting (MongoDB 8.2+)
"$group": {
  "spills": 12,
  "spilledBytes": 734003200,
  "spilledRecords": 1822441,
  "spilledDataStorageSize": 268435456,
  "peakTrackedMemBytes": 104857600
}
*/
Interpretation rules of thumb: spills with acceptable latency are working as designed — that is what allowDiskUse is for. Spills on your p99-critical path mean the $group key cardinality or the pipeline order needs work (push $match and $project earlier, pre-aggregate, or add an index that supports a DISTINCT_SCAN).
One 8.3-specific cap to know: the TextOr stage used by $text queries that read text scores is now limited to 100 MB. With allowDiskUse: true it spills; without it, the query fails where it previously consumed unbounded RAM. If $text queries started erroring after your upgrade, that cap — not your data — is the change.
Scenario 3 — The Query That Never Finishes: Slow In-Progress Logging
Some MongoDB performance troubleshooting cases hide because the evidence has not been written yet. Symptom: the slow query log is quiet, yet CPU is pinned. Classic cause: the offending queries have not finished yet — slow query logs are written at completion.
MongoDB 8.3 closes this observability gap: operations exceeding a threshold are logged while still executing, at most once per query, controlled by defaultSlowInProgMS:
# mongod parameter — log an in-progress entry once an operation passes 30 s
mongod --config /etc/mongod.conf --setParameter defaultSlowInProgMS=30000
// Verification: runtime parameter is set
db.adminCommand({ getParameter: 1, defaultSlowInProgMS: 1 });
Pair it with the standard completion-time thresholds via db.setProfilingLevel(), and note two more 8.3 log-surface improvements: slow query logs on mongos-originated find/aggregate/count/distinct operations now carry originalQueryShapeHash, so you can group sharded slow queries by shape; and both slow-log variants include the tracked-memory fields from Scenario 2.
If the profiler itself becomes a bottleneck on hot databases — a real failure mode on high-throughput clusters — 8.3 adds internalQueryGlobalProfilingLockDeadlineMs and internalProfilingMaxAbandonedWritesPerSecondPerDb, with abandoned profile writes surfaced under serverStatus().profiler. A non-zero, climbing totalAbandonedWrites tells you profiling is shedding load; account for that before trusting profiler-derived percentiles.
Scenario 4 — Connection Storms and Ingress Rate Limiting
Connection handling is a recurring MongoDB performance troubleshooting theme at scale. Symptom: deploy or failover triggers thousands of simultaneous reconnects; CPU saturates on connection establishment (TLS handshakes, auth), latency collapses for everyone, which triggers more client retries. The classic death spiral.
Since MongoDB 8.2 the server can defend itself natively — connection establishment is rate-limited, while established connections are untouched:
# mongod.conf — illustrative starting point; size against your own
# measured connection-establishment rate before enabling in production
setParameter:
  ingressConnectionEstablishmentRateLimiterEnabled: true
  ingressConnectionEstablishmentRatePerSec: 200
  ingressConnectionEstablishmentBurstCapacitySecs: 5
  ingressConnectionEstablishmentMaxQueueDepth: 500
These are runtime-settable parameters (setParameter), so the change is reversible without a restart — but stage it: enable on one secondary, replay a deploy, and watch serverStatus().connections plus rejection counters before rolling it to primaries. Since MongoDB 8.3, FTDC (the diagnostic.data directory) also captures connPoolStats on mongod, which finally makes post-incident connection forensics possible without having had a shell open during the storm.
// Live view during an event
const c = db.serverStatus().connections;
printjson({ current: c.current, available: c.available,
            totalCreated: c.totalCreated, queued: c.queuedForEstablishment });
Client-side, the fix remains what it always was: bounded pools (maxPoolSize), jittered exponential backoff, and no retry amplification at the load balancer. The server-side limiter is a safety net, not a substitute for a sane driver configuration — our MongoDB capacity planning guide covers how to size connection counts against core counts.
Scenario 5 — Replication Lag You Can Finally Measure Directly
Replication is where MongoDB performance troubleshooting most often turns into capacity work. Symptom: stale reads from secondaries, growing flow-control throttling on the primary, alerts on replication headroom.
Before 8.3, lag measurement meant comparing optime timestamps across members — workable, but coarse and clock-sensitive. Since MongoDB 8.3, a secondary reports its oplog fetcher lag directly:
// On each secondary (MongoDB 8.3+)
const repl = db.serverStatus().metrics.repl.network;
printjson({
  oplogFetcherLagSeconds: repl.oplogFetcherLagSeconds,
  oplogGetMoresProcessed: repl.oplogGetMoresProcessed
});
Triage split: if oplogFetcherLagSeconds is high, the secondary cannot fetch fast enough — look at network throughput and primary load. If fetch lag is near zero but apply lag (from rs.printSecondaryReplicationInfo()) is high, the secondary cannot apply fast enough — look at disk I/O, cache pressure (Scenario 6), and index-heavy write amplification. MongoDB 8.0's parallel oplog writer already improved apply throughput; if a well-provisioned 8.3 secondary still cannot keep up, the workload usually has an unsharded write hotspot — a design problem no replication tunable fixes.
Scenario 6 — WiredTiger Cache Pressure and Surprise Transaction Aborts
The last MongoDB performance troubleshooting scenario is a genuinely new 8.3 behavior. Symptom: long-running transactions abort with unexpected errors under load; eviction threads busy; p99 latency degrades in step with cache fill.
MongoDB 8.3 adds an explicit cache-pressure response: at each cachePressureQueryPeriodMilliseconds interval, the server evaluates WiredTiger cache pressure and, when detected, aborts the oldest transaction to relieve it. This is new failure behavior and a MongoDB performance troubleshooting trap — if your application began seeing sporadic transaction aborts after upgrading, correlate them with cache-pressure indicators before blaming the application:
// Cache-pressure evidence pack
const wt = db.serverStatus().wiredTiger;
printjson({
  bytes_in_cache: wt.cache['bytes currently in the cache'],
  max_bytes: wt.cache['maximum bytes configured'],
  dirty_bytes: wt.cache['tracked dirty bytes in the cache'],
  app_threads_evicting: wt.cache['application threads page write from cache to disk count']
});
Two configuration notes for containerized fleets. First, since MongoDB 8.2 the cache can be sized as a percentage — storage.wiredTiger.engineConfig.cacheSizePct — which behaves correctly under autoscaling where fixed-GB sizing does not. Second, keep transactions short: the oldest transaction is now, by design, the first casualty of cache pressure.
# mongod.conf — percentage-based cache sizing (MongoDB 8.2+)
storage:
  wiredTiger:
    engineConfig:
      cacheSizePct: 50        # replaces fixed cacheSizeGB in elastic environments
# Restart required; stage on a secondary first and step down cleanly.
Platform note while you are in this area: MongoDB documented an incompatibility with Linux kernels 6.19 through 7.0.13 (a TCMalloc interaction); 7.0.14+ is required. Check kernel versions before any OS refresh on a MongoDB fleet.
Step 7 — Prevention: A Monitoring Baseline for MongoDB 8.3
Every MongoDB performance troubleshooting scenario above is cheaper to catch from a baseline than from an incident. A good MongoDB performance troubleshooting baseline turns each of the scenarios above into a standing alert. Minimum viable 8.3 monitoring additions:
| Signal | Source | Alert intent |
|---|---|---|
| CBR failure/tie rates | metrics.query.cbr (serverStatus) | Optimizer instability after upgrades |
| Per-operation peak memory | peakTrackedMemBytes ($currentOp, slow logs) | Runaway aggregations before OOM |
| Spill volume trend | explain / serverStatus spill counters | Working-set growth beyond RAM |
| In-progress slow ops | defaultSlowInProgMS log entries | Runaways caught mid-flight |
| Connection establishment rate | connections + FTDC connPoolStats | Storm onset, limiter effectiveness |
| Oplog fetch vs apply lag | oplogFetcherLagSeconds + apply lag | Correct lag attribution |
| Cache pressure aborts | WiredTiger cache stats + txn abort errors | New 8.3 eviction behavior |
| TTL deletion throughput | metrics.ttl.* (serverStatus, 8.3+) | TTL backlog masquerading as write load |
Two operational rules complete the baseline. Patch monthly: 8.3.8 alone addressed 24 CVEs, and the 8.x patch cadence has made monthly patching the de facto floor for supported estates. And mind the lifecycle: MongoDB 6.0 has been EOL since 2025-07-31, 8.2 since 2026-07-31, and minor releases upgrade sequentially only — skipping from 8.1 to 8.3 directly is not supported, and mongosync is not supported on 8.3+, which matters if a live migration is part of your upgrade plan.
MongoDB Performance Troubleshooting FAQ
Does the Cost-Based Ranker replace the multi-planner in MongoDB 8.3?
No, and this is the most common MongoDB performance troubleshooting misconception about 8.3. Since MongoDB 8.3 the default mechanism is multi-planning with CBR backup: the multi-planner runs its short competitive trial first, and CBR performs cost-based selection when the trial produces no qualifying plan. The classic multi-planner is retained, and CBR activity is fully observable through metrics.query.cbr, explain(), and $queryStats.
Which MongoDB performance troubleshooting metrics should I baseline first after upgrading?
A sound MongoDB performance troubleshooting baseline starts with three, in order: metrics.query.cbr (optimizer stability), peakTrackedMemBytes on your top-N query shapes (memory attribution), and oplogFetcherLagSeconds on every secondary (lag attribution). Each is new since MongoDB 8.3 and each replaces an inference with a measurement.
Can I still use index filters to pin plans?
For MongoDB performance troubleshooting on 8.x, index filters are deprecated since MongoDB 8.0. Use Query Settings (setQuerySettings / removeQuerySettings) — they persist across restarts, replicate cluster-wide, and are the supported mitigation for CBR-era plan regressions.
Do these techniques apply to MongoDB Atlas?
Largely yes — the MongoDB performance troubleshooting toolkit here is server-side: explain output, Query Settings, tracked-memory metrics, and spill accounting are server features, not Atlas features. What differs for MongoDB performance troubleshooting on Atlas is access to mongod configuration parameters and FTDC files; there you lean on Atlas Performance Advisor and the same explain-driven MongoDB performance troubleshooting workflow described above.
Final Thoughts
MongoDB 8.3 gives MongoDB performance troubleshooting the instrumentation the platform lacked for a decade: per-operation memory attribution, per-stage spill accounting, direct replication-lag measurement, and an observable optimizer. The cost of admission for MongoDB performance troubleshooting is a new plan-selection mechanism you must treat with the same respect as any relational optimizer upgrade — capture plans before, compare after, and pin shapes only with measurement in hand. That measurement-first discipline is the difference between MongoDB performance troubleshooting and guesswork.
If you are planning an 8.0 → 8.3 upgrade, fighting plan regressions, or need a production MongoDB health check against the baseline above, MinervaDB's MongoDB consulting and 24×7 enterprise-class database support teams do this daily across 900+ enterprise customers — with staged, reversible changes and a rollback path stated before anything touches production. Standard caveat applies to everything above: validate in staging, keep backups current, and maintain a tested DR posture before changing production systems.
Running MongoDB in production? MinervaDB provides MongoDB consulting and 24×7 MongoDB consultative support as part of its database consulting services.
Running this in production?
MinervaDB provides MongoDB Consulting, MongoDB Support, NoSQL Database Support and NoSQL Consulting with 24x7 coverage and a 15-minute S1 response. Talk to an engineer.