Every database engine eventually blames the operating system, and it is usually half right. The buffer pool is in memory the Linux kernel allocated, the fsync is a system call the kernel schedules, the threads that serve connections are scheduled by the kernel, and the disk queue the engine is waiting on is a kernel data structure. When the engine’s own counters run out, the next layer of evidence is Linux, and the difficulty is not that the evidence is missing but that each Linux tool sees a different slice of it and none of them sees the whole.
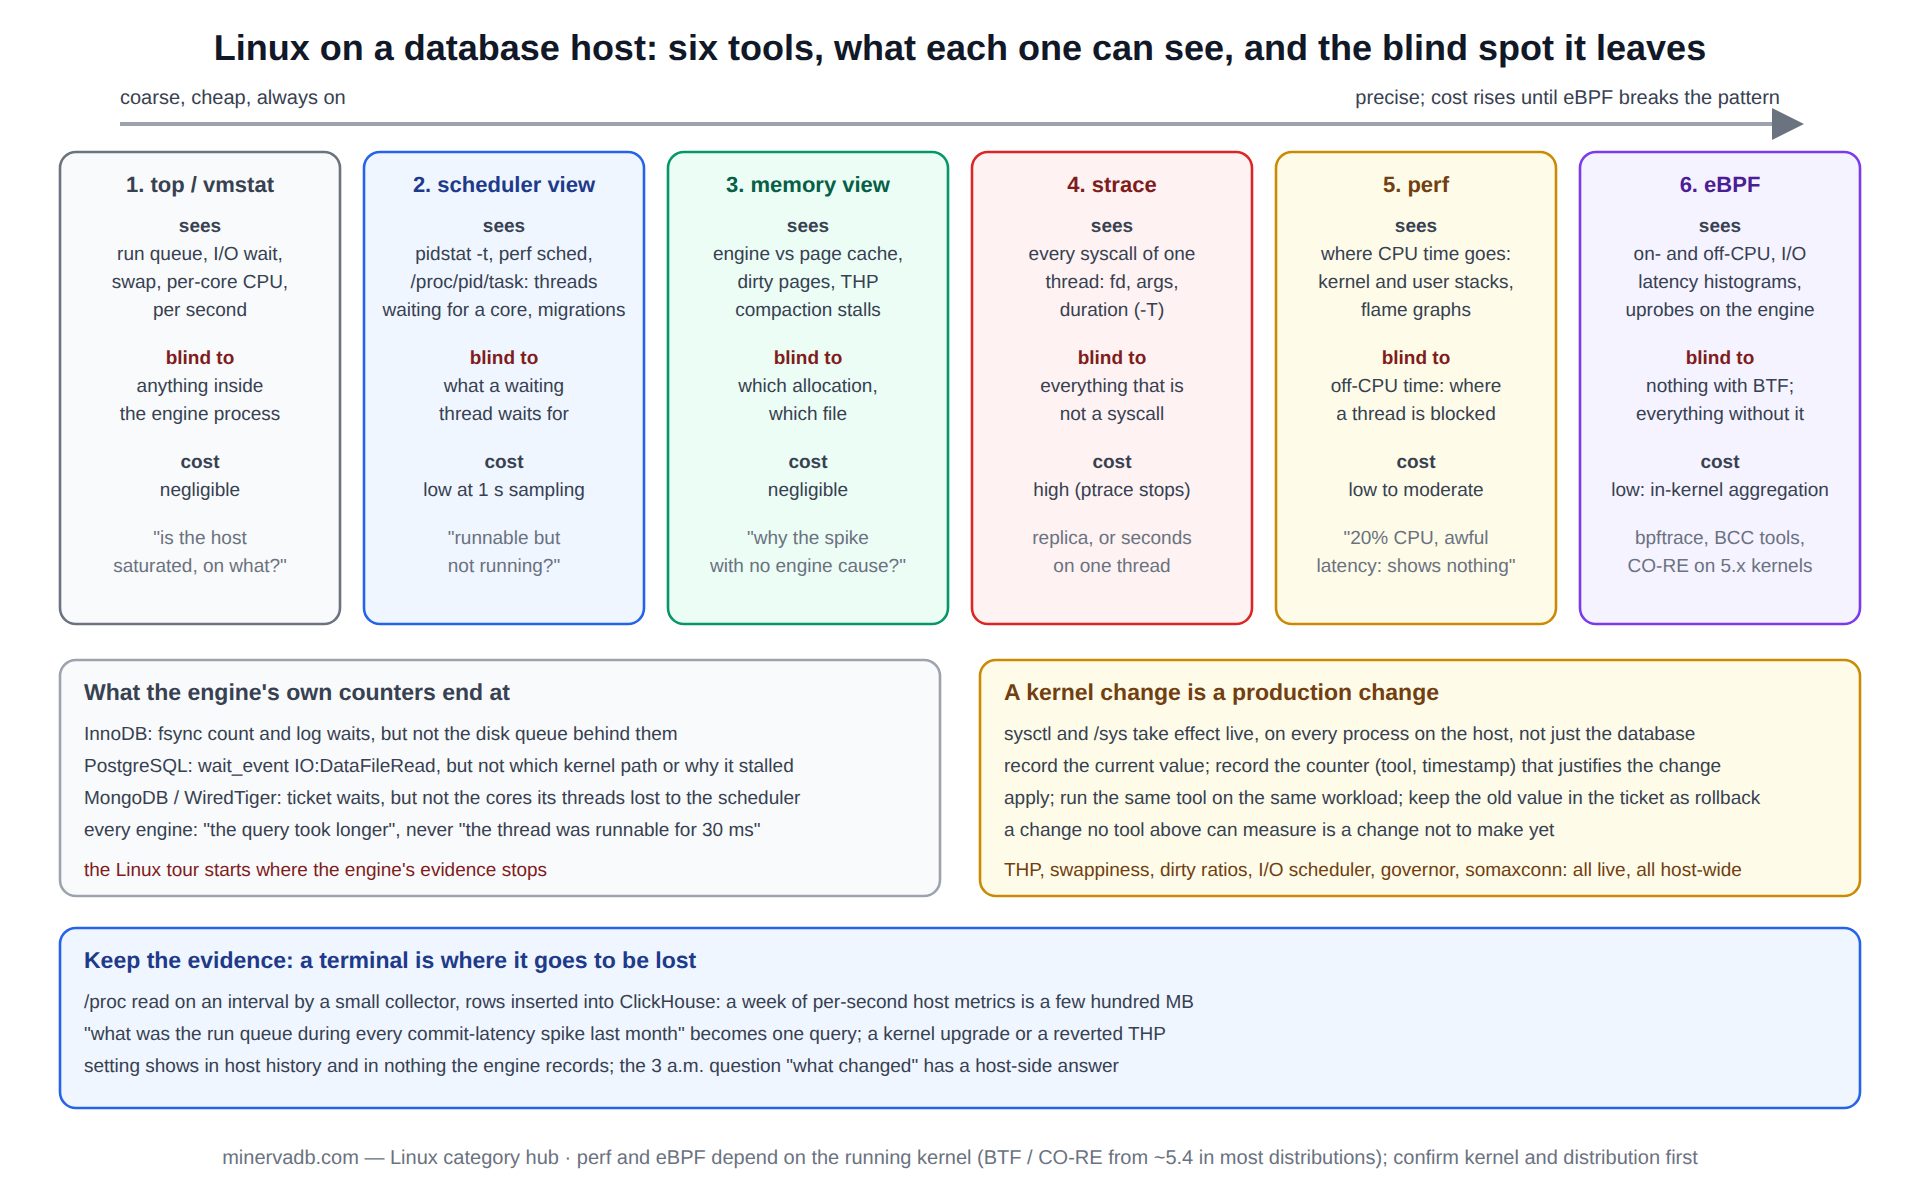
This page is a tour of the Linux performance toolset organised by what each tool can see and, just as importantly, what it cannot. Six tools are covered in the order an engineer reaches for them on a database server, from the coarse view of top and vmstat to the precise view of eBPF, and each section names the question the tool answers, the blind spot it leaves, and the archive post that shows it used on a real engine.
The archive it introduces covers thread scheduling and contention, CPU affinity, transparent huge pages, strace, queueing theory, kernel data structures and system calls, the eBPF webinars, and the Python collectors that ship Linux metrics into ClickHouse.
The principle behind the tour is that a database engineer needs Linux evidence at the same standard as engine evidence: a counter with a timestamp, from a tool whose blind spot is known, before any change to a running server. A kernel parameter changed on a guess is as dangerous as an engine parameter changed on a guess, and harder to roll back because it affects every process on the host.
Linux tool 1: top, vmstat and the view from a mile up
The first tools answer the coarsest question: is the host saturated, and on which resource. vmstat 1 shows the run queue (r), blocked processes (b), swap activity, and the CPU split between user, system, idle, and I/O wait, and it shows them per second, which is the resolution a database stall needs. top adds the per-process view and, with the 1 key, the per-core view that reveals a single thread pinned at 100 percent while the other cores idle.
The blind spot is everything inside the process. A MySQL server at 60 percent CPU with 40 percent I/O wait tells the engineer that the disk is involved and nothing about which query, which file, or which of the engine’s threads is waiting.
understanding and optimising CPU and I/O subsystem behaviour is the archive’s post on reading these two tools together and on the model of a database host as a set of queues that the rest of the tour refines. how queueing influences Linux performance is the theory behind it: a resource at 80 percent utilisation has a queue, and the queue length, not the utilisation, is what the query feels.
Linux tool 2: the scheduler view, threads and where they wait
The second question is what the engine’s threads are doing when they are not running. A database server is a process with hundreds or thousands of threads, and the kernel scheduler decides which of them gets a core and when. /proc/[pid]/task/*/status and /proc/[pid]/task/*/schedstat give the per-thread state and the time spent waiting on a run queue; perf sched gives the same as a timeline; pidstat -t 1 gives the per-thread CPU split at one-second resolution.
A thread that is runnable but not running is waiting for a core, and that wait is invisible to the engine, which only knows the query took longer.
The archive’s largest cluster is here. Linux thread contention: causes and solutions and how to troubleshoot thread contention on a Linux server are the diagnosis; configuring Linux threads for system performance and optimising Linux thread cache performance are the tuning side; real-time Linux thread performance monitoring is the collection. tuning Linux threads for MongoDB IOPS is the worked example on one engine, where WiredTiger’s thread pool and the kernel’s I/O threads compete for the same cores.
CPU affinity is the scheduler decision an operator can override, and it is the one most often overridden wrongly. MySQL performance with CPU affinity and priority management covers pinning the server to a NUMA node and the trade it makes: a pinned process never migrates, which removes cache misses on migration and also removes the scheduler’s ability to balance load. The measurement before pinning is the migration count in /proc/[pid]/sched (nr_migrations) and the NUMA miss ratio in numastat; without both, pinning is a guess.
Linux tool 3: memory, and the page cache the engine shares with the kernel
The third question is where memory went, and the answer on a database server is always split between the engine’s own allocation and the kernel’s page cache. free -m shows the split; /proc/meminfo shows it in detail, including the dirty pages the kernel has not yet written and the huge pages reserved. The engine’s buffer pool and the kernel’s page cache can hold the same data twice unless the engine opens its files with O_DIRECT, which is the flush-method decision on the InnoDB side and the shared_buffers-versus-page-cache decision on the PostgreSQL side.
Transparent huge pages are the memory setting that most often surprises a database. transparent huge pages and MySQL: how they hurt is the archive’s post on the khugepaged compaction stalls that appear as latency spikes with no engine cause, and on the difference between THP (disable for most engines) and explicit huge pages (enable for the buffer pool, sized exactly). The evidence is thp_fault_alloc and compact_stall in /proc/vmstat trending against the latency spikes; the setting is /sys/kernel/mm/transparent_hugepage/enabled, and the change takes effect without a restart but is not retroactive for pages already mapped.
# the three Linux counters a database stall usually shows in, sampled together (Linux 4.x+ / 5.x+)
# 1. run queue and I/O wait, per second
vmstat 1 5

# 2. per-thread CPU and voluntary/involuntary context switches for the engine's process
pidstat -t -w -u -p "$(pgrep -o -x mysqld)" 1 5

# 3. THP compaction stalls and dirty-page pressure, delta over ten seconds
for k in compact_stall thp_fault_alloc nr_dirty nr_writeback; do
  a=$(awk -v k="$k" '$1==k {print $2}' /proc/vmstat)
  sleep 10
  b=$(awk -v k="$k" '$1==k {print $2}' /proc/vmstat)
  echo "$k delta_10s=$((b - a))"
done

# where the engine's threads are blocked right now (kernel wait channel of every non-running thread, counted)
for t in /proc/"$(pgrep -o -x postgres)"/task/*; do
  s=$(awk '{print $3}' "$t"/stat); [ "$s" = "R" ] && continue
  echo "state=$s wchan=$(cat "$t"/wchan 2>/dev/null)"
done | sort | uniq -c | sort -rn | head -20
The last block is the cheapest version of the scheduler view: the wchan field names the kernel function each sleeping thread is waiting in, and a hundred threads in futex_wait_queue is a lock inside the engine while a hundred in io_schedule is the disk. It is a snapshot, not a trace, and it is where the fourth tool takes over.
Linux tool 4: strace, and the cost of watching
The fourth question is which system calls the engine is making and how long each takes, and strace answers it directly: attach to a thread, and every pread64, fsync, futex and sendto is printed with its arguments, return value and, with -T, its duration. annotating strace output for MySQL performance is the archive’s post on reading that output: which file descriptor is the redo log, which is the binary log, what a 40 ms fsync on the redo log means for commit latency.
The blind spot is the cost. strace uses ptrace, which stops the traced thread at every system call, and on a busy database thread the overhead can be an order of magnitude; the archive post is explicit that it is a tool for a replica or a staging server, or for one thread for a few seconds on production with the rollback being to detach.
how system calls are implemented in the Linux kernel explains why: the transition strace observes is the same transition it slows down. Python 3.12 perf profiling covers the application side of the same boundary, where a client library’s system calls are the latency the database is blamed for.
Linux tool 5: perf, and what the CPU is actually doing
The fifth question is where the CPU time goes when the engine is CPU-bound, and perf answers it by sampling the instruction pointer and unwinding the stack. perf top -p [pid] shows the hottest functions live; perf record -g followed by perf report or a flame graph shows the call paths. On a database server the surprising results are common: time in the kernel’s copy_user because the engine reads through the page cache, time in spin_lock because of a mutex the engine’s own counters do not name, time in the memory allocator because of a workload of short-lived large allocations.
The blind spot is the opposite of strace’s: perf sees where the CPU is busy and nothing about where a thread is blocked, so a server at 20 percent CPU with terrible latency shows almost nothing in a CPU profile. The two tools are complementary, and the archive’s kernel posts explain the structures both of them walk: how linked lists, queues, maps and trees are implemented in the Linux kernel is background for reading a kernel stack, since a database engineer who recognises rb_insert_color in a profile knows a red-black tree is being rebalanced, and can guess which one.
Linux tool 6: eBPF, the tool that sees both sides
The sixth tool answers the question the first five cannot answer together: for this thread, over this second, where did the time go, on-CPU and off-CPU, in the kernel and in the engine, with the arguments of the calls involved. eBPF programs attach to kernel tracepoints, kprobes and user-space uprobes without stopping the traced process, aggregate in kernel memory, and report summaries, so the overhead is a fraction of strace’s and the coverage is a superset of perf’s.
bpftrace one-liners and the BCC tools (biolatency, offcputime, runqlat, ext4slower) are the entry point; a uprobe on the engine’s own functions is the advanced use.
The archive’s eBPF posts start with using the pre-defined eBPF inspections for troubleshooting performance, the BCC tool catalogue applied to a database host, and continue with the two webinars, troubleshooting full-stack performance with BPF and Linux performance troubleshooting with eBPF, which walk a MySQL and a PostgreSQL latency problem from the symptom to the kernel function.
The blind spot of eBPF is the kernel version: CO-RE (compile once, run everywhere) needs BTF, which is present in most distribution kernels since 5.x but not in older enterprise kernels, and an eBPF tool that will not load on the production kernel is not a tool.
The six Linux tools, side by side
| Tool | Question it answers | What it cannot see | Cost on a production database host |
|---|---|---|---|
| 1. top / vmstat | Is the host saturated, and on which resource; run queue and I/O wait per second | Anything inside the engine process | Negligible; always on |
| 2. pidstat / perf sched / procfs | Which threads run, which wait for a core, how often they migrate | What a waiting thread is waiting for | Low; per-thread sampling at 1 s is safe |
| 3. free / meminfo / vmstat counters | Engine memory vs page cache; THP compaction stalls; dirty-page pressure | Which allocation or which file | Negligible |
| 4. strace | Every system call, with arguments and duration, for one thread | Anything that is not a system call; the whole process at once | High; replica or seconds only, one thread |
| 5. perf | Where CPU time goes, kernel and user, as a profile or flame graph | Where a thread is blocked (off-CPU time) | Low to moderate at default sample rates |
| 6. eBPF (bpftrace, BCC) | On- and off-CPU time, I/O latency histograms, uprobes on engine functions, aggregated in kernel | Nothing on a kernel with BTF; everything on one without | Low; aggregation in kernel, no process stop |
The order is the order of increasing precision and, until the last row, increasing cost; eBPF breaks the pattern, which is why it is the tool the archive spends the most time on.
Shipping Linux evidence somewhere it can be kept
Every tool above prints to a terminal, and a terminal is where evidence goes to be lost. The archive’s two collector posts are about keeping it: a Python script to monitor the Linux disk I/O matrix and save it in ClickHouse and a Python script to track Linux process memory in ClickHouse read /proc on an interval and insert rows into a columnar store, where a week of per-second host metrics is a few hundred megabytes and a question like “what was the run queue during every commit-latency spike last month” is one query.
The reason to keep Linux evidence is the same as the reason to keep engine evidence: the third question at 3 a.m. is what changed, and a host metric with no history cannot answer it. A kernel upgrade, a THP setting reverted by a configuration-management run, a new process on the host competing for cores: each of these shows in the host history and in nothing the engine records.
Linux changes on a database host: blast radius and rollback
The tour ends where it began, with the rule that a Linux change is a production change. The kernel parameters a database engineer most often touches (vm.swappiness, vm.dirty_ratio and vm.dirty_background_ratio, THP, the I/O scheduler, the CPU governor, net.core.somaxconn) all take effect without a restart through sysctl or /sys, which makes them easy to change and easy to change back, but every one of them affects every process on the host, and a change made for the database can starve the backup agent or the monitoring exporter beside it.
The procedure is the one the engine posts use: record the current value, record the evidence that justifies the change (the counter from the tool above, with a timestamp), apply the change, run the same tool again on the same workload, and keep the previous value in the ticket as the rollback. A change that cannot be measured by one of the six tools is a change that should not be made yet.
why CTOs choose MinervaDB for scalability is the archive’s statement of the standard from the customer’s side: the engineer who touches the kernel under a production database is expected to show the counter before and after.
Version notes: the tools above behave differently across kernel generations; perf and eBPF in particular depend on the running kernel’s features (BTF and CO-RE from roughly 5.4 in most distributions, later in enterprise kernels), and THP defaults differ between distributions and releases. Confirm the kernel version and the distribution before applying any setting from an archive post, test every kernel parameter change on a replica or staging host under production-shaped load, and keep the DR posture intact: a host-level change that degrades the replica’s ability to keep up is a recovery-time problem, not just a latency one.
Where this Linux archive sits
This archive is the host layer under every engine archive on minervadb.com. The eBPF archive goes deeper on the sixth tool, the InnoDB archive and monitoring archive are where the engine-side counters that this evidence complements are described, and the database performance tuning archive covers the cross-engine method that uses both. The kernel’s own reference for the counters named here is the Linux kernel documentation for the vm sysctl parameters.
For a host-level performance review of a database estate, an eBPF-based diagnosis of a latency problem the engine’s counters cannot explain, or 24×7 support in which the on-call engineer is expected to read Linux evidence at the same standard as engine evidence, the MinervaDB database consulting practice runs this tour on the customer’s hosts, and states for every recommendation which tool produced the counter behind it.