Ask three teams in the same company for last quarter's net revenue and you will usually get three numbers. Finance excludes returns booked after period close, marketing counts gross of discounts because that is what the ad platforms report, and the product dashboard was built by someone who has since left and nobody knows which one it uses. None of them is wrong by its own definition.
The problem is that the definitions live in four places, each written in a different dialect of SQL, and every dashboard, model and board slide picks one at random. A metrics layer exists to end that: one definition per number, expressed once, compiled into every query that asks for it.
This post is about the metrics layer we build on dbt for customers whose analytics run on PostgreSQL, ClickHouse, Snowflake, BigQuery or Databricks. It is not a tool comparison. It walks the metrics layer from the metrics tree that names what matters, through the semantic models and metric definitions that make each number reproducible, to the contract tests that catch silent drift, the serving paths into BI and decision APIs, and the operating discipline that keeps the definitions stable after the people who wrote them have moved on.
Every example is runnable against dbt Core 1.6 or later with MetricFlow; where dbt Cloud's hosted Semantic Layer differs, we say so. Figures are illustrative unless a measurement source is named.
Start with the metrics tree, not the tool
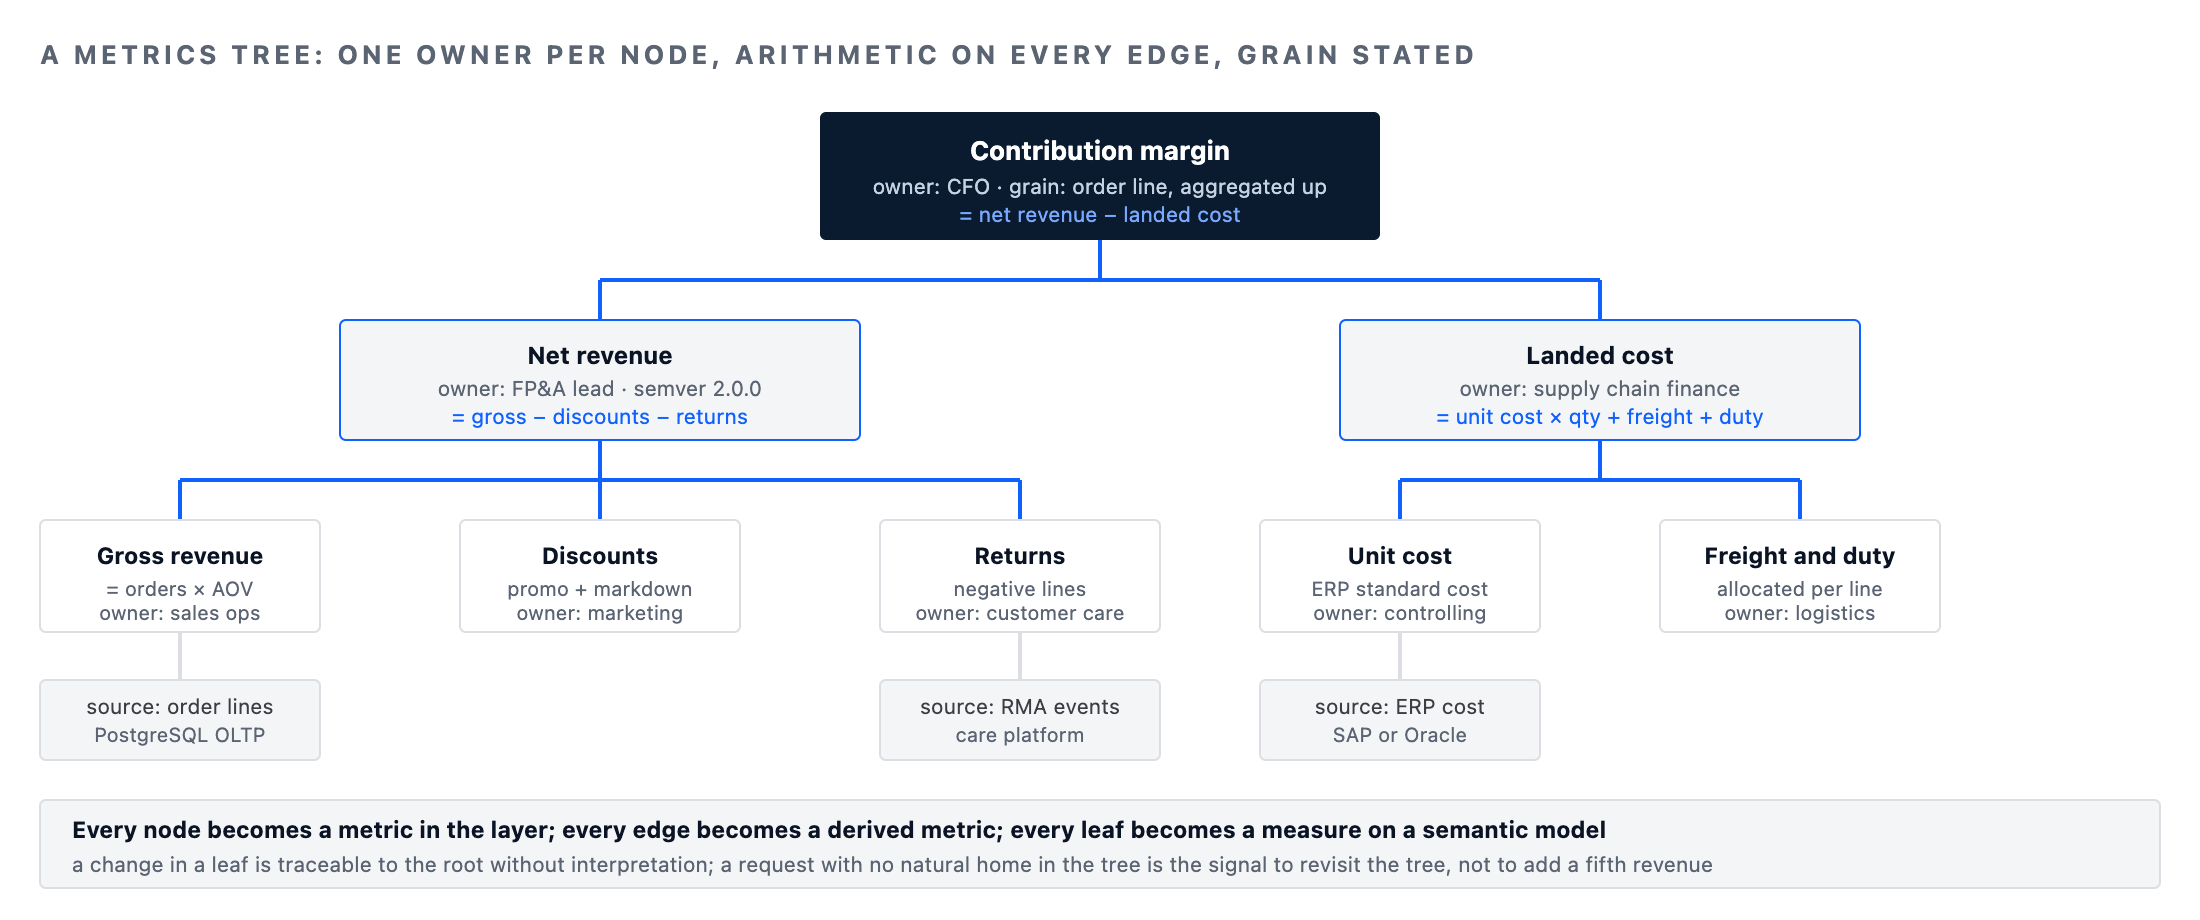
A metrics layer that begins with YAML ends up encoding whatever the last dashboard happened to compute. The work starts on a whiteboard with the executive who owns the number. The top of the tree is the one figure the business steers by, typically contribution margin, net revenue retention or active customers on a defined cadence. Each branch decomposes it arithmetically into inputs that a specific team can move: net revenue is orders times average order value less discounts less returns; active customers is new plus retained less churned. The leaves are things a source system records directly.
Three rules make the tree usable as the spine of a metrics layer. Every node has exactly one owner, a named person rather than a team. Every edge is an arithmetic relationship, so a change in a leaf is traceable to its effect at the top without interpretation. And every node carries the grain at which it is true: net revenue is defined per order line and aggregated upward, not defined at the monthly total and allocated downward. The grain decision is the one that later determines whether the metrics layer can answer a question by store, by cohort or by campaign without a new definition.
The semantic model is where the grain becomes enforceable
In dbt's metrics layer, the semantic model is the contract between a physical table and every metric derived from it. It declares the entities the table can join on, the dimensions it can be sliced by, and the measures that can be aggregated, each with its aggregation type fixed. A measure declared as a sum cannot later be averaged by a dashboard author who did not read the tree. That constraint is the point: the metrics layer removes the freedom that produced four versions of revenue.
# models/marts/semantic/sem_order_line.yml  (dbt Core 1.6+, MetricFlow)
semantic_models:
  - name: order_line
    description: One row per order line; returns are negative lines referencing the original.
    model: ref('fct_order_line')
    defaults:
      agg_time_dimension: order_date
    entities:
      - name: order_line
        type: primary
        expr: order_line_id
      - name: customer
        type: foreign
        expr: customer_id
      - name: product
        type: foreign
        expr: product_id
      - name: location
        type: foreign
        expr: location_id
    dimensions:
      - name: order_date
        type: time
        type_params:
          time_granularity: day
      - name: channel
        type: categorical
      - name: is_return
        type: categorical
    measures:
      - name: gross_revenue
        agg: sum
        expr: gross_amount
      - name: discount_amount
        agg: sum
      - name: return_amount
        agg: sum
        expr: CASE WHEN is_return THEN ABS(net_amount) ELSE 0 END
      - name: net_revenue
        agg: sum
        expr: net_amount
      - name: order_count
        agg: count_distinct
        expr: order_id
      - name: contribution_margin
        agg: sum
        expr: net_amount - landed_cost
Two details carry most of the value. The agg_time_dimension default means every metric built on this model is time-bounded the same way; nobody accidentally reports revenue by ship date in one chart and order date in another. And return_amount is a measure with its own expression rather than a filter the analyst has to remember, so the difference between gross and net is encoded once. When finance asks why the metrics layer reports a different net revenue from the ledger, the answer is a diff between two expressions, not an archaeology project.
Metric definitions: four kinds, and when each is the right one
MetricFlow gives the metrics layer four metric types, and choosing the wrong one is the most common defect we find in review. A simple metric aggregates one measure. A ratio divides two, and the division happens after aggregation, which is what makes an average order value slice correctly by channel. A derived metric is an expression over other metrics, which is how the tree's arithmetic is written down. A cumulative metric accumulates over a window, which is how trailing 30-day revenue or active customers on a rolling basis is defined without every dashboard hand-rolling a window function differently.
# models/marts/semantic/metrics_revenue.yml
metrics:
  - name: net_revenue
    label: Net revenue
    type: simple
    type_params:
      measure: net_revenue
    meta:
      owner: fp&a-lead@example.com
      tree_node: revenue.net
      semver: 2.0.0

  - name: gross_revenue
    type: simple
    type_params:
      measure: gross_revenue
  - name: return_amount
    type: simple
    type_params:
      measure: return_amount
  - name: order_count
    type: simple
    type_params:
      measure: order_count
  - name: contribution_margin
    type: simple
    type_params:
      measure: contribution_margin

  # ratio and derived metrics reference metrics, never measures
  - name: average_order_value
    label: Average order value
    type: ratio
    type_params:
      numerator: net_revenue
      denominator: order_count

  - name: return_rate
    label: Return rate
    type: ratio
    type_params:
      numerator: return_amount
      denominator: gross_revenue

  - name: contribution_margin_pct
    label: Contribution margin %
    type: derived
    type_params:
      expr: contribution_margin / net_revenue
      metrics:
        - name: contribution_margin
        - name: net_revenue

  - name: net_revenue_t30d
    label: Net revenue, trailing 30 days
    type: cumulative
    type_params:
      measure: net_revenue
      window: 30 days
The meta block is not decoration. Owner, tree node and semantic version are what the governance section later depends on, and they are what a metrics layer needs to answer "who changed this and when" without reading git history. Version 2.0.0 on net revenue records that the definition changed incompatibly once, which is exactly the fact a board deck from last year needs stated beside it.
Compiling the metrics layer: what the SQL actually looks like
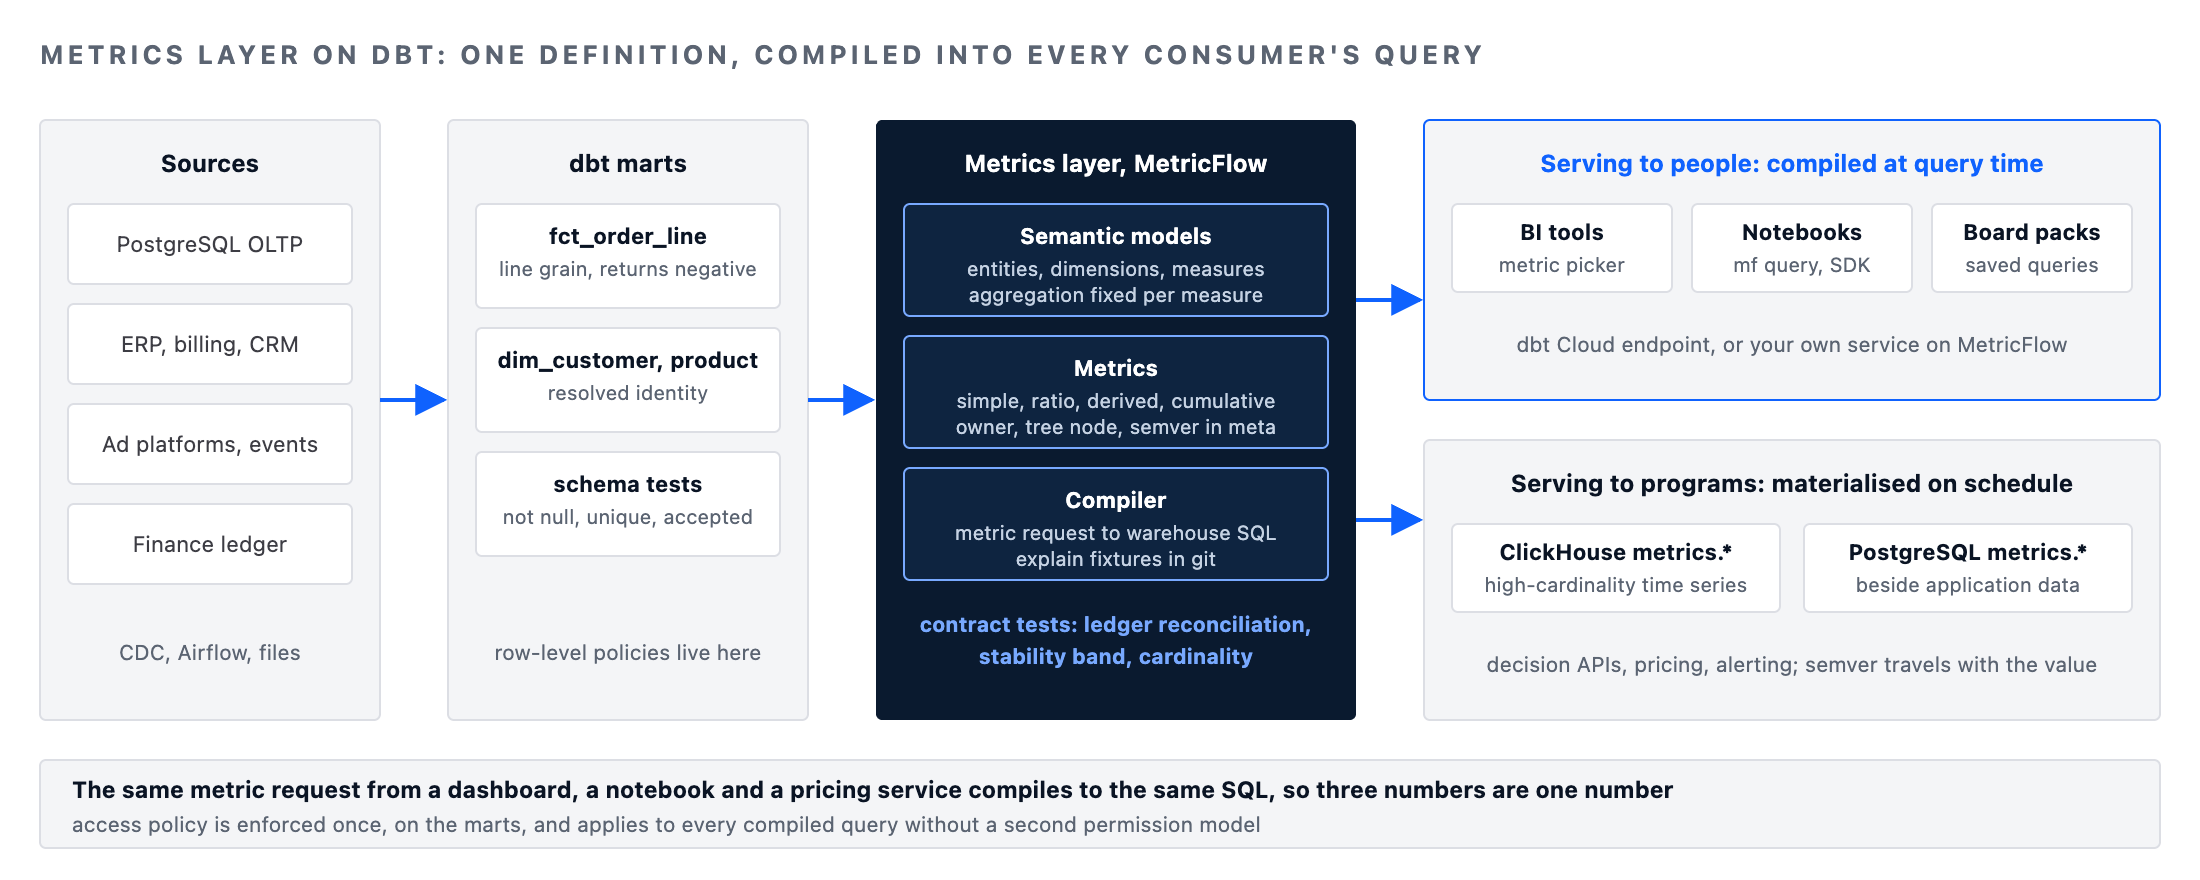
The reason a metrics layer on dbt is more than documentation is that MetricFlow compiles a metric request into SQL for the target warehouse. A request for net revenue and return rate by channel for the last full month becomes one query with the joins, the time bounding and the post-aggregation division written by the compiler, not the analyst. The same request from a BI tool, a notebook and a decision API produces the same SQL, so the three numbers are one number.
mf query \
  --metrics net_revenue,return_rate,average_order_value \
  --group-by metric_time__month,order_line__channel \
  --where "{{ TimeDimension('metric_time', 'month') }} = '2026-08-01'" \
  --order -net_revenue \
  --explain
The --explain flag prints the generated SQL, and we keep those explains in the repository as fixtures. A change to a semantic model that alters the compiled SQL for a saved query shows up as a diff in code review rather than as a surprised finance controller two weeks later. On PostgreSQL we read the compiled SQL through EXPLAIN (ANALYZE, BUFFERS) to confirm the join order and the aggregate strategy before the query is exposed to a dashboard; on ClickHouse, EXPLAIN PIPELINE and system.query_log tell us whether the compiled aggregate is hitting a projection or scanning the base table.
Serving the metrics layer to people and to programs
A metrics layer has two kinds of consumer and they want different things. People want a BI tool that lists metrics and dimensions by name and hides SQL; programs want a stable endpoint that returns the current value of a metric for one entity in tens of milliseconds. dbt Cloud's Semantic Layer serves the first through its JDBC and GraphQL interfaces and through integrations with Tableau, Hex, Mode and others. Open-source MetricFlow serves the same definitions but the serving endpoint is yours to build, and that is the version most of our customers run.
For the programmatic path we materialise the saved queries that decision systems need on a schedule, into ClickHouse for high-cardinality time series and into PostgreSQL where the consumer needs transactional reads alongside application data. The table below is what a materialised metric looks like when the consumer is a pricing service that must know a product's trailing 30-day return rate at request time.
-- ClickHouse 25.x+: materialised metrics-layer output for a decision API
CREATE TABLE metrics.product_t30d
(
    product_id        UInt64,
    as_of_date        Date,
    net_revenue_t30d  Decimal(18, 2),
    return_rate_t30d  Float64,
    order_count_t30d  UInt32,
    metric_semver     LowCardinality(String),
    computed_at       DateTime64(3, 'UTC') DEFAULT now64(3)
)
ENGINE = ReplicatedReplacingMergeTree(
    '/clickhouse/tables/{shard}/metrics/product_t30d',
    '{replica}',
    computed_at
)
PARTITION BY toYYYYMM(as_of_date)
ORDER BY (product_id, as_of_date)
SETTINGS index_granularity = 8192;

-- The dbt job writes here from the compiled saved query; consumers read the latest row
SELECT
    product_id,
    return_rate_t30d,
    metric_semver
FROM metrics.product_t30d FINAL
WHERE product_id = {product_id:UInt64}
  AND as_of_date = today() - 1;
The metric_semver column travels with the value. A pricing model trained on version 1.x of return rate can refuse version 2.x rather than silently consuming a number whose meaning changed. That is the same discipline we apply to features in a feature store architecture, and in practice the metrics layer and the feature store share a registry and an owner list.
Contract tests: how a metrics layer detects silent drift
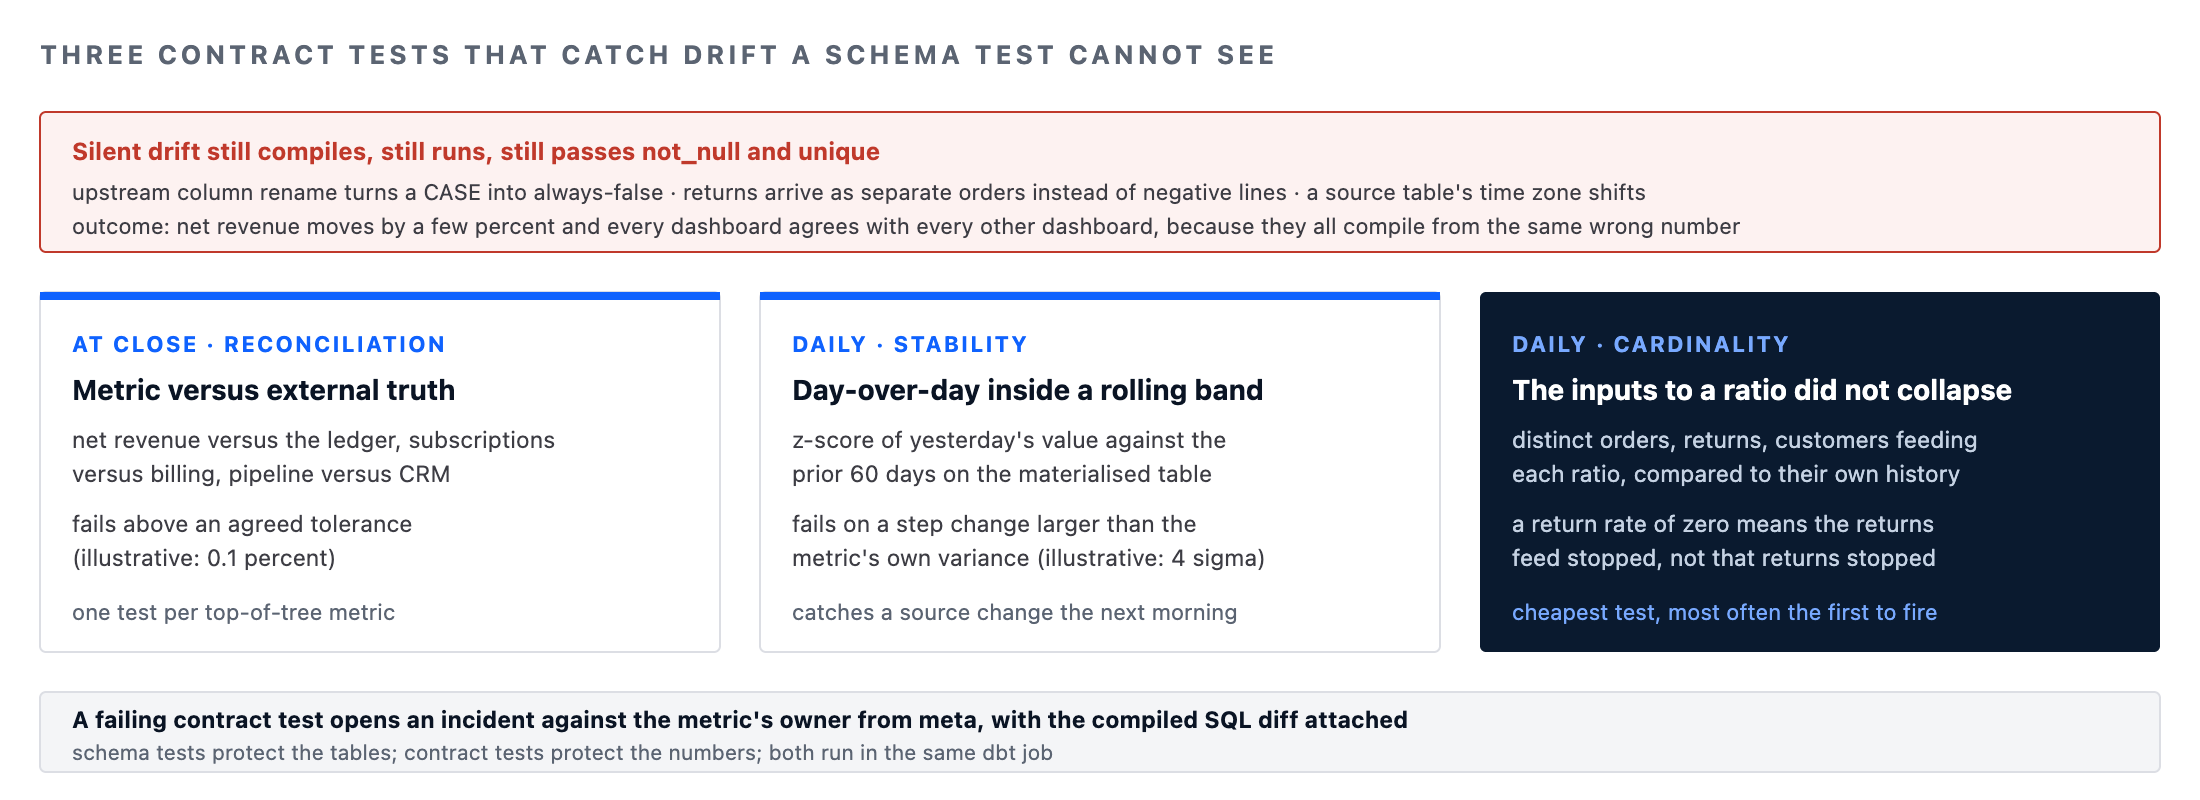
The failure that matters is not a broken build. It is a definition that still compiles, still runs, and quietly returns a different number. A column rename upstream that turns a CASE expression into always-false. A source that starts sending returns as separate orders instead of negative lines. A time zone change on a source table. None of these fail a dbt test on the physical model; all of them move a metric. So the metrics layer carries its own tests, and they test the numbers rather than the schema.
-- tests/metrics/assert_net_revenue_reconciles_to_ledger.sql
-- Fails if the metrics-layer net revenue for the last closed month differs from the
-- finance ledger by more than the agreed tolerance (illustrative: 0.1 percent).
WITH ml AS (
    SELECT
        DATE_TRUNC('month', order_date)  AS period,
        SUM(net_amount)                  AS net_revenue_ml
    FROM {{ ref('fct_order_line') }}
    WHERE order_date >= DATE_TRUNC('month', CURRENT_DATE) - INTERVAL '1 month'
      AND order_date <  DATE_TRUNC('month', CURRENT_DATE)
    GROUP BY 1
),
gl AS (
    SELECT
        period,
        SUM(amount) AS net_revenue_gl
    FROM {{ source('finance', 'gl_revenue_by_period') }}
    WHERE account_class = 'NET_REVENUE'
    GROUP BY 1
)
SELECT
    ml.period,
    ml.net_revenue_ml,
    gl.net_revenue_gl,
    ABS(ml.net_revenue_ml - gl.net_revenue_gl) / NULLIF(gl.net_revenue_gl, 0) AS variance_ratio
FROM ml
JOIN gl USING (period)
WHERE ABS(ml.net_revenue_ml - gl.net_revenue_gl) / NULLIF(gl.net_revenue_gl, 0) > 0.001;
That is the metrics layer reconciliation test, and every top-of-tree metric has one against whatever external truth exists: the ledger for revenue, the billing system for subscriptions, the CRM for pipeline. Below it sit two cheaper tests that run daily. A stability test compares each metric's day-over-day value to a rolling band and fails on a step change larger than the metric's normal variance, which is how a source-side change is caught the morning after rather than at month end. A cardinality test asserts that the entity counts feeding a ratio have not collapsed, because a return rate of zero usually means the returns feed stopped, not that customers stopped returning things.
-- ClickHouse: daily stability check on a materialised metric (illustrative band: 4 sigma)
WITH history AS
(
    SELECT
        as_of_date,
        sum(net_revenue_t30d)                            AS v
    FROM metrics.product_t30d FINAL
    WHERE as_of_date BETWEEN today() - 60 AND today() - 1
    GROUP BY as_of_date
),
stats AS
(
    SELECT
        avg(v)                                            AS mean_v,
        stddevPop(v)                                      AS sd_v
    FROM history
    WHERE as_of_date < today() - 1
)
SELECT
    h.as_of_date,
    h.v,
    s.mean_v,
    (h.v - s.mean_v) / nullIf(s.sd_v, 0)                  AS z_score
FROM history AS h
CROSS JOIN stats AS s
WHERE h.as_of_date = today() - 1
  AND abs((h.v - s.mean_v) / nullIf(s.sd_v, 0)) > 4;
Governance that outlives the authors
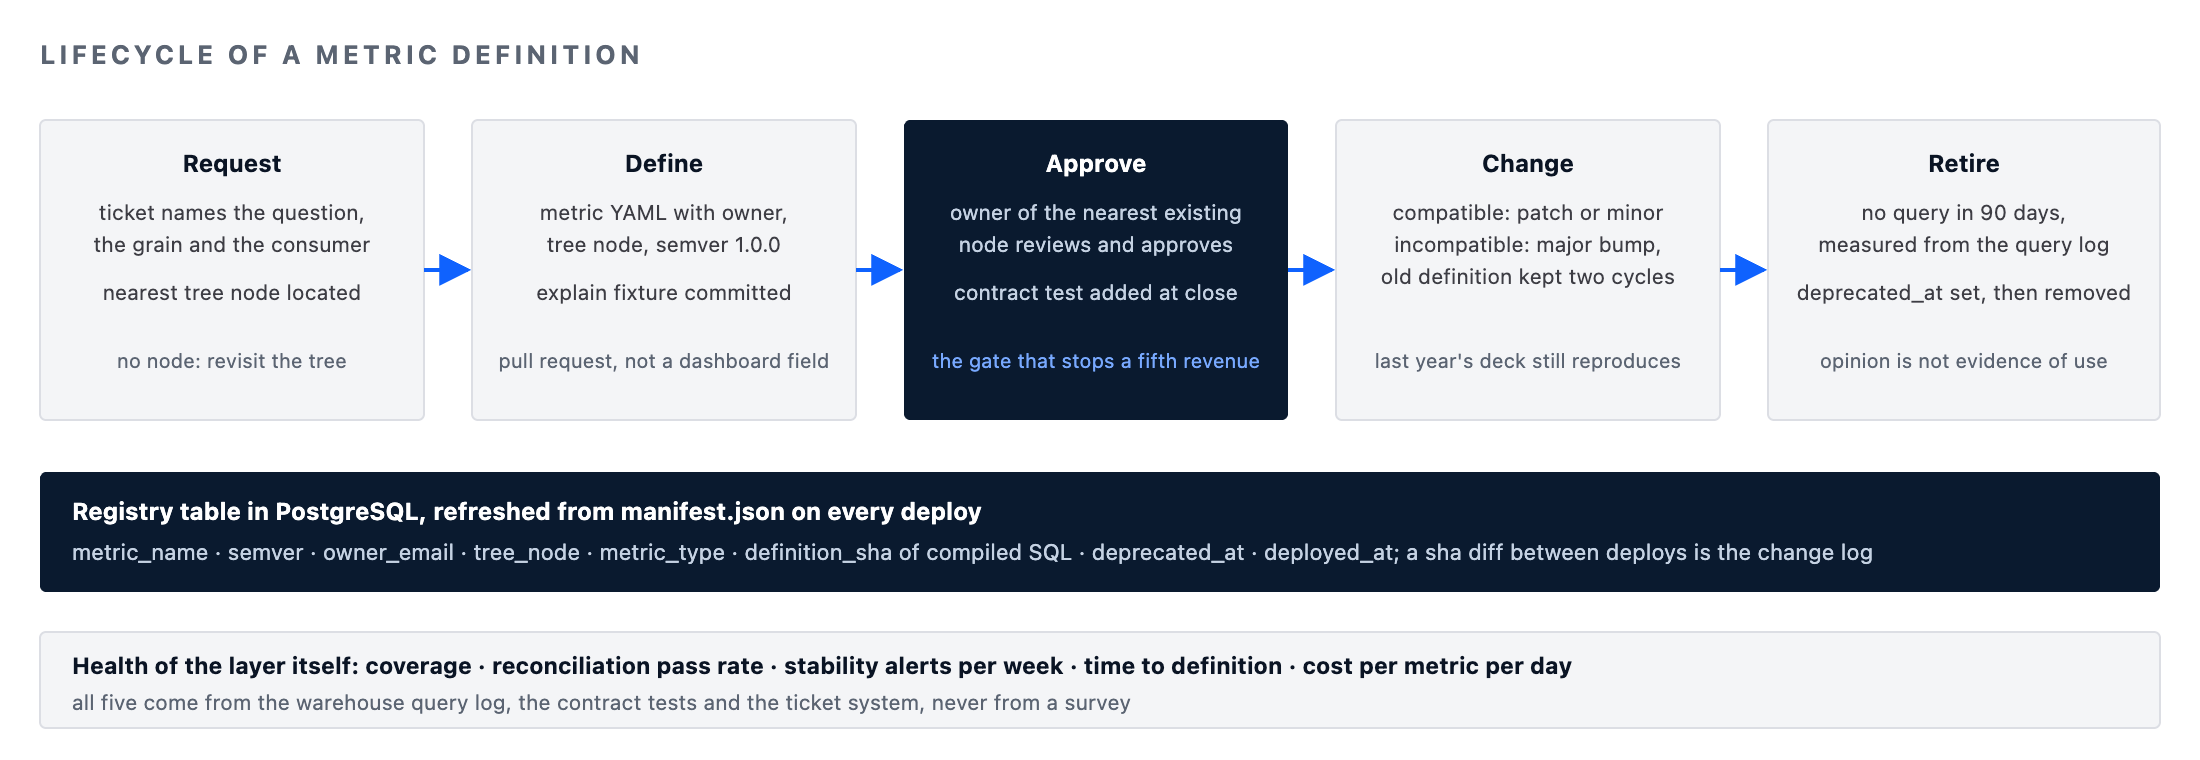
A metrics layer decays in a predictable way. A new analyst needs a variant of an existing metric, cannot find the owner, and defines a second one with a nearly identical name. Six months later there are four revenue metrics again, all in the same YAML. The defence is procedural and it is small.
Every metric has an owner in meta, and a pull request that adds a metric must be approved by the owner of the nearest existing node in the tree. Incompatible changes bump the major version and keep the old definition alive under a deprecated flag for two reporting cycles, so historical decks can be reproduced. A metric with no query in ninety days is a candidate for removal, and we measure that from the warehouse's query history rather than from opinion.
-- PostgreSQL 16+: metrics-layer registry snapshot, populated from dbt manifest.json on every deploy
CREATE TABLE metrics_registry (
    metric_name       TEXT        NOT NULL,
    semver            TEXT        NOT NULL,
    owner_email       TEXT        NOT NULL,
    tree_node         TEXT        NOT NULL,
    metric_type       TEXT        NOT NULL CHECK (metric_type IN ('simple','ratio','derived','cumulative')),
    definition_sha    TEXT        NOT NULL,   -- hash of the compiled SQL fixture
    deprecated_at     TIMESTAMPTZ,
    deployed_at       TIMESTAMPTZ NOT NULL DEFAULT now(),
    CONSTRAINT metrics_registry_pk PRIMARY KEY (metric_name, semver)
);

-- Which metrics changed compiled SQL between the last two deploys, and who owns them
SELECT
    cur.metric_name,
    cur.semver,
    cur.owner_email,
    prev.definition_sha  AS previous_sha,
    cur.definition_sha   AS current_sha
FROM metrics_registry AS cur
JOIN LATERAL (
    SELECT definition_sha
    FROM metrics_registry AS p
    WHERE p.metric_name = cur.metric_name
      AND p.deployed_at < cur.deployed_at
    ORDER BY p.deployed_at DESC
    LIMIT 1
) AS prev ON TRUE
WHERE cur.deployed_at = (SELECT MAX(deployed_at) FROM metrics_registry)
  AND cur.definition_sha <> prev.definition_sha;
Access in a metrics layer follows the tree as well. Row-level policies on the physical models restrict which locations or business units a user can see, and because every metrics layer query compiles down to those models, the policy applies to a metric request exactly as it applies to a raw query. There is no separate permission model to keep in sync, which is one of the stronger arguments for compiling metrics into warehouse SQL rather than serving them from a separate cache.
What to measure about the metrics layer itself
The metrics layer is a production system and it earns its keep in four numbers. Coverage is the share of dashboard and notebook queries that go through a metric rather than hand-written SQL against the marts, measured from the warehouse query log by tagging compiled queries with a comment. Reconciliation pass rate is the share of top-of-tree metrics that reconciled within tolerance on the last close.
Time to definition is how long a request for a new metric takes from ticket to merged pull request, which is the number that tells you whether the governance is a gate or a bottleneck. And compiled query cost, per metric per day, from system.query_log or the warehouse billing export, is what stops a cumulative metric over a year of order lines from quietly becoming the most expensive query in the estate.
| Metrics layer signal | Where it comes from | What a bad reading usually means |
|---|---|---|
| Coverage | Query log: share of mart queries carrying the compiler's comment tag | Analysts are bypassing the layer; a needed dimension or metric is missing |
| Reconciliation pass rate | Ledger, billing and CRM contract tests at close | A source change or a definition drift reached the top of the tree |
| Stability alerts per week | Daily z-score checks on materialised metrics | Upstream feed stopped, time zone shifted, returns encoded differently |
| Time to definition | Ticket opened to pull request merged | Owners unreachable or the tree has no natural home for the request |
| Cost per metric per day | system.query_log, warehouse billing export, tagged by metric | A cumulative window over unpartitioned history; missing projection or clustering |
Where a dbt metrics layer is the wrong answer
Three cases push a metrics layer elsewhere. Estates standardised on Looker already have a metrics layer in LookML, and the right move is to make LookML the single definition and generate from it rather than run two. Sub-second, high-concurrency serving of metrics to an application, thousands of requests a second with caching and access control at the API, is what Cube and similar semantic-layer servers are built for; dbt defines the metric and Cube serves it, and that combination is coherent.
A team with fewer than twenty metrics and one analyst does not need any of this yet; a single well-tested dbt mart with documented columns is the metrics layer, and the tree can live in the README until the second analyst arrives.
What does not change across those cases is the order of work: tree first, grain enforced in the semantic model, definitions versioned with owners, contract tests against external truth, and the layer's own health measured from the query log. Tools implement that order; they do not replace it.
Metrics layer: questions we are asked most
Does this replace our BI tool's calculated fields? It should replace the ones that define business metrics. Presentation-level calculations, a percentage of column total or a running rank inside one chart, can stay in the tool. If a calculated field has a business owner, it belongs in the metrics layer.
How does the metrics layer handle late-arriving data and restatements? By reprocessing the affected periods and bumping nothing. A restatement changes the value, not the definition, and the materialised tables carry computed_at so a consumer can see that yesterday's figure for July was recomputed. Definition changes bump the semantic version; data corrections do not.
Can the same definitions serve ClickHouse and Snowflake? Yes. MetricFlow compiles to the dialect of the configured adapter, and a project can target both from one set of semantic models. The compiled SQL differs, which is why the explain fixtures are kept per target and why the reconciliation test runs on each.
What about dbt Cloud versus open-source MetricFlow? The definitions are identical. dbt Cloud adds the hosted query endpoint, caching, and the BI integrations; open-source MetricFlow gives you the compiler and leaves serving to you. Most of our customers run open source and materialise saved queries into ClickHouse or PostgreSQL, which is the pattern in this post.
Working with MinervaDB on a metrics layer
Metrics layer design and build sits inside our decision intelligence practice, usually starting with a two-week engagement that produces the metrics tree with named owners, the semantic models for the top of the tree, and the reconciliation tests against finance. It pairs naturally with our data strategy and analytics work, where the tree is the artefact that turns a strategy into something a warehouse can enforce, and with data governance, where ownership and versioning are the same discipline applied to master data.
The serving tiers run on the PostgreSQL and ClickHouse estates our 24×7 support teams already operate, with the coverage, reconciliation and cost signals above carried into managed operations under our standard S1 to S4 response commitments. As always: test every model, test and setting shown here against your own data before applying it to production, and keep a tested restore posture for the warehouse and the registry alike.
Running this in production?
MinervaDB provides ClickHouse Consulting, Data Strategy and Analytics Consulting, Data Analytics Platform Engineering and PostgreSQL Consulting with 24x7 coverage and a 15-minute S1 response. Talk to an engineer.