A data warehousing bill is the most honest document a platform produces, and almost nobody reads it as one. The invoice from Snowflake, Redshift, BigQuery or Databricks is a line-by-line account of every decision the engineering team made about storage layout, query shape, concurrency, scheduling and idle time, converted into currency at the vendor’s rate. Read that way, a warehouse bill is a performance review with a price on each finding, and the same reading tells which of the findings are worth acting on.
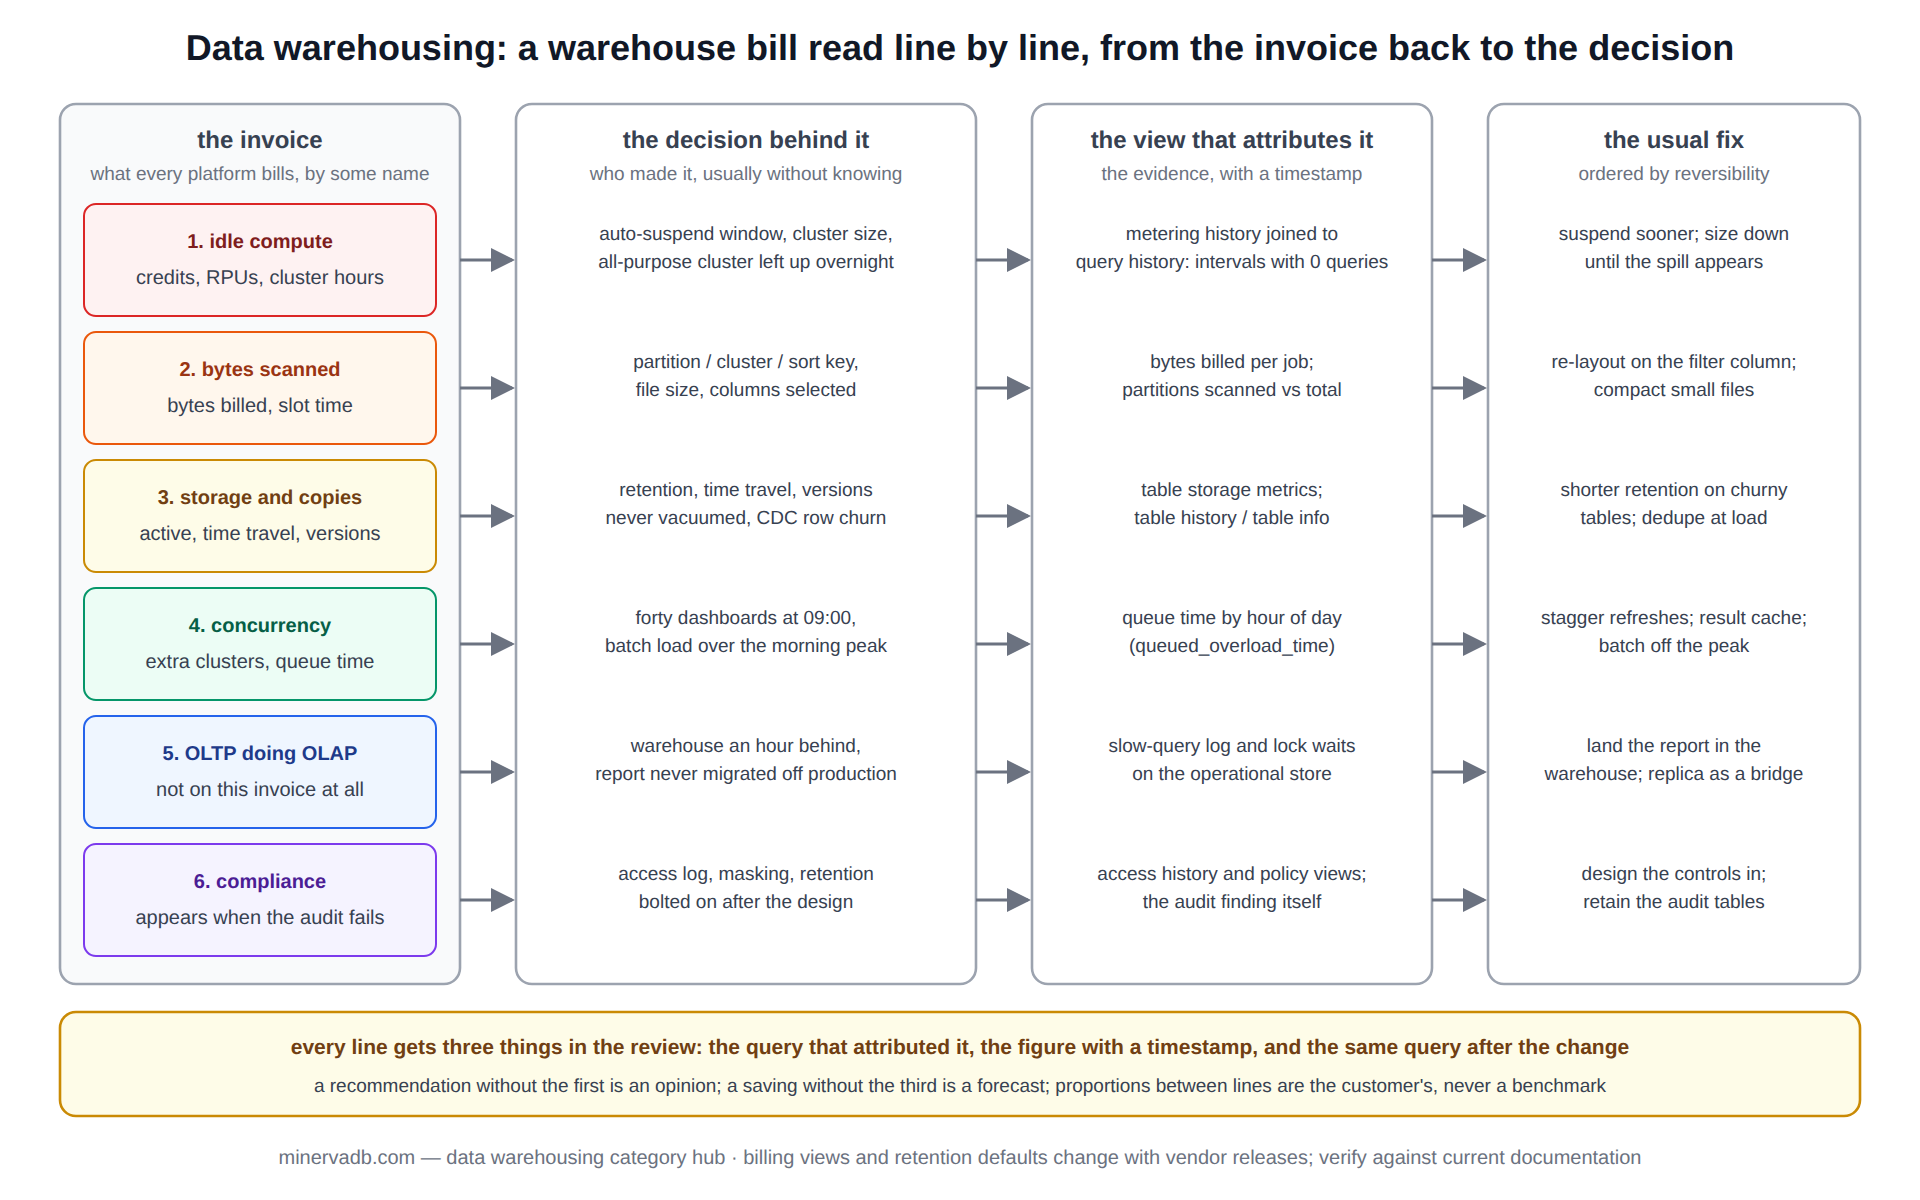
This page reads a warehouse bill line by line. Each section takes one line item that every data warehousing platform charges for under some name (compute seconds, scanned bytes, stored bytes, egress, concurrency, idle capacity), explains what engineering decision produced it, names the system table or billing view that attributes it, and links the archive post that shows how to reduce it. It is the method MinervaDB uses on a warehouse cost review, and it works the same on an on-premises warehouse where the currency is hardware and licence rather than credits.
The archive it introduces covers Snowflake rightsizing and cost reduction, BigQuery compliance, Redshift and Vertica, Databricks partitioning and bottlenecks, the retail and CPG analytics stacks, and the operational databases that feed a warehouse, from PostgreSQL checkpoints to MongoDB, MariaDB, TiDB, Cosmos DB and Milvus.
Line 1 of the data warehousing bill: compute seconds nobody was using
The largest line on most warehouse bills is compute that ran while no query needed it. On Snowflake it is a warehouse whose auto-suspend is set to ten minutes when the query pattern has three-second gaps; on Redshift it is a provisioned cluster sized for the month-end batch and idle the other twenty-nine days; on Databricks it is an all-purpose cluster left up overnight. The attribution is direct: SNOWFLAKE.ACCOUNT_USAGE.WAREHOUSE_METERING_HISTORY against QUERY_HISTORY shows credits billed in intervals with no queries, and Redshift’s SYS_QUERY_HISTORY shows the same gaps against the cluster’s hourly rate.
reducing Snowflake costs is the archive’s post on this line, and rightsizing Snowflake from XL to XS is the companion on the size axis: a warehouse one size too large costs double for a query that was not compute-bound in the first place. The test that decides whether a size change is safe is the query’s spill to local and remote storage, which is in QUERY_HISTORY as BYTES_SPILLED_TO_LOCAL_STORAGE; a query that does not spill at the smaller size was over-provisioned at the larger one.
Line 2 of the data warehousing bill: bytes scanned that the query did not need
On a warehouse billed by scanned bytes (BigQuery on-demand) the second line is literal; on the others it is the compute time spent reading columns and partitions the query filters out anyway. The engineering decision behind it is the physical layout: partition or cluster key, sort key, column order and file size. A query that reads a year of data to answer a question about last Tuesday is paying for 364 days of I/O.
The attribution is the query profile. BigQuery’s INFORMATION_SCHEMA.JOBS gives total_bytes_billed per job; Snowflake’s profile shows partitions scanned against partitions total; Redshift’s SVL_QUERY_SUMMARY shows rows scanned per step. Databricks repartitioning for performance is the archive’s post on layout in the lakehouse, where file count and file size decide the same line, and Databricks performance bottlenecks covers what happens when the layout is wrong: shuffles, skew and spills that all appear as compute time.
Vertica index usage and troubleshooting is the on-premises version of the same line, where projections play the role that clustering plays in the cloud, and the currency is the hours a node spends reading the wrong projection.
-- the compute line, attributed: Snowflake credits billed in intervals with no query running (illustrative)
SELECT m.warehouse_name,
       m.start_time,
       m.credits_used,
       COUNT(q.query_id) AS queries_in_interval
FROM   snowflake.account_usage.warehouse_metering_history AS m
LEFT JOIN snowflake.account_usage.query_history AS q
       ON  q.warehouse_name = m.warehouse_name
       AND q.start_time >= m.start_time
       AND m.end_time   >  q.start_time
WHERE  m.start_time >= DATEADD(day, -30, CURRENT_TIMESTAMP())
GROUP  BY m.warehouse_name, m.start_time, m.credits_used
HAVING COUNT(q.query_id) = 0
ORDER  BY m.credits_used DESC
LIMIT  50;

-- the scan line, attributed: BigQuery jobs ranked by bytes billed, with the table they read most
SELECT user_email,
       job_id,
       total_bytes_billed / POW(1024, 3) AS gib_billed,
       total_slot_ms / 1000              AS slot_seconds,
       referenced_tables[SAFE_OFFSET(0)].table_id AS first_table
FROM   `region-us`.INFORMATION_SCHEMA.JOBS
WHERE  creation_time >= TIMESTAMP_SUB(CURRENT_TIMESTAMP(), INTERVAL 30 DAY)
  AND  job_type = 'QUERY'
ORDER  BY total_bytes_billed DESC
LIMIT  50;
Both queries are illustrative shapes; column names and the billing views differ by edition and change with releases, and the account-usage views on Snowflake lag by up to a few hours. The point of running them is not the number but the ranking: the top ten rows of each are where the next month’s savings are.
Line 3 of the data warehousing bill: storage, and the copies of storage
Storage is the cheapest line per byte and the one that grows without anyone deciding it should. Time travel and fail-safe retention on Snowflake multiply the bytes of a frequently rewritten table; Delta Lake keeps every version until VACUUM runs; Redshift charges for the RA3 managed storage that a dropped table’s snapshot still occupies. The attribution is TABLE_STORAGE_METRICS on Snowflake (active bytes against time-travel and fail-safe bytes), DESCRIBE HISTORY and DESCRIBE DETAIL on Delta, and SVV_TABLE_INFO on Redshift.
The archive’s data warehousing posts on the sources of that storage are the ones about the operational databases that feed it: PostgreSQL checkpoint tuning and safely upgrading PostgreSQL extensions for the transactional side, MongoDB performance tuning from 1 ms to 100 microseconds for the document side, and tuning MariaDB for cloud and containers. A change-data-capture pipeline from any of them lands every update as a new row version in the warehouse, and the storage line is where that shows.
Line 4 of the data warehousing bill: concurrency and the queue
The fourth line is the cost of queries waiting. On Snowflake it is the multi-cluster warehouse spinning up a second cluster because the first one queued; on Redshift it is the concurrency-scaling cluster billed per second after the free hour; on BigQuery it is slot contention that lengthens every job. The engineering decision behind it is scheduling: forty dashboards refreshing at 9:00 on the hour, a batch load overlapping the morning peak, a BI tool with no query result cache.
The attribution is queue time in the query history, QUEUED_OVERLOAD_TIME on Snowflake and queue_start_time against exec_start_time on Redshift, plotted by hour of day. The fix is almost always to move work, not to buy capacity, and TiDB performance troubleshooting and Azure Cosmos DB performance are the archive’s posts on the same queue in HTAP and document engines, where request units and TiFlash replicas are the equivalent currency.
Line 5 of the data warehousing bill: the operational store doing the warehouse’s job
Some of the most expensive warehouse queries are not on the warehouse bill at all: they are analytical queries running against the production OLTP database because the warehouse is an hour behind or the report was never migrated. The cost appears as a larger RDS instance, a replica added for reporting, or a lock wait in the checkout path at month end. understanding database locking is the archive’s post on what an analytical scan does to a transactional workload.
The vector and search workloads are the newest version of this line. troubleshooting Milvus performance covers the index-build and segment-compaction costs that a vector store adds, and the decision of whether embeddings belong beside the warehouse or beside the application is the same decision as any other data placement: measure the query, price both homes.
Line 6 of the data warehousing bill: compliance and the audit trail
Compliance is a line that does not appear on the invoice until an audit fails, at which point it is the largest one. Access logging, column-level masking, retention enforcement and a provable lineage all cost compute and storage on every platform, and the cheapest way to pay for them is to design them in. the BigQuery SOX compliance checklist is the archive’s post on what that looks like on one platform, and its twelve controls translate to the others: access history views, policy tags or masking policies, and object-level audit tables that are themselves retained.
The data warehousing bill, side by side
| Line item | Engineering decision behind it | Attribution (system table or view) | Usual fix |
|---|---|---|---|
| 1. Idle compute | Auto-suspend, cluster sizing, all-purpose clusters left up | Metering history joined to query history; cluster uptime vs query time | Suspend sooner, size down until the spill appears, schedule the cluster |
| 2. Bytes scanned | Partition / cluster / sort key, file size, column order | Bytes billed, partitions scanned vs total, rows scanned per step | Re-layout on the filter column; compact small files; prune columns |
| 3. Storage and copies | Retention, time travel, versions never vacuumed, CDC row churn | Table storage metrics, table history, table info views | Shorter retention on churny tables; scheduled vacuum; dedupe at load |
| 4. Concurrency | Scheduling: peaks at the hour, batch overlapping BI | Queue time by hour of day | Stagger refreshes, result cache, move batch off the peak |
| 5. OLTP doing OLAP | Warehouse lag, reports never migrated | Slow-query log and lock waits on the operational store | Land the report in the warehouse; a read replica only as a bridge |
| 6. Compliance | Audit, masking, retention bolted on late | Access history and policy views; the audit finding itself | Design the controls in; retain the audit tables |
The proportions between the lines differ by platform and by workload, and the figures a review produces are the customer’s, never a benchmark; the table is the reading order, not a set of expectations.
Data warehousing for retail and CPG: where the lines come from
The archive’s industry posts show what produces each line in a real stack. the modern retail data analytics stack describes the pipeline from point-of-sale and e-commerce events through the warehouse to the dashboards, and every stage of it is one of the lines above: the CDC feed is line 3, the hourly dashboards are line 4, the SKU-level scans are line 2. dynamic assortment planning with Databricks is the workload-shaped view, where the model training run is the compute line and the feature tables are the storage line.
unlocking growth in the CPG industry and how data analytics transforms CPG are the executive framing: a warehouse is worth its bill when the decisions it informs are worth more, and the way to know is to attribute both sides. from chaos to clarity: a case study of a failed platform is the archive’s account of what happens when neither side is attributed, and it is the reason the cost review starts with the bill rather than with the architecture diagram.
Data warehousing platform choice: the bill as the deciding document
The archive’s forward-looking posts, next-generation data management and the future of database technologies, describe the lakehouse convergence, open table formats (Iceberg, Delta, Hudi) and the separation of storage from compute that makes a warehouse bill portable between engines. That portability is the real reason to read the bill line by line: once the storage is in an open format, the compute lines can be re-priced on a different engine without moving the data, and a workload that is all line 2 on one platform may be a fraction of the cost on another.
The same reasoning applies to the transactional side of the estate. building an active-active PostgreSQL cluster is in this archive because the write-side topology decides how clean the CDC feed into the warehouse is, and a feed full of conflict-resolved duplicates is a storage line and a scan line at once. Vendor-neutrality is the operating principle: MinervaDB supports Snowflake, BigQuery, Redshift, Databricks and ClickHouse (through ChistaDATA) and recommends against any of them when the bill says the workload belongs elsewhere.
Version notes: billing views, retention defaults and the availability of features such as Snowflake’s query acceleration, Redshift Serverless RPU pricing and BigQuery editions change with vendor releases; every specific claim in an archive post should be checked against the vendor’s current pricing and documentation before a decision. Test any layout change (re-clustering, repartitioning, retention reduction) on a copy of the table with the production query set first, and keep a restorable copy of the data outside the platform’s own time travel before reducing retention; a DR posture that depends only on the vendor’s snapshot is not one.
How a data warehousing cost review runs
A review of a warehouse bill follows the lines in order, because the lines are ranked by how much they usually account for and by how reversible the fix is. Idle compute is first: changing an auto-suspend threshold or a cluster schedule costs nothing to try and nothing to reverse, and it is measured within a day by the same metering view that found it. Bytes scanned is second: a re-layout is a rebuild of the table, so it is rehearsed on a copy with the production query set replayed against both layouts, and the partitions-scanned figure per query is the acceptance test.
Storage is third and the slowest to show: a retention change stops growth but does not reclaim what was already retained until the retention window passes, so the review records the expected date of the saving rather than claiming it. Concurrency is fourth and needs the calendar more than the platform: the queue-time-by-hour chart is shown to the owners of the dashboards, and the refreshes are moved by agreement. The operational-store line and the compliance line are last, because both usually mean a migration or a design change rather than a setting.
Every step writes three things into the review: the query that attributed the line, the figure it produced with a timestamp, and the same query’s result after the change. A recommendation without the first is an opinion, and a saving without the third is a forecast. The output is a ranked list with a measured amount against each line, not a percentage claimed for the whole bill, and it is re-run a month later on the same views to confirm that the lines moved for the stated reason and not because the workload changed.
On an on-premises warehouse the currency is different but the method is identical: idle compute is a node licensed and powered for a batch window, bytes scanned is hours of disk time on the wrong projection or sort order, and storage is the array’s capacity plan. The attribution views are the platform’s own (Vertica’s QUERY_REQUESTS and PROJECTION_STORAGE, for one), and the fixes are the same re-layout, scheduling and retention decisions, priced against a hardware refresh cycle.
Where this data warehousing archive sits
This archive is the analytical layer of minervadb.com. The DBaaS archive covers the managed-service ledger that the same platforms are part of, the data strategy archive covers the decisions that put a workload on a warehouse in the first place, the Redshift archive and BigQuery archive go deeper on two of the platforms, and the PostgreSQL archive covers the operational side that feeds most warehouses. For the open table format that makes the bill portable, the reference is the Apache Iceberg table specification.
For a warehouse cost review that attributes every line to a decision, a platform selection or exit, or 24×7 support for the data warehousing and the operational stores around it, the MinervaDB database consulting practice reads the bill the way this page does, and states for every recommendation which line it reduces and by what measured amount.