Tuning Infrastructure for ClickHouse Performance
When you are building a very large Database System for analytics on ClickHouse you have to carefully build and operate infrastructure for performance and scalability. Is there any one magic wand to take care of the full-stack performance ? Unfortunately, the answer is no ! If you are not proactively monitoring and sizing the database infrastructure, you may be experiencing severe performance bottleneck or sometimes the total database outage causing serious revenue impact and all these may happen during the peak business hours or season, So where do we start planning for the infrastructure of ClickHouse operations ? As your ClickHouse database grows, the complexity of the queries also increases so we strongly advocate for investing in observability / monitoring infrastructure to troubleshoot more efficiently / proactively, We at MinervaDB use Grafana ( https://grafana.com/grafana/plugins/vertamedia-clickhouse-datasource ) to monitor ClickHouse Operations and record every performance counters from CPU, Network, Memory / RAM and Storage .This blog post is about knowing and monitoring the infrastructure component’s performance to build optimal ClickHouse operations.
Table of Contents
Monitor for overheating CPUs
The overheating can damage processor and even motherboard, Closely monitor the systems if you are overclocking and it is exceeding 100C, please turn off the system. Most modern processors do reduce their clockspeed when they get warm to try and cool themselves, This will cause sudden degradation in the performance.
Monitor your current CPU speed:
sudo cat /sys/devices/system/cpu/cpu0/cpufreq/cpuinfo_cur_freq
You can also use turbostat to monitor the CPU load:
sudo ./turbostat --quiet --hide sysfs,IRQ,SMI,CoreTmp,PkgTmp,GFX%rc6,GFXMHz,PkgWatt,CorWatt,GFXWatt
	Core	CPU	Avg_MHz	Busy%	Bzy_MHz	TSC_MHz	CPU%c1	CPU%c3	CPU%c6	CPU%c7
	-	-	488	90.71	3900	3498	12.50	0.00	0.00	74.98
	0	0	5	0.13	3900	3498	99.87	0.00	0.00	0.00
	0	4	3897	99.99	3900	3498	0.01
	1	1	0	0.00	3856	3498	0.01	0.00	0.00	99.98
	1	5	0	99.00	3861	3498	0.01
	2	2	1	0.02	3889	3498	0.03	0.00	0.00	99.95
	2	6	0	87.81	3863	3498	0.05
	3	3	0	0.01	3869	3498	0.02	0.00	0.00	99.97
	3	7	0	0.00	3878	3498	0.03
	Core	CPU	Avg_MHz	Busy%	Bzy_MHz	TSC_MHz	CPU%c1	CPU%c3	CPU%c6	CPU%c7
	-	-	491	82.79	3900	3498	12.42	0.00	0.00	74.99
	0	0	27	0.69	3900	3498	99.31	0.00	0.00	0.00
	0	4	3898	99.99	3900	3498	0.01
	1	1	0	0.00	3883	3498	0.01	0.00	0.00	99.99
	1	5	0	0.00	3898	3498	56.61
	2	2	0	0.01	3889	3498	0.02	0.00	0.00	99.98
	2	6	0	0.00	3889	3498	0.02
	3	3	0	0.00	3856	3498	0.01	0.00	0.00	99.99
	3	7	0	0.00	3897	3498	0.01
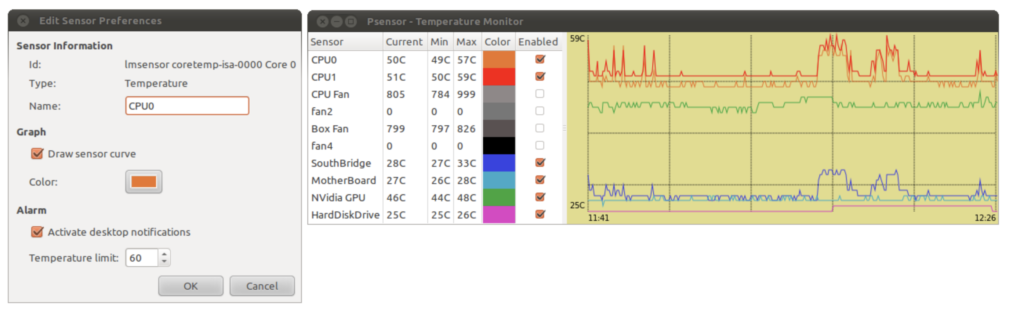
Using PSENSOR to monitor hardware temperature
psensor is a graphical hardware temperature monitor for Linux.
It can monitor:
- the temperature of the motherboard and CPU sensors (using lm-sensors).
- the temperature of the NVidia GPUs (using XNVCtrl).
- the temperature of ATI/AMD GPUs (not enabled in official distribution repositories, see the instructions for enabling its support).
- the temperature of the Hard Disk Drives (using hddtemp or libatasmart).
- the rotation speed of the fans (using lm-sensors).
- the CPU usage (since 0.6.2.10 and using Gtop2).
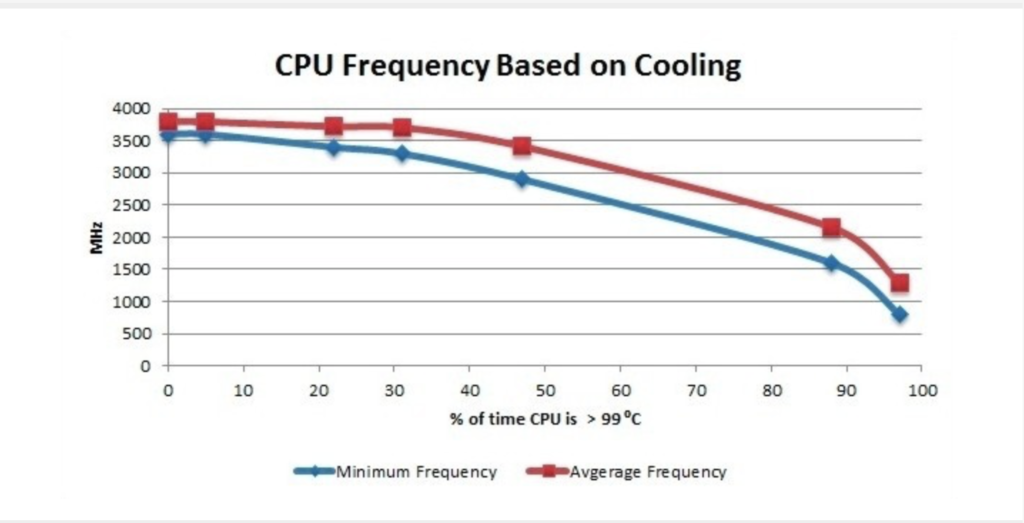
Since the Intel CPU thermal limit is 100 °C, we can quantify the amount of overheating by measuring the amount of time the CPU temperature was running at > 99 °C
Choosing RAID for Performance
The table below explains different RAID levels and how they impact on performance:
| RAID Level | Advantages | Disadvantages |
|---|---|---|
| RAID level 0 – Striping | RAID 0 offers great performance, both in read and write operations. There is no overhead caused by parity controls.RAID 0 offers great performance, both in read and write operations. All storage capacity is used, there is no overhead. | RAID 0 is not fault-tolerant. If one drive fails, all data in the RAID 0 array are lost. It should not be used for mission-critical systems. |
| RAID level 1 – Mirroring | RAID 1 offers excellent read speed and a write-speed that is comparable to that of a single drive. In case a drive fails, data do not have to be rebuild, they just have to be copied to the replacement drive. | Software RAID 1 solutions do not always allow a hot swap of a failed drive. That means the failed drive can only be replaced after powering down the computer it is attached to. For servers that are used simultaneously by many people, this may not be acceptable. Such systems typically use hardware controllers that do support hot swapping. The main disadvantage is that the effective storage capacity is only half of the total drive capacity because all data get written twice. |
| RAID level 5 | Read data transactions are very fast while write data transactions are somewhat slower (due to the parity that has to be calculated). If a drive fails, you still have access to all data, even while the failed drive is being replaced and the storage controller rebuilds the data on the new drive. | Technology complexity - If one of the disks in an array using 4TB disks fails and is replaced, restoring the data (the rebuild time) may take a day or longer, depending on the load on the array and the speed of the controller. If another disk goes bad during that time, data are lost forever. |
| RAID level 6 – Striping with double parity | READs are very fast, If two drives fail, you still have access to all data, even while the failed drives are being replaced. So RAID 6 is more secure than RAID 5. | Technology complexity - Rebuilding an array in which one drive failed can take a long time. Write data transactions are slower than RAID 5 due to the additional parity data that have to be calculated. In one report I read the write performance was 20% lower. |
| RAID level 10 – combining RAID 1 & RAID 0 | High Performance and Fault Tolerant - If something goes wrong, All we need to do is copying all the data from the surviving mirror to a new drive. | Highly expensive - Half of the storage capacity goes directly for mirroring. |
- Use NCQ with a long queue.
- Use CFQ scheduler for HDD.
- Enable write cache for improved WRITEs performance.
- Use noop for SSD.
- Ext4 is the most reliable.
You can read a detailed blog post about RAID here – https://minervadb.com/index.php/2019/08/04/raid-redundant-storage-for-database-reliability/
Huge Pages
What are Transparent Huge Pages and why they exist ? Operating Systems, Database Systems and several applications run in virtual memory. The Operating System manage virtual memory using pages (contiguous block of memory). Technically virtual memory is mapped to physical memory by the Operating System maintaining the page tables data structure in RAM. The address translation logic (page table walking) is implemented by the CPU’s memory management unit (MMU). The MMU also has a cache of recently used pages. This cache is called the Translation lookaside buffer (TLB).
Operating Systems manage virtual memory using pages (contiguous block of memory). Typically, the size of a memory page is 4 KB. 1 GB of memory is 256 000 pages; 128 GB is 32 768 000 pages. Obviously TLB cache can’t fit all of the pages and performance suffers from cache misses. There are two main ways to improve it. The first one is to increase TLB size, which is expensive and won’t help significantly. Another one is to increase the page size and therefore have less pages to map. Modern OSes and CPUs support large 2 MB and even 1 GB pages. Using large 2 MB pages, 128 GB of memory becomes just 64 000 pages.
Transparent Hugepage Support in Linux exist for performance. Transparent Huge Pages manages large pages automatically and transparently for applications. The benefits are pretty obvious: no changes required on application side; it reduces the number of TLB misses; page table walking becomes cheaper. The feature logically can be divided into two parts: allocation and maintenance. The THP takes the regular (“higher-order”) memory allocation path and it requires that the OS be able to find contiguous and aligned block of memory. It suffers from the same issues as the regular pages, namely fragmentation. If the OS can’t find a contiguous block of memory, it will try to compact, reclaim or page out other pages. That process is expensive and could cause latency spikes (up to seconds). This issue was addressed in the 4.6 kernel (via “defer” option), the OS falls back to a regular page if it can’t allocate a large one. The second part is maintenance. Even if an application touches just 1 byte of memory, it will consume whole 2 MB large page. This is obviously a waste of memory. So there’s a background kernel thread called “khugepaged”. It scans pages and tries to defragment and collapse them into one huge page. Despite it’s a background thread, it locks pages it works with, hence could cause latency spikes too. Another pitfall lays in large page splitting, not all parts of the OS work with large pages, e.g. swap. The OS splits large pages into regular ones for them. It could also degrade the performance and increase memory fragmentation.
Why we recommend to disable Transparent Huge Pages for ClickHouse Performance ?
Transparent Huge Pages (THP) is a Linux memory management system that reduces the overhead of Translation Lookaside Buffer (TLB) lookups on machines with large amounts of memory by using larger memory pages.
However, In our experience ClickHouse often perform poorly with THP enabled, because they tend to have sparse rather than contiguous memory access patterns. When running ClickHouse on Linux, THP should be disabled for best performance.
$ echo 'never' | sudo tee /sys/kernel/mm/transparent_hugepage/enabled
Yandex recommends perf top to monitor the time spend in the kernel for memory management.
RAM
ClickHouse performs great with the high quality investments on RAM. As the data volumes increases, caching benefits more to the frequently executed SORT / SEARCH intensive analytical queries . “Yandex recommends you not to disable overcommit”. The value cat /proc/sys/vm/overcommit_memory should be 0 or 1. Run
$ echo 0 | sudo tee /proc/sys/vm/overcommit_memory
Conclusion
The visibility to ClickHouse Ops. is very important to build optimal, scalable and highly available Data Analytics platforms, Most often what happens is we measure the hardware infrastructure when there is a performance bottleneck and the reactive approach to troubleshoot performance is really expensive. When we work with our customers, we plan and conduct regular performance audits of their ClickHouse Ops. for right sizing their infrastructure.
References:
