AlloyDB is the one managed PostgreSQL service where the interesting part is below the SQL layer. The query engine, catalog, extensions and wire protocol are PostgreSQL (16, 17 and, since 25 March 2026, 18). What Google replaced is the storage layer, the buffer management around it, and the read path for analytical scans. If you operate it as if it were Cloud SQL with a faster disk you will leave most of the performance on the table and misdiagnose the incidents you do get.
This post is written for people who already run PostgreSQL in production and need to understand what AlloyDB actually does differently: how the disaggregated storage works and what it means for WAL, checkpoints and vacuum; how the three-level cache hierarchy behaves; how the columnar engine decides to take a query; how read pools, transparent query forwarding and cross-region replication scale it out; and what the day-two operations look like. There is SQL and gcloud for each of those, and diagrams where the topology matters. Everything is checked against the AlloyDB documentation and release notes as of September 2026, and preview features are labelled as such.
AlloyDB architecture: cluster, instances, nodes, storage
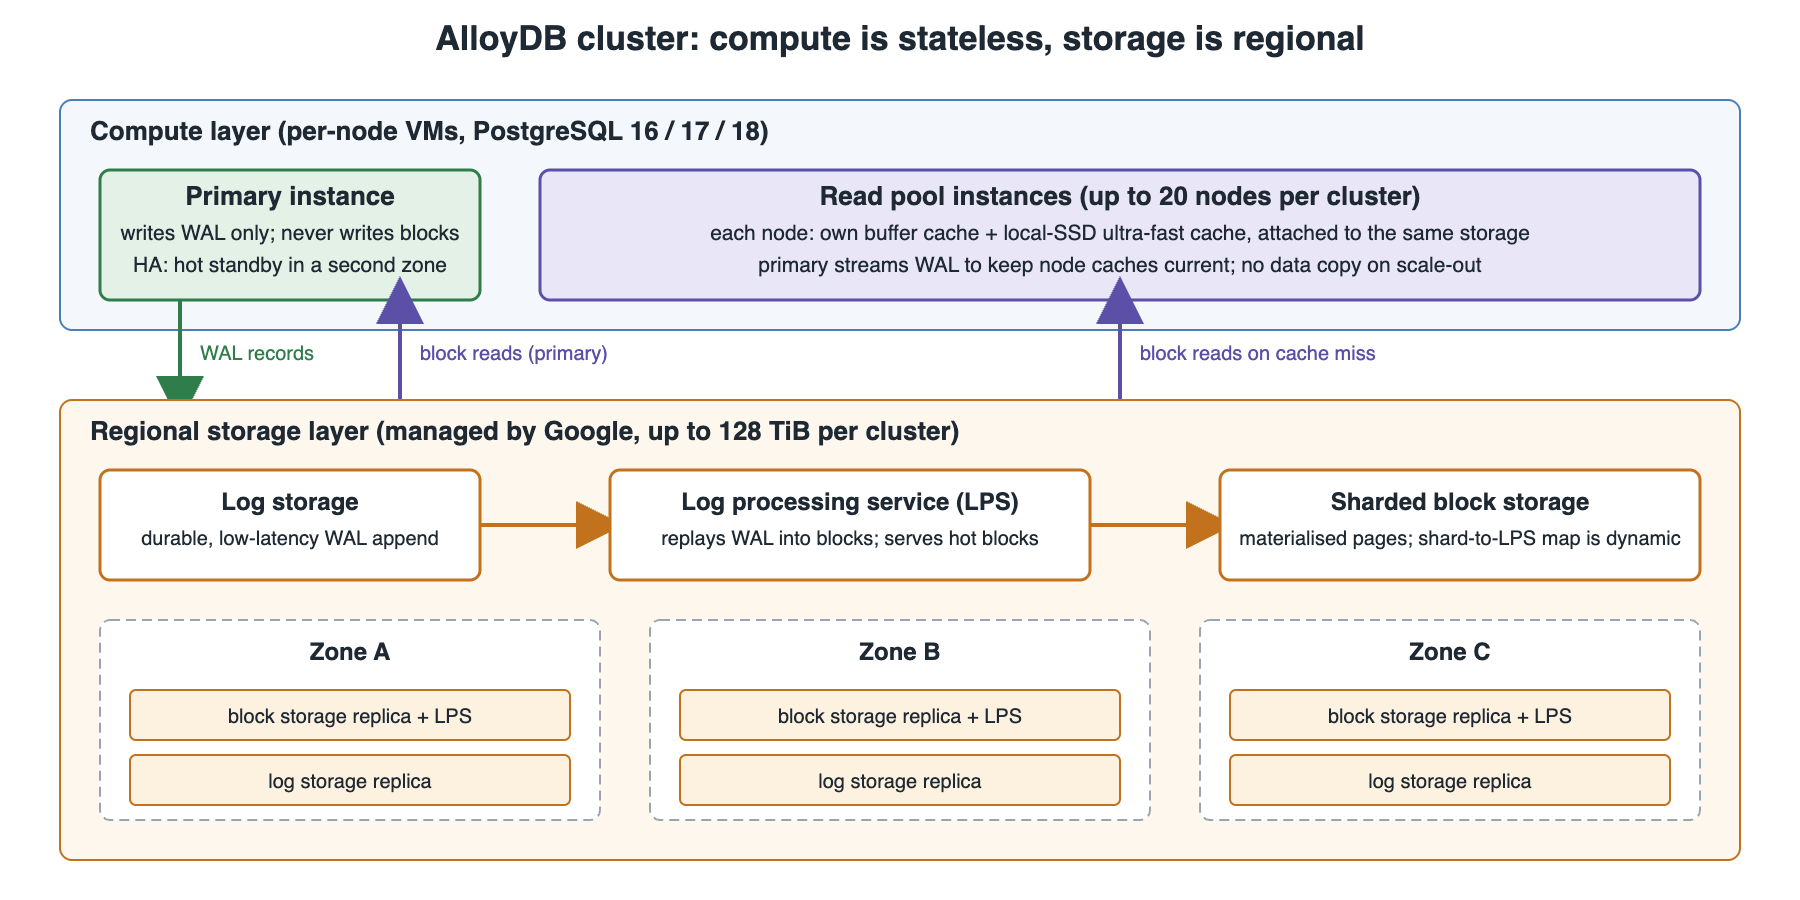
The object model has four levels and it pays to be precise about them because the pricing, the SLA and the failure domains all attach at different levels. A cluster is a regional container for a single PostgreSQL database system, its storage and its backups. An instance is a set of compute nodes with one role: exactly one primary instance per cluster handles writes, and up to twenty nodes across any number of read pool instances serve reads. A node is a VM running the PostgreSQL process. Under all of them sits one regional, disaggregated storage layer that every node in the cluster reads from and that only the primary writes to.
Two properties follow directly. Adding a read pool node does not copy any data; it points a new PostgreSQL process at the same storage and warms a cache. And a primary failover does not replay a storage copy either, because the standby is already attached to the same blocks. That is the whole reason AlloyDB can promise a 99.99% availability SLA on a regional primary, and it is a different set of mechanics from the streaming-replication HA that Cloud SQL, RDS and self-managed Patroni all use.
Internals: what happens to a write in AlloyDB
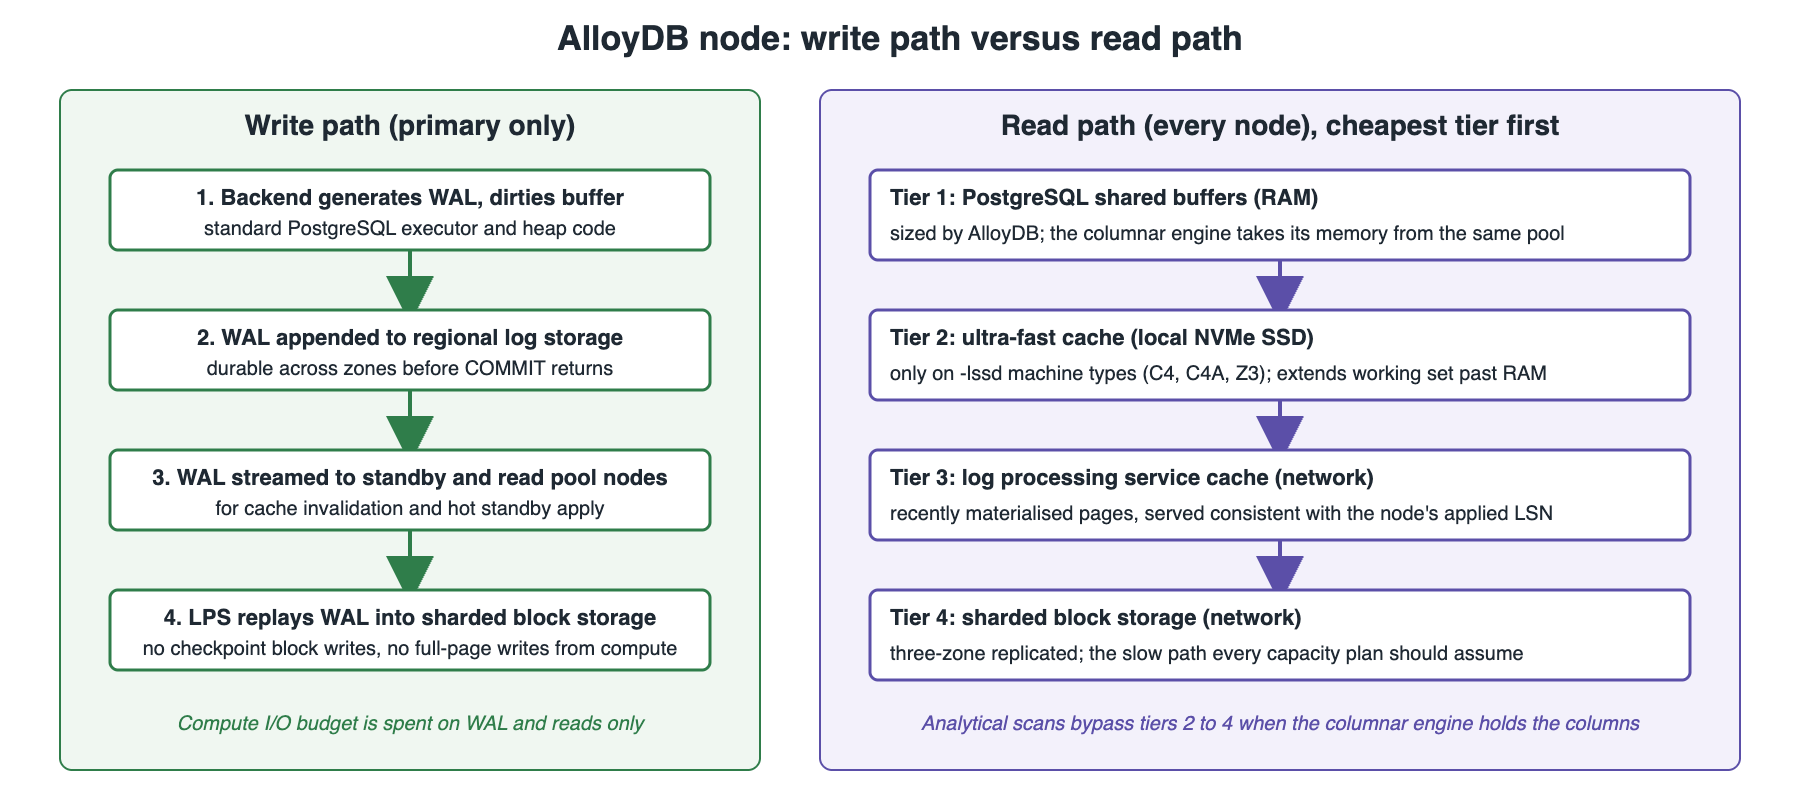
On stock PostgreSQL a committed write costs you a WAL append (fsync on commit), later a dirty-buffer write at checkpoint or by the background writer, and a full-page image the first time a page is touched after each checkpoint. On AlloyDB the primary does the first of those and none of the others.
The commit path is: the backend generates WAL as usual; the WAL is shipped to the regional log storage, which acknowledges once it is durable across zones; the commit returns. The primary never writes a data block to storage. There is no checkpoint I/O in the PostgreSQL sense, no full-page writes on the storage path, and the checkpointer and bgwriter that you see in pg_stat_activity are not doing what their names say.
Materialising pages is the job of the log processing service. LPS instances tail the log storage, apply the WAL to the blocks of the shards they own, and write the resulting pages into block storage, which is itself replicated across three zones in the region. The mapping from shard to LPS is dynamic: if one range of blocks is taking a disproportionate share of the write stream, more LPS capacity moves to it.
That matters for the workload class that hurts most on ordinary PostgreSQL: a very hot table or index page range under heavy update, where checkpoint write amplification and full-page writes dominate WAL volume. On AlloyDB that amplification is absorbed on the storage side rather than in your instance's I/O budget.
The read path is where the engineering shows. When a node needs a block that is not in its cache, it asks the storage layer for the block as of the LSN it has consumed. The LPS can serve a recently materialised block from its own cache or from block storage, and because it knows the WAL, it can hand back a version consistent with what that node has already applied.
This is what lets read pool nodes attach to shared storage and still present a consistent PostgreSQL snapshot: the primary streams WAL to them (over the network, exactly as a physical standby receives it) so they can invalidate and update cached pages, but a cache miss fetches from shared storage rather than from a private copy of the data files.
The AlloyDB cache hierarchy
Each node has three tiers in front of the storage service. The first is the ordinary PostgreSQL shared buffer cache, which AlloyDB sizes itself to a large fraction of instance memory (you do not set shared_buffers).
The second is the ultra-fast cache: a block cache on the node's local NVMe, available on the machine types whose names end in -lssd (C4, C4A and Z3), which extends the effective working set well past RAM at a latency far below the storage service. The third is the LPS-side cache for hot blocks. A page read therefore costs a memory hit, a local-SSD hit, a network round trip to an LPS that has the page hot, or a network round trip plus a block-storage read.
The right way to observe all this is still pg_stat_io (PostgreSQL 16+) and EXPLAIN (ANALYZE, BUFFERS). What changes is the interpretation: a "read" in pg_stat_io may have been satisfied from local SSD rather than the storage service, and the two have very different latencies. AlloyDB exposes that split in Cloud Monitoring, and with node-level metrics you can see it per node of a read pool instead of as an instance average, which is what you need when one node in a pool is cold after a resize.
-- AlloyDB, PostgreSQL 16+: where are my reads landing, per backend type and context?
-- Interpretation differs from vanilla: 'reads' here are misses in shared buffers;
-- the ultra-fast cache sits behind them and is only visible in Cloud Monitoring.
SELECT backend_type,
       object,
       context,
       reads,
       read_time,
       hits,
       ROUND(100.0 * hits / NULLIF(hits + reads, 0), 2) AS buffer_hit_pct,
       evictions
FROM   pg_stat_io
WHERE  reads > 0 OR hits > 0
ORDER  BY reads DESC;

-- Per-query, the buffers line tells you whether the plan is memory-resident.
EXPLAIN (ANALYZE, BUFFERS, SETTINGS)
SELECT o.customer_id, SUM(o.amount)
FROM   orders AS o
WHERE  o.ordered_at >= NOW() - INTERVAL '7 days'
GROUP  BY o.customer_id;
What stays PostgreSQL, and what AlloyDB changed quietly
MVCC, the heap, B-tree and GIN/GiST/BRIN indexes, the planner, PL/pgSQL, logical decoding and the extension ABI are unchanged, which is why the extension list is long (PostGIS, pgvector, pg_partman, pg_cron, pg_hint_plan, TimescaleDB is not on it). Vacuum is still vacuum: dead tuples still accumulate in heap pages, freezing still has to happen before wraparound, and bloat still costs you read I/O. AlloyDB adds adaptive autovacuum, which tunes the autovacuum worker cost and thresholds from observed dead-tuple accumulation instead of the static autovacuum_vacuum_scale_factor, and it is worth knowing that this exists before you carry over a hand-tuned per-table autovacuum_* storage-parameter set from a self-managed estate, because the two will fight.
Two other things are managed for you. Memory: shared_buffers, work_mem defaults and the columnar engine's memory are set relative to the machine type, and the flags you can change are the allow-listed subset in the AlloyDB flags reference. Connections: managed connection pooling, which is a Google-run PgBouncer-style pooler on port 6432 in front of each instance, with transaction mode as the default, a maximum pool size of 50 server connections per user-database pair by default, and the usual transaction-mode restrictions (no SET/RESET, no LISTEN, no prepared statements). Turn it on per instance, not per cluster:
# AlloyDB managed connection pooling: enable on the primary, transaction mode,
# and size the server side from measured concurrency, not from max_connections.
gcloud alloydb instances update ${ALLOYDB_PRIMARY} \
  --cluster=${ALLOYDB_CLUSTER} \
  --region=${GCP_REGION} \
  --enable-connection-pooling \
  --connection-pooling-pool-mode=transaction \
  --connection-pooling-max-pool-size=80 \
  --connection-pooling-min-pool-size=10 \
  --connection-pooling-max-client-connections=4000 \
  --connection-pooling-server-idle-timeout=600 \
  --connection-pooling-query-wait-timeout=60

# Clients then connect to the pooler on 6432; port 5432 still bypasses it.
psql "host=${ALLOYDB_PRIMARY_IP} port=6432 dbname=ops user=${PG_USER} sslmode=require"
Performance engineering on AlloyDB
Google's headline figures are 4x the transactional throughput of standard PostgreSQL and up to 100x on analytical queries. Those are Google's numbers on Google's benchmarks; the mechanisms behind them are what you can actually use. The transactional gain comes from the write path above (no checkpoint or full-page-write I/O from compute), the large buffer cache, and the ultra-fast cache. The analytical gain comes almost entirely from the columnar engine, and it only applies to queries the columnar engine agrees to run.
The AlloyDB columnar engine, precisely
The columnar engine keeps an in-memory, column-oriented copy of selected columns of selected tables inside the instance's memory, alongside the row store. It is not a separate storage format on disk and it is not a second database: writes go to the heap as usual, and the columnar copy is kept current by tracking which row-store blocks have changed since the columns were populated, falling back to the row store for those blocks. Every node has its own columnar cache, so you can enable the engine on a read pool instance and leave the primary's memory for the OLTP working set, which is the deployment shape I would start with.
Enabling it is a flag on the instance; the memory it may use is a second flag, and by default AlloyDB allocates 30% of instance memory to it once enabled. That memory is taken from what would otherwise be buffer cache, so on a mixed instance the decision is a trade between row-store hit rate and columnar coverage, and you should look at the buffer-hit query above before and after.
# AlloyDB columnar engine on a read pool instance: enable, give it 40% of memory
# (the default is 30%), keep auto-columnarization on, and recommend every 6 hours.
# --database-flags REPLACES the whole flag set on the instance: pass every flag you rely on.
gcloud alloydb instances update ${ALLOYDB_READPOOL} \
  --cluster=${ALLOYDB_CLUSTER} \
  --region=${GCP_REGION} \
  --database-flags="google_columnar_engine.enabled=on,google_columnar_engine.memory_size_in_mb=52428,google_columnar_engine.enable_auto_columnarization=on,google_columnar_engine.auto_columnarization_schedule=EVERY 6 HOURS"
Auto-columnarization is on by default on new instances and runs hourly: it watches the query workload, recommends columns, and populates them. That is fine for a warehouse-style read pool. For a primary I prefer explicit control, because an hourly job that decides to load a 200 GB fact table into 30% of memory in the middle of the business day is not what an OLTP instance needs. The manual functions and the views that tell you what is loaded:
-- AlloyDB columnar engine: ask what it would recommend (no changes made),
-- then populate specific columns explicitly rather than trusting the hourly job.
SELECT google_columnar_engine_recommend();

SELECT database_name, schema_name, relation_name, column_name
FROM   g_columnar_recommended_columns
ORDER  BY relation_name, column_name;

-- Size it before you load it
SELECT google_columnar_engine_estimate(
         relation => 'public.orders',
         columns  => 'ordered_at,customer_id,status,amount');

SELECT google_columnar_engine_add(
         relation => 'public.orders',
         columns  => 'ordered_at,customer_id,status,amount');

-- What is resident, how big, and how recently used
SELECT relation_name, column_name, size_in_bytes, last_accessed_time
FROM   g_columnar_columns
ORDER  BY size_in_bytes DESC;

-- Memory headroom the engine still has, in MB
SELECT google_columnar_engine_memory_available();
Whether a query actually uses the columnar copy is decided by the planner with a cost model and, crucially, is visible in the plan. The node is Custom Scan (columnar scan), and the Columnar cache search mode line tells you which of three things happened: native (the scan ran entirely on the columnar data), columnar filter only (the filter was evaluated on the columnar copy to find qualifying rows and the row store was then visited for the projection), or row store scan (fell back).
Rows Removed by Columnar Filter is the number to compare against rows returned. Joins between columnar-resident tables can appear as Vectorized Hash Join. When the planner declines, EXPLAIN (COLUMNAR_ENGINE) prints the reason, which is how you find out that the column you filter on was never added.
-- Verify the columnar engine took the query, and why or why not
EXPLAIN (ANALYZE, COLUMNAR_ENGINE)
SELECT status, COUNT(*), SUM(amount)
FROM   orders
WHERE  ordered_at >= DATE '2026-07-01'
GROUP  BY status;

-- Illustrative plan fragment (shape as documented, numbers are not a benchmark):
-- HashAggregate
--   ->  Custom Scan (columnar scan) on orders
--         Filter: (ordered_at >= '2026-07-01'::date)
--         Rows Removed by Columnar Filter: 412391207
--         Columnar cache search mode: native

-- Per-statement columnar statistics for the recent workload
SELECT query_id, page_read, rows_filtered, total_time
FROM   g_columnar_stat_statements
ORDER  BY total_time DESC
LIMIT  20;
Three limits shape what you put in it. Columns are chosen per table, and a query that touches a column you have not added falls back for that table. Very wide text columns and columns with low filter selectivity buy little and cost memory. And because the engine is memory-resident per node, a node restart or a resize starts with an empty columnar cache and refills from the row store, which is a warm-up you should schedule into any read pool scaling plan.
Index advisor and query plan patches
Two planner-adjacent features are GA and belong in an AlloyDB runbook. The index advisor (GA 15 April 2026) tracks the statements the instance runs, models candidate B-tree indexes against them, and exposes the results in google_db_advisor_recommended_indexes with an estimated size and the per-query benefit in google_db_advisor_workload_report. It is conservative and it is not clever about partial or covering indexes, but it is a good first pass on a migrated schema whose indexes were designed for a different optimizer. Vector-index recommendations are included by default via google_db_advisor.enable_vector_index_advisor.
-- AlloyDB index advisor: run an on-demand analysis (run as a superuser to see all roles' workload)
SELECT * FROM google_db_advisor_recommend_indexes();

SELECT index_ddl, estimated_storage_size_in_mb
FROM   google_db_advisor_recommended_indexes
ORDER  BY estimated_storage_size_in_mb;

-- Create what you accept CONCURRENTLY, with an explicit name; then reset the tracked workload
CREATE INDEX CONCURRENTLY orders_customer_ordered_at_idx
    ON orders (customer_id, ordered_at DESC);

SELECT google_db_advisor_reset();
Query plan patches, which the documentation now calls named hints (GA 24 September 2025), are the answer to the "we cannot change the application SQL and the plan flipped" incident. They store a pg_hint_plan hint string against a query ID or query text and apply it server-side, so the fix lives in the database and survives an application deploy. AlloyDB adds two hints of its own, ColumnarScan(t) and NoColumnarScan(t), which are how you pin or exclude the columnar engine per query without touching the instance flags.
-- AlloyDB query plan patch: pin a plan to a query_id from pg_stat_statements without changing the app
CREATE EXTENSION IF NOT EXISTS google_auto_hints CASCADE;
SET alloydb.enable_named_hints = on;   -- or set at instance level in --database-flags

SELECT google_create_named_hints(
         hints_name => 'orders_by_customer_force_index',
         sql_id     => 8231947731662250153,          -- queryid from pg_stat_statements
         hints      => 'IndexScan(o orders_customer_ordered_at_idx) NoColumnarScan(o)',
         disabled   => false);

SELECT * FROM google_named_hints_view;

-- Roll back the patch, not the deployment
SELECT google_disable_named_hints('orders_by_customer_force_index');
Machine types and where the ceiling is
Vertical scale on AlloyDB is a machine-type change with a short unavailability window, and the top end is a good deal higher than most people assume. The current series are N2 (the default, 2 to 128 vCPU), C4 (4 to 288 vCPU, up to 2,232 GiB), C4A on Axion Arm cores (1 to 72 vCPU), and Z3 (8 to 88 vCPU, storage-optimised with large local SSD). The -lssd variants carry the ultra-fast cache; the plain N2 shapes do not, which on a working set larger than RAM is the difference between a memory-speed miss and a network-speed miss. For a new deployment I would default to c4-highmem-*-lssd and consider C4A where the price-performance justifies confirming Arm compatibility of your extensions.
Scalability: read pools, query forwarding, cross-region
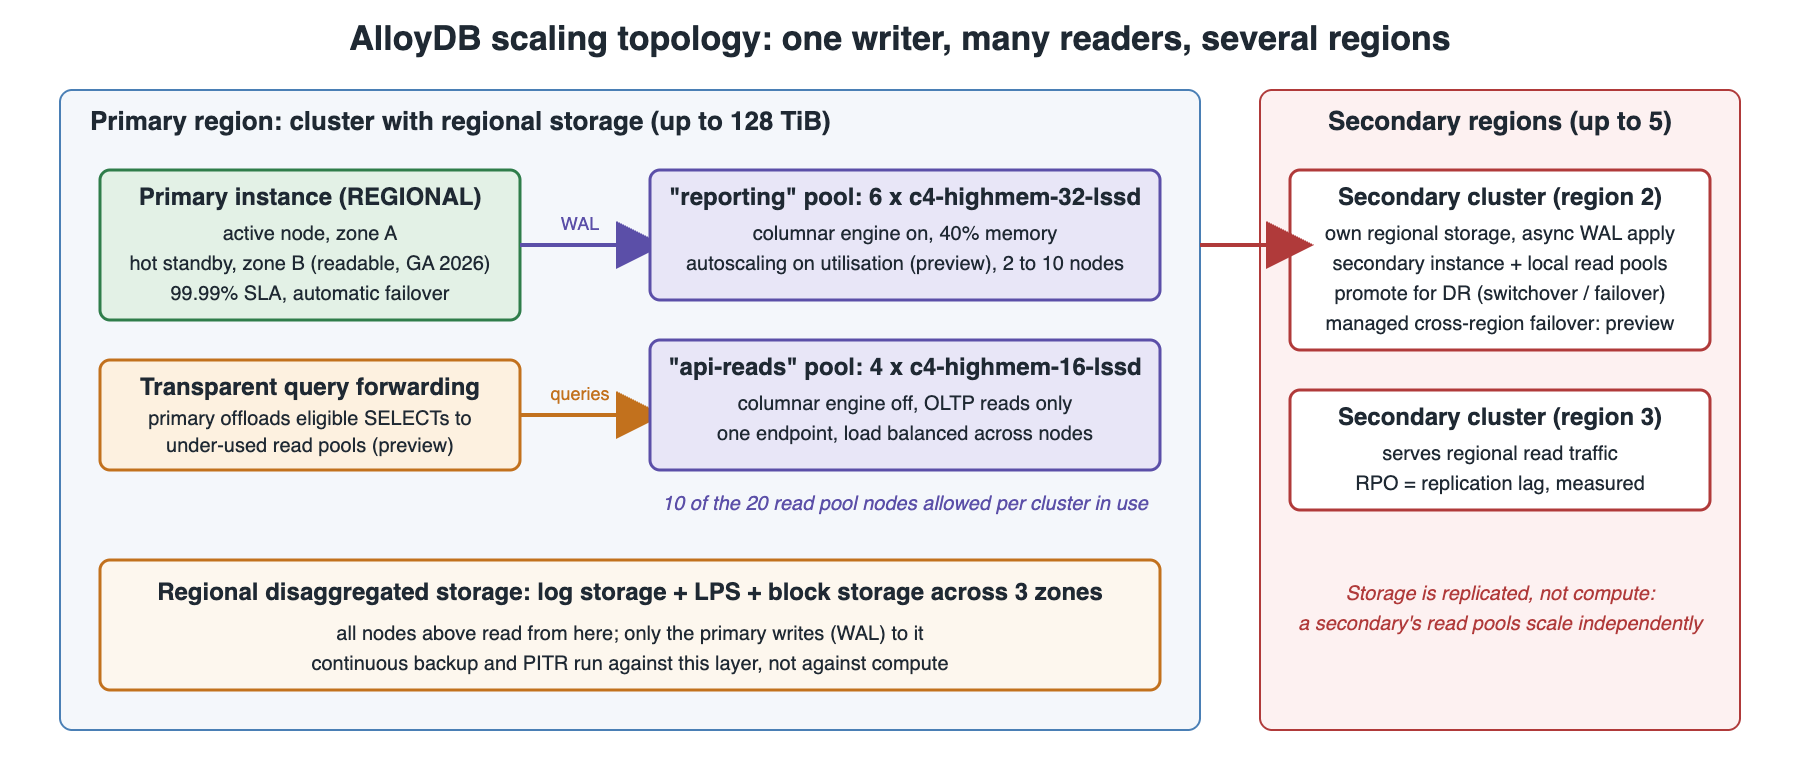
Horizontal scale on AlloyDB is read scale-out. There is one writer per cluster, and the way to get more write throughput is a larger primary, better batching, or application-level sharding; AlloyDB does not shard for you and it should not be sold as if it does. Read scale-out, on the other hand, is unusually good because of the shared-storage design, and it comes in three pieces.
Read pools
A read pool instance is a group of identically sized nodes behind one endpoint, load-balanced by AlloyDB. You can have several pools per cluster, sized and flagged independently, and the hard limit is twenty nodes summed across all pools. Because nodes attach to shared storage, adding a node is a matter of minutes and no extra storage cost, and removing one loses nothing. Replication lag from the primary is WAL-apply lag over the network and is usually low, but it is not zero and it is not synchronous, so anything that needs read-your-writes goes to the primary, exactly as with a physical standby.
# AlloyDB: two read pools with different roles, flagged differently
gcloud alloydb instances create reporting \
  --instance-type=READ_POOL \
  --read-pool-node-count=6 \
  --cluster=${ALLOYDB_CLUSTER} \
  --region=${GCP_REGION} \
  --cpu-count=32 \
  --machine-type=c4-highmem-32-lssd \
  --database-flags="google_columnar_engine.enabled=on,google_columnar_engine.memory_size_in_mb=104857"

gcloud alloydb instances create api-reads \
  --instance-type=READ_POOL \
  --read-pool-node-count=4 \
  --cluster=${ALLOYDB_CLUSTER} \
  --region=${GCP_REGION} \
  --cpu-count=16 \
  --machine-type=c4-highmem-16-lssd

# Resize a pool in place (nodes are added or removed behind the same endpoint)
gcloud alloydb instances update reporting \
  --cluster=${ALLOYDB_CLUSTER} \
  --region=${GCP_REGION} \
  --read-pool-node-count=8
Measure lag from the pool side, not from the primary. The standard views work: pg_last_wal_replay_lsn() on a pool node against pg_current_wal_lsn() on the primary gives bytes of lag, and pg_last_xact_replay_timestamp() gives the time dimension. Node-level metrics in Cloud Monitoring add per-node replication lag, CPU and cache hit rate, which you want when the load balancer has sent a disproportionate share of long-running queries to one node.
Transparent query forwarding (preview)
This one is easy to get backwards. Transparent query forwarding, in preview since 23 July 2026, runs on the primary: with alloydb.enable_query_forwarding on for a session or a database, the primary intercepts eligible read-only SELECTs and forwards them to read pool nodes that have spare capacity, while preserving read-your-writes consistency for the forwarding session.
The application keeps a single connection string. Eligibility is narrow by design: no temporary, unlogged or catalog tables; no volatile functions or UDFs; and the cost model prefers to keep short index-scan queries local because forwarding has a fixed overhead. Think of it as a way to protect the primary from the occasional heavy report, not as a replacement for pointing the reporting tier at a read pool endpoint.
-- AlloyDB transparent query forwarding (preview): opt in per database, verify per session
ALTER DATABASE ops SET alloydb.enable_query_forwarding = on;

-- In a session, confirm the setting took effect and run a forwarding candidate
SHOW alloydb.enable_query_forwarding;
EXPLAIN (ANALYZE)
SELECT region, COUNT(*)
FROM   shipments
WHERE  shipped_at >= DATE '2026-08-01'
GROUP  BY region;
Autoscaling, storage and the cross-region layer
Horizontal read pool autoscaling (preview) adjusts node count between a floor and a ceiling on observed utilisation, which is the right control for a diurnal reporting load provided you accept the columnar warm-up on each new node. Storage scales to 128 TiB per cluster with no provisioning step, and you pay for what is used; there is no IOPS knob because there is no volume, which removes a whole class of "we are throttled on the disk" incidents and replaces it with "the storage service latency is what it is", which is visible in the same per-node metrics.
For multi-region, a cluster can have up to five secondary clusters in other regions, each with its own regional storage kept current by asynchronous WAL shipping and its own read pools for local reads. Promotion of a secondary is a switchover (planned) or a failover (unplanned) and has been GA for a while; managed cross-region failover with automatic health-based promotion entered preview on 27 July 2026, and the write endpoint that follows the writer across a regional promotion is also preview. Until both are GA, the runbook is a manual promotion plus a DNS or connection-string change, and the RPO is the measured replication lag, not zero.
# AlloyDB cross-region: create a secondary cluster in another region, then a secondary instance in it
gcloud alloydb clusters create-secondary ${ALLOYDB_CLUSTER}-eu \
  --primary-cluster=projects/${GCP_PROJECT}/locations/${GCP_REGION}/clusters/${ALLOYDB_CLUSTER} \
  --region=${GCP_SECONDARY_REGION}

gcloud alloydb instances create-secondary ${ALLOYDB_CLUSTER}-eu-primary \
  --cluster=${ALLOYDB_CLUSTER}-eu \
  --region=${GCP_SECONDARY_REGION}

# Planned switchover (verify lag is near zero first; this is the reversible path)
gcloud alloydb clusters switchover ${ALLOYDB_CLUSTER}-eu --region=${GCP_SECONDARY_REGION}

# Unplanned promotion: breaks replication from the old primary; gate this behind a change record
# gcloud alloydb clusters promote ${ALLOYDB_CLUSTER}-eu --region=${GCP_SECONDARY_REGION}
Operations: what a day-two AlloyDB runbook contains
Most of the PostgreSQL operational surface is still yours, and the parts that are not need a different reflex. The list below is what I would expect an AlloyDB runbook to cover, in the order the incidents tend to arrive.
Vacuum and wraparound. Watch age(relfrozenxid) and pg_stat_progress_vacuum exactly as before. Adaptive autovacuum helps with the routine dead-tuple case; it does not exempt you from a long-running transaction holding back the horizon, which on AlloyDB additionally holds back the columnar engine's refresh of changed blocks. Alert on both xact_start age and the wraparound distance.
-- AlloyDB wraparound watch: same query, same 200M-transaction reflex
SELECT c.oid::regclass                         AS relation,
       age(c.relfrozenxid)                     AS xid_age,
       pg_size_pretty(pg_total_relation_size(c.oid)) AS total_size
FROM   pg_class AS c
JOIN   pg_namespace AS n ON n.oid = c.relnamespace
WHERE  c.relkind IN ('r', 'm', 't')
  AND  n.nspname NOT IN ('pg_catalog', 'information_schema')
ORDER  BY age(c.relfrozenxid) DESC
LIMIT  15;
Backups and PITR. Continuous backup runs at the storage layer with a configurable recovery window (up to 35 days), and restores create a new cluster rather than overwriting the old one, which is the safest possible default and also means a restore drill costs money for the duration. On-demand and scheduled backups are the second line. Enhanced backups, which decouple backup retention from the cluster's own lifetime, are in preview. Whichever you use, a quarterly restore-and-validate to a scratch cluster is the only proof the backup exists.
Maintenance and upgrades. Set a maintenance window and a deny period; minor version updates and infrastructure patches happen inside it with a short failover on a REGIONAL primary. Major version upgrades (16 to 17, 17 to 18) are in-place and managed, but they still rewrite catalogs and invalidate statistics, so the post-upgrade ANALYZE pass and a columnar re-population are part of the plan. Flags that require a restart say so in the flags reference; --database-flags replaces the full set, so keep the canonical flag list in version control.
# AlloyDB: maintenance window plus a deny period across quarter-end; continuous backup at 14 days
gcloud alloydb clusters update ${ALLOYDB_CLUSTER} \
  --region=${GCP_REGION} \
  --maintenance-window-day=SUNDAY \
  --maintenance-window-hour=2 \
  --deny-maintenance-period-start-date=2026-09-25 \
  --deny-maintenance-period-end-date=2026-10-05 \
  --deny-maintenance-period-time=00:00 \
  --continuous-backup-recovery-window-days=14

# What flags are actually applied on the primary right now (source of truth before any change)
gcloud alloydb instances describe ${ALLOYDB_PRIMARY} \
  --cluster=${ALLOYDB_CLUSTER} --region=${GCP_REGION} \
  --format="yaml(databaseFlags,machineConfig,availabilityType,state)"
Observability. Query insights and pg_stat_statements give you the statement layer; Cloud Monitoring gives the node layer (CPU, memory, replication lag, cache hit ratio, and the ultra-fast cache split); the g_columnar_* views give the columnar layer. The alerting set I would start from is replication lag per read pool node, wraparound distance, buffer and ultra-fast cache hit rate on the primary, columnar memory available, and connection count against the pooler's max_client_connections. AlloyDB also syncs to BigQuery natively (preview), which is the sane route for anything that would otherwise be a nightly export.
AlloyDB Omni: the same engine, your hardware
AlloyDB Omni is the downloadable build of the engine (currently 18.3.0, 17.9.0 and 16.13.0 as of the 15 July 2026 release, with the Kubernetes operator at 1.8.1 from 25 August 2026). It carries the columnar engine, the index advisor, the AI functions and the memory management, but not the disaggregated storage:
Omni writes to a local filesystem or a block volume, checkpoints and full-page writes are back, and HA is the operator's standby-based replication rather than the shared-storage failover. In other words, Omni gives you the query-layer innovations on any Linux host or Kubernetes cluster, and the storage-layer innovations stay in the managed service. That is the correct mental model for a hybrid estate and it is also the honest reason the managed service is priced as it is.
Where AlloyDB is the wrong choice
We are a vendor-neutral practice and there are cases where I would not recommend AlloyDB even to a Google Cloud customer. If the write throughput exceeds what one primary can sustain, a single-writer architecture is the wrong shape and you want Citus, a sharded design, or a different engine. If the workload is pure OLTP with a working set that fits comfortably in RAM on Cloud SQL Enterprise Plus, AlloyDB's storage advantage is smaller than the price gap.
If you depend on an extension that is not on the AlloyDB list (TimescaleDB is the common one), the answer is no. And if the analytics requirement is a real warehouse with terabytes scanned per query, the columnar engine is a memory-bounded accelerator and BigQuery or ClickHouse is the right tool, with AlloyDB feeding it.
Where it is the right choice is a demanding mixed workload on PostgreSQL that needs a high-availability writer, elastic read scale, and fast operational reporting on the same data without an ETL hop. That is a common shape and AlloyDB fits it better than any managed PostgreSQL I have worked with.
The standing caveat applies: test every flag change and every columnar engine decision against a copy of your production workload before it goes near production, keep a rehearsed restore and a rehearsed cross-region promotion in place, and treat the preview features (query forwarding, autoscaling, managed cross-region failover, write endpoints, enhanced backups, BigQuery sync) as things to evaluate rather than depend on until they are GA. If you want help with an AlloyDB migration, a read pool and columnar engine design, or a capacity plan for the write path, that is what the MinervaDB PostgreSQL consulting team does across Google Cloud, AWS and on-premises.
References
AlloyDB for PostgreSQL overview · AlloyDB release notes · AlloyDB under the hood: intelligent, database-aware storage · About the AlloyDB columnar engine · Monitor the columnar engine · Manage columnar engine content manually · Use the index advisor · Create and manage query plan patches · Create a read pool instance · Transparent query forwarding · Managed connection pooling · Create a cluster and its primary instance · AlloyDB Omni release notes
Running PostgreSQL in production? MinervaDB provides PostgreSQL consulting, 24×7 PostgreSQL support and PostgreSQL remote DBA services as part of its database consulting services.
Running this in production?
MinervaDB provides AlloyDB Consulting, PostgreSQL Consulting, PostgreSQL Support and PostgreSQL Remote DBA with 24x7 coverage and a 15-minute S1 response. Talk to an engineer.