The post Comparing TokuDB, RocksDB and InnoDB Performance on Intel(R) Xeon(R) Gold 6140 CPU appeared first on The WebScale Database Infrastructure Operations Experts.
]]>Monday, 6 August 2018
Performance Benchmarking of TokuDB, RocksDB and InnoDB on Intel(R) Xeon(R) Gold 6140 CPU
Hardware information
We have captured detailed information of the infrastructure (CPU, Diskand Memory) used for this benchmarking, This really helps anyone doing capacity planning / sizing of their database infrastructure.
CPU details (Intel(R) Xeon(R) Gold 6140 CPU @ 2.30GHz with 72 CPUs)
root@blr1p01-pfm-008:/home/t-minervadb# lscpu
Architecture:          x86_64
CPU op-mode(s):        32-bit, 64-bit
Byte Order:            Little Endian
CPU(s):                72
On-line CPU(s) list:   0-71
Thread(s) per core:    2
Core(s) per socket:    18
Socket(s):             2
NUMA node(s):          2
Vendor ID:             GenuineIntel
CPU family:            6
Model:                 85
Model name:            Intel(R) Xeon(R) Gold 6140 CPU @ 2.30GHz
Stepping:              4
CPU MHz:               1000.000
CPU max MHz:           2301.0000
CPU min MHz:           1000.0000
BogoMIPS:              4601.52
Virtualization:        VT-x
L1d cache:             32K
L1i cache:             32K
L2 cache:              1024K
L3 cache:              25344K
NUMA node0 CPU(s):     0-17,36-53
NUMA node1 CPU(s):     18-35,54-71
Flags:                 fpu vme de pse tsc msr pae mce cx8 apic sep mtrr pge mca cmov pat pse36 clflush dts acpi mmx fxsr sse sse2 ss ht tm pbe syscall nx pdpe1gb rdtscp lm constant_tsc art arch_perfmon pebs bts rep_good nopl xtopology nonstop_tsc aperfmperf eagerfpu pni pclmulqdq dtes64 monitor ds_cpl vmx smx est tm2 ssse3 sdbg fma cx16 xtpr pdcm pcid dca sse4_1 sse4_2 x2apic movbe popcnt tsc_deadline_timer aes xsave avx f16c rdrand lahf_lm abm 3dnowprefetch epb invpcid_single intel_pt spec_ctrl retpoline kaiser tpr_shadow vnmi flexpriority ept vpid fsgsbase tsc_adjust bmi1 hle avx2 smep bmi2 erms invpcid rtm cqm mpx avx512f rdseed adx smap clflushopt clwb avx512cd xsaveopt xsavec xgetbv1 cqm_llc cqm_occup_llc cqm_mbm_total cqm_mbm_local dtherm ida arat pln pts
Storage devices used for benchmarking (we used NVME SSD)
root@blr1p01-pfm-008:/home/t-minervadb# lsblk -io NAME,TYPE,SIZE,MOUNTPOINT,FSTYPE,MODEL
NAME        TYPE   SIZE MOUNTPOINT FSTYPE MODEL
sda         disk 446.1G                   LSI2208
|-sda1      part 438.7G /          ext4
`-sda2      part   7.5G [SWAP]     swap
nvme0n1     disk   2.9T /mnt       ext4   Micron_9200_MTFDHAL3T2TCU
nvme1n1     disk   2.9T                   Micron_9200_MTFDHAL3T2TCU
nvme2n1     disk   2.9T                   Micron_9200_MTFDHAL3T2TCU
nvme3n1     disk   2.9T                   Micron_9200_MTFDHAL3T2TCU
`-nvme3n1p1 part   128M
nvme4n1     disk   2.9T                   Micron_9200_MTFDHAL3T2TCU
`-nvme4n1p1 part   128M
nvme5n1     disk   2.9T                   Micron_9200_MTFDHAL3T2TCU
`-nvme5n1p1 part   128M
nvme6n1     disk   2.9T                   Micron_9200_MTFDHAL3T2TCU
`-nvme6n1p1 part   128M
nvme7n1     disk   2.9T                   Micron_9200_MTFDHAL3T2TCU
`-nvme7n1p1 part   128M
Memory
root@blr1p01-pfm-008:/home/t-minervadb# free
              total        used        free      shared  buff/cache   available
Mem:      527993080    33848440   480213336       18304    13931304   492519988
Swap:       7810044           0     7810044
root@blr1p01-pfm-008:/home/t-minervadb#
MySQL (we have used Percona Server 5.7.22-22 with InnoDB/XtraDB, TokuDB and RocksDB) configuration / system variables
We haven’t changed any of the system variables of TokuDB, RocksDB and InnoDB for performance:
TokuDB system variables
mysql> show variables like 'toku%';
+-----------------------------------------+-------------------------+
| Variable_name                           | Value                   |
+-----------------------------------------+-------------------------+
| tokudb_alter_print_error                | OFF                     |
| tokudb_analyze_delete_fraction          | 1.000000                |
| tokudb_analyze_in_background            | ON                      |
| tokudb_analyze_mode                     | TOKUDB_ANALYZE_STANDARD |
| tokudb_analyze_throttle                 | 0                       |
| tokudb_analyze_time                     | 5                       |
| tokudb_auto_analyze                     | 30                      |
| tokudb_block_size                       | 4194304                 |
| tokudb_bulk_fetch                       | ON                      |
| tokudb_cache_size                       | 270332456960            |
| tokudb_cachetable_pool_threads          | 0                       |
| tokudb_cardinality_scale_percent        | 100                     |
| tokudb_check_jemalloc                   | ON                      |
| tokudb_checkpoint_lock                  | OFF                     |
| tokudb_checkpoint_on_flush_logs         | OFF                     |
| tokudb_checkpoint_pool_threads          | 0                       |
| tokudb_checkpointing_period             | 60                      |
| tokudb_cleaner_iterations               | 5                       |
| tokudb_cleaner_period                   | 1                       |
| tokudb_client_pool_threads              | 0                       |
| tokudb_commit_sync                      | ON                      |
| tokudb_compress_buffers_before_eviction | ON                      |
| tokudb_create_index_online              | ON                      |
| tokudb_data_dir                         |                         |
| tokudb_debug                            | 0                       |
| tokudb_dir_cmd                          |                         |
| tokudb_dir_cmd_last_error               | 0                       |
| tokudb_dir_cmd_last_error_string        |                         |
| tokudb_dir_per_db                       | ON                      |
| tokudb_directio                         | OFF                     |
| tokudb_disable_hot_alter                | OFF                     |
| tokudb_disable_prefetching              | OFF                     |
| tokudb_disable_slow_alter               | OFF                     |
| tokudb_empty_scan                       | rl                      |
| tokudb_enable_fast_update               | OFF                     |
| tokudb_enable_fast_upsert               | OFF                     |
| tokudb_enable_partial_eviction          | ON                      |
| tokudb_fanout                           | 16                      |
| tokudb_fs_reserve_percent               | 5                       |
| tokudb_fsync_log_period                 | 0                       |
| tokudb_hide_default_row_format          | ON                      |
| tokudb_killed_time                      | 4000                    |
| tokudb_last_lock_timeout                |                         |
| tokudb_load_save_space                  | ON                      |
| tokudb_loader_memory_size               | 100000000               |
| tokudb_lock_timeout                     | 4000                    |
| tokudb_lock_timeout_debug               | 1                       |
| tokudb_log_dir                          |                         |
| tokudb_max_lock_memory                  | 33791557120             |
| tokudb_optimize_index_fraction          | 1.000000                |
| tokudb_optimize_index_name              |                         |
| tokudb_optimize_throttle                | 0                       |
| tokudb_prelock_empty                    | ON                      |
| tokudb_read_block_size                  | 65536                   |
| tokudb_read_buf_size                    | 131072                  |
| tokudb_read_status_frequency            | 10000                   |
| tokudb_row_format                       | tokudb_zlib             |
| tokudb_rpl_check_readonly               | ON                      |
| tokudb_rpl_lookup_rows                  | ON                      |
| tokudb_rpl_lookup_rows_delay            | 0                       |
| tokudb_rpl_unique_checks                | ON                      |
| tokudb_rpl_unique_checks_delay          | 0                       |
| tokudb_strip_frm_data                   | OFF                     |
| tokudb_support_xa                       | ON                      |
| tokudb_tmp_dir                          |                         |
| tokudb_version                          | 5.7.22-22               |
| tokudb_write_status_frequency           | 1000                    |
+-----------------------------------------+-------------------------+
67 rows in set (0.01 sec)
RocksDB system variables
mysql> show variables like 'rocks%'; +-------------------------------------------------+--------------------------------------------------------------------+ | Variable_name | Value | +-------------------------------------------------+--------------------------------------------------------------------+ | rocksdb_access_hint_on_compaction_start | 1 | | rocksdb_advise_random_on_open | ON | | rocksdb_allow_concurrent_memtable_write | OFF | | rocksdb_allow_mmap_reads | OFF | | rocksdb_allow_mmap_writes | OFF | | rocksdb_allow_to_start_after_corruption | OFF | | rocksdb_block_cache_size | 536870912 | | rocksdb_block_restart_interval | 16 | | rocksdb_block_size | 4096 | | rocksdb_block_size_deviation | 10 | | rocksdb_bulk_load | OFF | | rocksdb_bulk_load_allow_unsorted | OFF | | rocksdb_bulk_load_size | 1000 | | rocksdb_bytes_per_sync | 0 | | rocksdb_cache_index_and_filter_blocks | ON | | rocksdb_checksums_pct | 100 | | rocksdb_collect_sst_properties | ON | | rocksdb_commit_in_the_middle | OFF | | rocksdb_compact_cf | | | rocksdb_compaction_readahead_size | 0 | | rocksdb_compaction_sequential_deletes | 0 | | rocksdb_compaction_sequential_deletes_count_sd | OFF | | rocksdb_compaction_sequential_deletes_file_size | 0 | | rocksdb_compaction_sequential_deletes_window | 0 | | rocksdb_concurrent_prepare | ON | | rocksdb_create_checkpoint | | | rocksdb_create_if_missing | ON | | rocksdb_create_missing_column_families | OFF | | rocksdb_datadir | ./.rocksdb | | rocksdb_db_write_buffer_size | 0 | | rocksdb_deadlock_detect | OFF | | rocksdb_deadlock_detect_depth | 50 | | rocksdb_debug_optimizer_no_zero_cardinality | ON | | rocksdb_debug_ttl_ignore_pk | OFF | | rocksdb_debug_ttl_read_filter_ts | 0 | | rocksdb_debug_ttl_rec_ts | 0 | | rocksdb_debug_ttl_snapshot_ts | 0 | | rocksdb_default_cf_options | compression=kLZ4Compression;bottommost_compression=kLZ4Compression | | rocksdb_delayed_write_rate | 0 | | rocksdb_delete_obsolete_files_period_micros | 21600000000 | | rocksdb_enable_bulk_load_api | ON | | rocksdb_enable_thread_tracking | ON | | rocksdb_enable_ttl | ON | | rocksdb_enable_ttl_read_filtering | ON | | rocksdb_enable_write_thread_adaptive_yield | OFF | | rocksdb_error_if_exists | OFF | | rocksdb_flush_log_at_trx_commit | 1 | | rocksdb_force_compute_memtable_stats | ON | | rocksdb_force_compute_memtable_stats_cachetime | 60000000 | | rocksdb_force_flush_memtable_and_lzero_now | OFF | | rocksdb_force_flush_memtable_now | OFF | | rocksdb_force_index_records_in_range | 0 | | rocksdb_hash_index_allow_collision | ON | | rocksdb_ignore_unknown_options | ON | | rocksdb_index_type | kBinarySearch | | rocksdb_info_log_level | error_level | | rocksdb_is_fd_close_on_exec | ON | | rocksdb_keep_log_file_num | 1000 | | rocksdb_large_prefix | OFF | | rocksdb_lock_scanned_rows | OFF | | rocksdb_lock_wait_timeout | 1 | | rocksdb_log_file_time_to_roll | 0 | | rocksdb_manifest_preallocation_size | 4194304 | | rocksdb_manual_wal_flush | ON | | rocksdb_max_background_jobs | 2 | | rocksdb_max_latest_deadlocks | 5 | | rocksdb_max_log_file_size | 0 | | rocksdb_max_manifest_file_size | 18446744073709551615 | | rocksdb_max_open_files | 512 | | rocksdb_max_row_locks | 1048576 | | rocksdb_max_subcompactions | 1 | | rocksdb_max_total_wal_size | 0 | | rocksdb_merge_buf_size | 67108864 | | rocksdb_merge_combine_read_size | 1073741824 | | rocksdb_merge_tmp_file_removal_delay_ms | 0 | | rocksdb_new_table_reader_for_compaction_inputs | OFF | | rocksdb_no_block_cache | OFF | | rocksdb_override_cf_options | | | rocksdb_paranoid_checks | ON | | rocksdb_pause_background_work | OFF | | rocksdb_perf_context_level | 0 | | rocksdb_persistent_cache_path | | | rocksdb_persistent_cache_size_mb | 0 | | rocksdb_pin_l0_filter_and_index_blocks_in_cache | ON | | rocksdb_print_snapshot_conflict_queries | OFF | | rocksdb_rate_limiter_bytes_per_sec | 0 | | rocksdb_read_free_rpl_tables | | | rocksdb_records_in_range | 0 | | rocksdb_reset_stats | OFF | | rocksdb_rpl_skip_tx_api | OFF | | rocksdb_seconds_between_stat_computes | 3600 | | rocksdb_signal_drop_index_thread | OFF | | rocksdb_sim_cache_size | 0 | | rocksdb_skip_bloom_filter_on_read | OFF | | rocksdb_skip_fill_cache | OFF | | rocksdb_sst_mgr_rate_bytes_per_sec | 0 | | rocksdb_stats_dump_period_sec | 600 | | rocksdb_store_row_debug_checksums | OFF | | rocksdb_strict_collation_check | ON | | rocksdb_strict_collation_exceptions | | | rocksdb_table_cache_numshardbits | 6 | | rocksdb_table_stats_sampling_pct | 10 | | rocksdb_tmpdir | | | rocksdb_trace_sst_api | OFF | | rocksdb_two_write_queues | ON | | rocksdb_unsafe_for_binlog | OFF | | rocksdb_update_cf_options | | | rocksdb_use_adaptive_mutex | OFF | | rocksdb_use_direct_io_for_flush_and_compaction | OFF | | rocksdb_use_direct_reads | OFF | | rocksdb_use_fsync | OFF | | rocksdb_validate_tables | 1 | | rocksdb_verify_row_debug_checksums | OFF | | rocksdb_wal_bytes_per_sync | 0 | | rocksdb_wal_dir | | | rocksdb_wal_recovery_mode | 1 | | rocksdb_wal_size_limit_mb | 0 | | rocksdb_wal_ttl_seconds | 0 | | rocksdb_whole_key_filtering | ON | | rocksdb_write_batch_max_bytes | 0 | | rocksdb_write_disable_wal | OFF | | rocksdb_write_ignore_missing_column_families | OFF | +-------------------------------------------------+--------------------------------------------------------------------+ 122 rows in set (0.00 sec)
InnoDB system variables
mysql> show variables like 'innod%'; +-------------------------------------------+------------------------+ | Variable_name | Value | +-------------------------------------------+------------------------+ | innodb_adaptive_flushing | ON | | innodb_adaptive_flushing_lwm | 10 | | innodb_adaptive_hash_index | ON | | innodb_adaptive_hash_index_parts | 8 | | innodb_adaptive_max_sleep_delay | 150000 | | innodb_api_bk_commit_interval | 5 | | innodb_api_disable_rowlock | OFF | | innodb_api_enable_binlog | OFF | | innodb_api_enable_mdl | OFF | | innodb_api_trx_level | 0 | | innodb_autoextend_increment | 64 | | innodb_autoinc_lock_mode | 1 | | innodb_buffer_pool_chunk_size | 134217728 | | innodb_buffer_pool_dump_at_shutdown | ON | | innodb_buffer_pool_dump_now | OFF | | innodb_buffer_pool_dump_pct | 25 | | innodb_buffer_pool_filename | ib_buffer_pool | | innodb_buffer_pool_instances | 1 | | innodb_buffer_pool_load_abort | OFF | | innodb_buffer_pool_load_at_startup | ON | | innodb_buffer_pool_load_now | OFF | | innodb_buffer_pool_size | 134217728 | | innodb_change_buffer_max_size | 25 | | innodb_change_buffering | all | | innodb_checksum_algorithm | crc32 | | innodb_checksums | ON | | innodb_cleaner_lsn_age_factor | high_checkpoint | | innodb_cmp_per_index_enabled | OFF | | innodb_commit_concurrency | 0 | | innodb_compressed_columns_threshold | 96 | | innodb_compressed_columns_zip_level | 6 | | innodb_compression_failure_threshold_pct | 5 | | innodb_compression_level | 6 | | innodb_compression_pad_pct_max | 50 | | innodb_concurrency_tickets | 5000 | | innodb_corrupt_table_action | assert | | innodb_data_file_path | ibdata1:12M:autoextend | | innodb_data_home_dir | | | innodb_deadlock_detect | ON | | innodb_default_row_format | dynamic | | innodb_disable_sort_file_cache | OFF | | innodb_doublewrite | ON | | innodb_empty_free_list_algorithm | backoff | | innodb_encrypt_online_alter_logs | OFF | | innodb_encrypt_tables | OFF | | innodb_fast_shutdown | 1 | | innodb_file_format | Barracuda | | innodb_file_format_check | ON | | innodb_file_format_max | Barracuda | | innodb_file_per_table | ON | | innodb_fill_factor | 100 | | innodb_flush_log_at_timeout | 1 | | innodb_flush_log_at_trx_commit | 1 | | innodb_flush_method | | | innodb_flush_neighbors | 1 | | innodb_flush_sync | ON | | innodb_flushing_avg_loops | 30 | | innodb_force_load_corrupted | OFF | | innodb_force_recovery | 0 | | innodb_ft_aux_table | | | innodb_ft_cache_size | 8000000 | | innodb_ft_enable_diag_print | OFF | | innodb_ft_enable_stopword | ON | | innodb_ft_ignore_stopwords | OFF | | innodb_ft_max_token_size | 84 | | innodb_ft_min_token_size | 3 | | innodb_ft_num_word_optimize | 2000 | | innodb_ft_result_cache_limit | 2000000000 | | innodb_ft_server_stopword_table | | | innodb_ft_sort_pll_degree | 2 | | innodb_ft_total_cache_size | 640000000 | | innodb_ft_user_stopword_table | | | innodb_io_capacity | 200 | | innodb_io_capacity_max | 2000 | | innodb_kill_idle_transaction | 0 | | innodb_large_prefix | ON | | innodb_lock_wait_timeout | 50 | | innodb_locks_unsafe_for_binlog | OFF | | innodb_log_buffer_size | 16777216 | | innodb_log_checksums | ON | | innodb_log_compressed_pages | ON | | innodb_log_file_size | 50331648 | | innodb_log_files_in_group | 2 | | innodb_log_group_home_dir | ./ | | innodb_log_write_ahead_size | 8192 | | innodb_lru_scan_depth | 1024 | | innodb_max_bitmap_file_size | 104857600 | | innodb_max_changed_pages | 1000000 | | innodb_max_dirty_pages_pct | 75.000000 | | innodb_max_dirty_pages_pct_lwm | 0.000000 | | innodb_max_purge_lag | 0 | | innodb_max_purge_lag_delay | 0 | | innodb_max_undo_log_size | 1073741824 | | innodb_monitor_disable | | | innodb_monitor_enable | | | innodb_monitor_reset | | | innodb_monitor_reset_all | | | innodb_numa_interleave | OFF | | innodb_old_blocks_pct | 37 | | innodb_old_blocks_time | 1000 | | innodb_online_alter_log_max_size | 134217728 | | innodb_open_files | 431 | | innodb_optimize_fulltext_only | OFF | | innodb_page_cleaners | 1 | | innodb_page_size | 16384 | | innodb_parallel_doublewrite_path | xb_doublewrite | | innodb_print_all_deadlocks | OFF | | innodb_print_lock_wait_timeout_info | OFF | | innodb_purge_batch_size | 300 | | innodb_purge_rseg_truncate_frequency | 128 | | innodb_purge_threads | 4 | | innodb_random_read_ahead | OFF | | innodb_read_ahead_threshold | 56 | | innodb_read_io_threads | 4 | | innodb_read_only | OFF | | innodb_replication_delay | 0 | | innodb_rollback_on_timeout | OFF | | innodb_rollback_segments | 128 | | innodb_show_locks_held | 10 | | innodb_show_verbose_locks | 0 | | innodb_sort_buffer_size | 1048576 | | innodb_spin_wait_delay | 6 | | innodb_stats_auto_recalc | ON | | innodb_stats_include_delete_marked | OFF | | innodb_stats_method | nulls_equal | | innodb_stats_on_metadata | OFF | | innodb_stats_persistent | ON | | innodb_stats_persistent_sample_pages | 20 | | innodb_stats_sample_pages | 8 | | innodb_stats_transient_sample_pages | 8 | | innodb_status_output | OFF | | innodb_status_output_locks | OFF | | innodb_strict_mode | ON | | innodb_support_xa | ON | | innodb_sync_array_size | 1 | | innodb_sync_spin_loops | 30 | | innodb_table_locks | ON | | innodb_temp_data_file_path | ibtmp1:12M:autoextend | | innodb_temp_tablespace_encrypt | OFF | | innodb_thread_concurrency | 0 | | innodb_thread_sleep_delay | 10000 | | innodb_tmpdir | | | innodb_track_changed_pages | OFF | | innodb_undo_directory | ./ | | innodb_undo_log_truncate | OFF | | innodb_undo_logs | 128 | | innodb_undo_tablespaces | 0 | | innodb_use_global_flush_log_at_trx_commit | ON | | innodb_use_native_aio | ON | | innodb_version | 5.7.22-22 | | innodb_write_io_threads | 4 | +-------------------------------------------+------------------------+ 151 rows in set (0.00 sec)
Benchmarking OLTP INSERT performance on TokuDB, RocksDB and InnoDB
TokuDB OLTP INSERT performance benchmarking using Sysbench
Building Database Infrastructure for benchmarking (Percona Server with TokuDB) with INSERT operations:
root@blr1p01-pfm-008:/usr/share/sysbench# sysbench oltp_insert.lua --threads=100 --time=1800 --table-size=100000000  --db-driver=mysql --mysql-db=test --mysql-socket=/var/run/mysqld/mysqld.sock --mysql-user=root --mysql-password=USEYOURPASSWORD --mysql-storage-engine=tokudb prepare
sysbench 1.0.15 (using bundled LuaJIT 2.1.0-beta2)

Initializing worker threads...

Creating table 'sbtest1'...
Inserting 100000000 records into 'sbtest1'
Creating a secondary index on 'sbtest1'...
“sbtest1” schema structure ( TokuDB storage engine with 100M rows)
mysql> show table status like 'sbtest1%'\G;
*************************** 1. row ***************************
Name: sbtest1
Engine: TokuDB
Version: 10
Row_format: tokudb_zlib
Rows: 100000000
Avg_row_length: 189
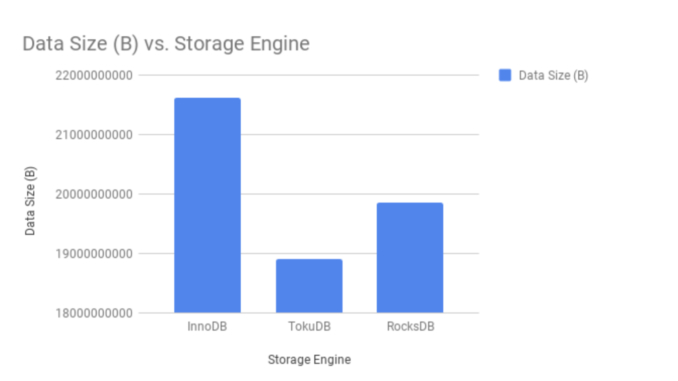
Data_length: 18900000000
Max_data_length: 9223372036854775807
Index_length: 860808942
Data_free: 18446744065817975570
Auto_increment: 100000001
Create_time: 2018-08-03 23:03:35
Update_time: 2018-08-03 23:23:51
Check_time: NULL
Collation: latin1_swedish_ci
Checksum: NULL
Create_options:
Comment:
1 row in set (0.00 sec)
ERROR:
No query specified
Benchmarking TokuDB (with 100M rows) INSERT using Sysbench (oltp_insert.lua)
root@blr1p01-pfm-008:/usr/share/sysbench# sysbench oltp_insert.lua --threads=100 --time=1800 --table-size=100000000 --db-driver=mysql --mysql-db=test --mysql-socket=/var/run/mysqld/mysqld.sock --mysql-user=root --mysql-password=USEYOURPASSWORD --mysql-storage-engine=tokudb run
Monitoring the benchmarking
mysql> show full processlist\G;
*************************** 1. row ***************************
           Id: 106
         User: root
         Host: localhost
           db: test
      Command: Query
         Time: 0
        State: update
         Info: INSERT INTO sbtest1 (id, k, c, pad) VALUES (0, 49754892, '62632931051-58961919101-49940198850-21078424594-43546312816-91483171956-63147821178-73320074434-75390450161-85244468625', '72758152721-79346997448-32739052749-09956023061-33461120469')
    Rows_sent: 0
Rows_examined: 0
*************************** 2. row ***************************
           Id: 107
         User: root
         Host: localhost
           db: test
      Command: Query
         Time: 0
        State: update
         Info: INSERT INTO sbtest1 (id, k, c, pad) VALUES (0, 38299901, '73492364485-17164009439-13897782190-82384134069-56725118845-05888552123-04466761496-73013947541-76946111000-82170241506', '57825848902-56599269429-55553620227-85565361679-86108748354')
    Rows_sent: 0
Rows_examined: 0
*************************** 3. row ***************************
           Id: 108
         User: root
         Host: localhost
           db: test
      Command: Query
         Time: 0
        State: closing tables
         Info: INSERT INTO sbtest1 (id, k, c, pad) VALUES (0, 50461359, '82489034494-43306780333-31830745333-81619557910-15670574031-38606658735-35015531633-82686313168-29930813640-55800112343', '98734612239-15166737116-32153746057-36526618555-01917900606')
    Rows_sent: 0
Rows_examined: 0
*************************** 4. row ***************************
           Id: 109
         User: root
         Host: localhost
           db: test
      Command: Query
         Time: 0
        State: update
         Info: INSERT INTO sbtest1 (id, k, c, pad) VALUES (0, 50305368, '26004165285-71866035101-19429620467-21730816230-28360163045-85578016857-31504027785-22011080750-52188150293-29047779256', '40086488864-24563838334-16649832399-35567929449-35827527600')
    Rows_sent: 0
Rows_examined: 0

*************************** 98. row ***************************
           Id: 203
         User: root
         Host: localhost
           db: test
      Command: Query
         Time: 0
        State: update
         Info: INSERT INTO sbtest1 (id, k, c, pad) VALUES (0, 50008367, '08590860349-55330969614-92736003669-70093680275-08791372163-86879862146-65906035624-31616634007-39285699730-30091204027', '03546380555-08125979095-56416888610-57364610871-45465441885')
    Rows_sent: 0
Rows_examined: 0
*************************** 99. row ***************************
           Id: 204
         User: root
         Host: localhost
           db: test
      Command: Query
         Time: 0
        State: update
         Info: INSERT INTO sbtest1 (id, k, c, pad) VALUES (0, 54541565, '62284574810-41408816172-84693515960-17097326417-15199773762-35816031089-51785557714-03836189148-75055812047-57404275889', '89419445215-23758954221-31182195029-89303506158-96423989766')
    Rows_sent: 0
Rows_examined: 0
*************************** 100. row ***************************
           Id: 205
         User: root
         Host: localhost
           db: test
      Command: Query
         Time: 0
        State: update
         Info: INSERT INTO sbtest1 (id, k, c, pad) VALUES (0, 49961655, '04968809340-71773840704-69257717063-97968863839-17701720758-38065324563-11587467460-13905955489-57279753705-77707929689', '02758577051-41889982054-46749141829-07683639044-92209230468')
    Rows_sent: 0
Rows_examined: 0
*************************** 101. row ***************************
           Id: 206
         User: root
         Host: localhost
           db: NULL
      Command: Query
         Time: 0
        State: starting
         Info: show full processlist
    Rows_sent: 0
Rows_examined: 0
101 rows in set (0.00 sec)

ERROR:
No query specified
Result
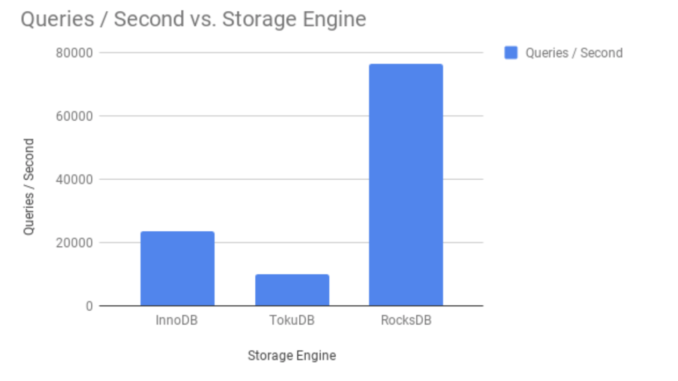
When interpreting the benchmarking results, I look for transactions / queries per second (in this case, it is 10048.74 per sec.) and average latency (9.95 ms.) ,
root@blr1p01-pfm-008:/usr/share/sysbench# sysbench oltp_insert.lua --threads=100 --time=1800 --table-size=100000000 --db-driver=mysql --mysql-db=test --mysql-socket=/var/run/mysqld/mysqld.sock --mysql-user=root --mysql-password=USEYOURPASSWORD --mysql-storage-engine=tokudb run
sysbench 1.0.15 (using bundled LuaJIT 2.1.0-beta2)
Running the test with following options:
Number of threads: 100
Initializing random number generator from current time
Initializing worker threads...
Threads started!
SQL statistics:
queries performed:
read: 0
write: 18088064
other: 0
total: 18088064
transactions: 18088064 (10048.74 per sec.)
queries: 18088064 (10048.74 per sec.)
ignored errors: 0 (0.00 per sec.)
reconnects: 0 (0.00 per sec.)
General statistics:
total time: 1800.0299s
total number of events: 18088064
Latency (ms):
min: 0.24
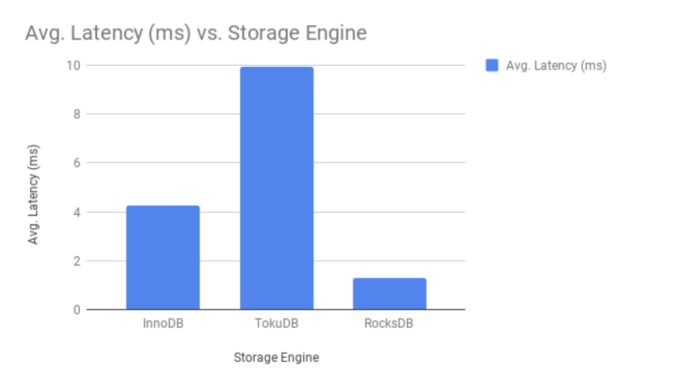
avg: 9.95
max: 210.80
95th percentile: 22.28
sum: 179905047.86
Threads fairness:
events (avg/stddev): 180880.6400/323.88
execution time (avg/stddev): 1799.0505/0.01
Benchmarking OLTP INSERT performance on RocksDB using Sysbench
Step 1 – Prepare data
sysbench oltp_insert.lua --threads=100 --time=1800 --table-size=100000000 --db-driver=mysql --mysql-db=test --mysql-socket=/var/run/mysqld/mysqld.sock --mysql-user=root --mysql-password=USEYOURPASSWORD --mysql-storage-engine=rocksdb prepare
Step 2 – “sbtest1” schema structure ( RocksDB storage engine with 100M rows)
mysql> show table status like 'sbtest1'\G;
*************************** 1. row ***************************
           Name: sbtest1
         Engine: ROCKSDB
        Version: 10
     Row_format: Fixed
           Rows: 100000000
 Avg_row_length: 198
    Data_length: 19855730417
Max_data_length: 0
   Index_length: 750521287
      Data_free: 0
 Auto_increment: 100000001
    Create_time: NULL
    Update_time: NULL
     Check_time: NULL
      Collation: latin1_swedish_ci
       Checksum: NULL
 Create_options:
        Comment:
1 row in set (0.01 sec)

ERROR:
No query specified
Step3 – Benchmarking OLTP INSERT performance on RocksDB
root@blr1p01-pfm-008:/usr/share/sysbench# sysbench oltp_insert.lua --threads=100 --time=1800 --table-size=100000000  --db-driver=mysql --mysql-db=test --mysql-socket=/var/run/mysqld/mysqld.sock --mysql-user=root --mysql-password=USEYOURPASSWORD --mysql-storage-engine=rocksdb run
sysbench 1.0.15 (using bundled LuaJIT 2.1.0-beta2)

Running the test with following options:
Number of threads: 100
Initializing random number generator from current time


Initializing worker threads...

Threads started!

SQL statistics:
    queries performed:
        read:                            0
        write:                           137298161
        other:                           0
        total:                           137298161
    transactions:                        137298161 (76275.15 per sec.)
    queries:                             137298161 (76275.15 per sec.)
    ignored errors:                      0      (0.00 per sec.)
    reconnects:                          0      (0.00 per sec.)

General statistics:
    total time:                          1800.0344s
    total number of events:              137298161

Latency (ms):
         min:                                    0.29
         avg:                                    1.31
         max:                                   66.32
         95th percentile:                        1.67
         sum:                            179465859.14

Threads fairness:
    events (avg/stddev):           1372981.6100/73.07
    execution time (avg/stddev):   1794.6586/0.02
Interpreting results
Transactions / Queries (per second) – 76275.15
Average latency (ms) – 1.31
Benchmarking OLTP INSERT performance on InnoDB using Sysbench
Step 1 – prepare data for benchmarking
root@blr1p01-pfm-008:/usr/share/sysbench# sysbench oltp_insert.lua --threads=100 --time=1800 --table-size=100000000  --db-driver=mysql --mysql-db=test --mysql-socket=/var/run/mysqld/mysqld.sock --mysql-user=root --mysql-password=USEYOURPASSWORD  prepare
sysbench 1.0.15 (using bundled LuaJIT 2.1.0-beta2)

Initializing worker threads...

Creating table 'sbtest1'...
Inserting 100000000 records into 'sbtest1'
Creating a secondary index on 'sbtest1'...
Step 2 – “sbtest1” schema structure ( InnoDB storage engine with 100M rows)
mysql> show table status like 'sbtest1%'\G;
*************************** 1. row ***************************
           Name: sbtest1
         Engine: InnoDB
        Version: 10
     Row_format: Dynamic
           Rows: 98682155
 Avg_row_length: 218
    Data_length: 21611151360
Max_data_length: 0
   Index_length: 0
      Data_free: 3145728
 Auto_increment: 100000001
    Create_time: 2018-08-04 17:14:04
    Update_time: 2018-08-04 17:11:01
     Check_time: NULL
      Collation: latin1_swedish_ci
       Checksum: NULL
 Create_options:
        Comment:
1 row in set (0.00 sec)

ERROR:
No query specified
Step3 – Benchmarking OLTP INSERT performance on InnoDB
root@blr1p01-pfm-008:/usr/share/sysbench# sysbench oltp_insert.lua --threads=100 --time=1800 --table-size=100000000  --db-driver=mysql --mysql-db=test --mysql-socket=/var/run/mysqld/mysqld.sock --mysql-user=root --mysql-password=USEYOURPASSWORD  run
sysbench 1.0.15 (using bundled LuaJIT 2.1.0-beta2)

Running the test with following options:
Number of threads: 100
Initializing random number generator from current time


Initializing worker threads...

Threads started!

SQL statistics:
    queries performed:
        read:                            0
        write:                           42243914
        other:                           0
        total:                           42243914
    transactions:                        42243914 (23468.40 per sec.)
    queries:                             42243914 (23468.40 per sec.)
    ignored errors:                      0      (0.00 per sec.)
    reconnects:                          0      (0.00 per sec.)

General statistics:
    total time:                          1800.0319s
    total number of events:              42243914

Latency (ms):
         min:                                    0.12
         avg:                                    4.26
         max:                                 1051.64
         95th percentile:                       21.50
         sum:                            179801087.85

Threads fairness:
    events (avg/stddev):           422439.1400/1171.09
    execution time (avg/stddev):   1798.0109/0.01
Interpreting results
Transactions / Queries (per second) – 23468.40
Average latency (ms) – 4.26
Graphical representation of OLTP INSERT performance in TokuDB, RocksDB and InnoDB:
Benchmarking OLTP READ-ONLY transactions performance on TokuDB, RocksDB and InnoDB
Benchmarking READ-ONLY OLTP transactions (100M records using oltp_read_only.lua) on TokuDB:
root@blr1p01-pfm-008:/usr/share/sysbench# sysbench oltp_read_only.lua --threads=100 --time=1800 --table-size=100000000 --db-driver=mysql --mysql-db=test --mysql-socket=/var/run/mysqld/mysqld.sock --mysql-storage-engine=tokudb --mysql-user=root --mysql-password=USEYOURPASSWORD prepare
Step 2- Confirm TokuDB schema is available with 100M records:
mysql> show table status like 'sbtest1%'\G;
*************************** 1. row ***************************
           Name: sbtest1
         Engine: TokuDB
        Version: 10
     Row_format: tokudb_zlib
           Rows: 100000000
 Avg_row_length: 189
    Data_length: 18900000000
Max_data_length: 9223372036854775807
   Index_length: 860426496
      Data_free: 18446744065835135232
 Auto_increment: 100000001
    Create_time: 2018-08-05 12:53:50
    Update_time: 2018-08-05 13:13:38
     Check_time: NULL
      Collation: latin1_swedish_ci
       Checksum: NULL
 Create_options:
        Comment:
1 row in set (0.00 sec)

ERROR:
No query specified
Step 3 – Benchmarking TokuDB OLTP READ-ONLY transaction performance:
root@blr1p01-pfm-008:/usr/share/sysbench# sysbench oltp_read_only.lua --threads=100 --time=1800 --table-size=100000000  --db-driver=mysql --mysql-db=test --mysql-socket=/var/run/mysqld/mysqld.sock --mysql-storage-engine=tokudb --mysql-user=root --mysql-password=USEYOURPASSWORD run
sysbench 1.0.15 (using bundled LuaJIT 2.1.0-beta2)

Running the test with following options:
Number of threads: 100
Initializing random number generator from current time


Initializing worker threads...

Threads started!

SQL statistics:
    queries performed:
        read:                            231960820
        write:                           0
        other:                           33137260
        total:                           265098080
    transactions:                        16568630 (9204.59 per sec.)
    queries:                             265098080 (147273.50 per sec.)
    ignored errors:                      0      (0.00 per sec.)
    reconnects:                          0      (0.00 per sec.)

General statistics:
    total time:                          1800.0348s
    total number of events:              16568630

Latency (ms):
         min:                                    1.71
         avg:                                   10.86
         max:                                   51.11
         95th percentile:                       13.22
         sum:                            179951191.99

Threads fairness:
    events (avg/stddev):           165686.3000/481.89
    execution time (avg/stddev):   1799.5119/0.01
Interpreting results
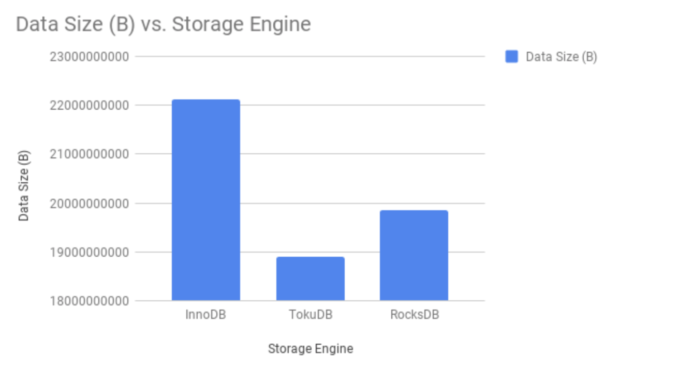
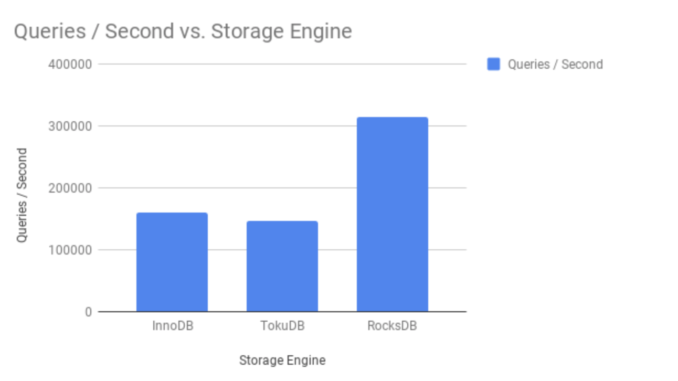
QPS (Queries per second) – 147273.50
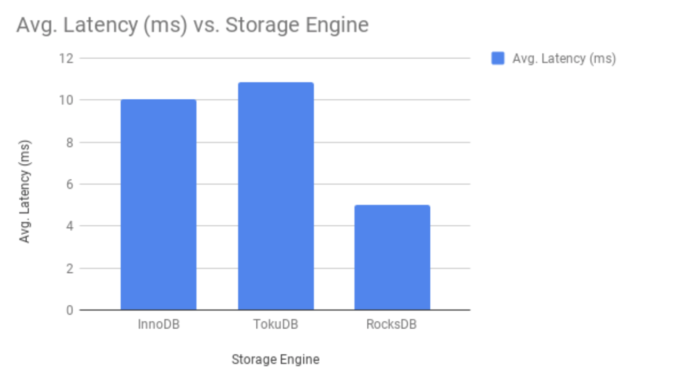
Average latency (ms) – 10.86
Benchmarking READ-ONLY OLTP transactions on RocksDB
Step 1- Build data(100M records using oltp_read_only.lua) for benchmarking:
root@blr1p01-pfm-008:/usr/share/sysbench# sysbench oltp_read_only.lua --threads=100 --time=1800 --table-size=100000000 --db-driver=mysql --mysql-db=test --mysql-socket=/var/run/mysqld/mysqld.sock --mysql-storage-engine=rocksdb --mysql-user=root --mysql-password=USEYOURPASSWORD prepare
Step 2- Confirm RocksDB schema is available with 100M records:
mysql> show table status like 'sbtest%'\G;
*************************** 1. row ***************************
           Name: sbtest1
         Engine: ROCKSDB
        Version: 10
     Row_format: Fixed
           Rows: 100000000
 Avg_row_length: 198
    Data_length: 19855730417
Max_data_length: 0
   Index_length: 750521333
      Data_free: 0
 Auto_increment: 100000001
    Create_time: NULL
    Update_time: NULL
     Check_time: NULL
      Collation: latin1_swedish_ci
       Checksum: NULL
 Create_options:
        Comment:
1 row in set (0.00 sec)

ERROR:
No query specified
Step 3 – Benchmarking RocksDB OLTP READ-ONLY transaction performance:
root@blr1p01-pfm-008:/usr/share/sysbench# sysbench oltp_read_only.lua --threads=100 --time=1800 --table-size=100000000  --db-driver=mysql --mysql-db=test --mysql-socket=/var/run/mysqld/mysqld.sock --mysql-storage-engine=rocksdb --mysql-user=root --mysql-password=USEYOURPASSWORD run
sysbench 1.0.15 (using bundled LuaJIT 2.1.0-beta2)

Running the test with following options:
Number of threads: 100
Initializing random number generator from current time


Initializing worker threads...

Threads started!

SQL statistics:
    queries performed:
        read:                            494461100
        write:                           0
        other:                           70637300
        total:                           565098400
    transactions:                        35318650 (19621.05 per sec.)
    queries:                             565098400 (313936.76 per sec.)
    ignored errors:                      0      (0.00 per sec.)
    reconnects:                          0      (0.00 per sec.)

General statistics:
    total time:                          1800.0349s
    total number of events:              35318650

Latency (ms):
         min:                                    1.80
         avg:                                    5.09
         max:                                  323.58
         95th percentile:                        7.70
         sum:                            179898262.01

Threads fairness:
    events (avg/stddev):           353186.5000/2619.22
    execution time (avg/stddev):   1798.9826/0.02
Interpreting results
QPS (Queries per second) – 313936.76
Average latency (ms) – 5.09
Benchmarking READ-ONLY OLTP transactions on InnoDB
Step 1: Build data (100M records using oltp_read_only.lua) for benchmarking:
root@blr1p01-pfm-008:/usr/share/sysbench# sysbench oltp_read_only.lua --threads=100 --time=1800 --table-size=100000000 --db-driver=mysql --mysql-db=test --mysql-socket=/var/run/mysqld/mysqld.sock --mysql-user=root --mysql-password=USEYOURPASSWORD prepare
Step 2 – Step 2- Confirm InnoDB schema is available with 100M records:
mysql> show table status like 'sbtest1'\G;
*************************** 1. row ***************************
           Name: sbtest1
         Engine: InnoDB
        Version: 10
     Row_format: Dynamic
           Rows: 98650703
 Avg_row_length: 224
    Data_length: 22126002176
Max_data_length: 0
   Index_length: 0
      Data_free: 3145728
 Auto_increment: 100000001
    Create_time: 2018-08-05 17:20:48
    Update_time: 2018-08-05 17:18:19
     Check_time: NULL
      Collation: latin1_swedish_ci
       Checksum: NULL
 Create_options:
        Comment:
1 row in set (0.00 sec)

ERROR:
No query specified
Step 3 – Benchmarking InnoDB OLTP READ-ONLY transaction performance:
root@blr1p01-pfm-008:/usr/share/sysbench# sysbench oltp_read_only.lua --threads=100 --time=1800 --table-size=100000000  --db-driver=mysql --mysql-db=test --mysql-socket=/var/run/mysqld/mysqld.sock  --mysql-user=root --mysql-password=USEYOURPASSWORD run
sysbench 1.0.15 (using bundled LuaJIT 2.1.0-beta2)

Running the test with following options:
Number of threads: 100
Initializing random number generator from current time


Initializing worker threads...

Threads started!

SQL statistics:
    queries performed:
        read:                            251061874
        write:                           0
        other:                           35865982
        total:                           286927856
    transactions:                        17932991 (9962.59 per sec.)
    queries:                             286927856 (159401.44 per sec.)
    ignored errors:                      0      (0.00 per sec.)
    reconnects:                          0      (0.00 per sec.)

General statistics:
    total time:                          1800.0300s
    total number of events:              17932991

Latency (ms):
         min:                                    1.66
         avg:                                   10.03
         max:                                 1478.79
         95th percentile:                       33.12
         sum:                            179947481.25

Threads fairness:
    events (avg/stddev):           179329.9100/1283.20
    execution time (avg/stddev):   1799.4748/0.01
Interpreting results
QPS (Queries per second) – 159401.44
Average latency (ms) – 10.03
Graphical representation of OLTP READ-ONLY transactions performance in TokuDB, RocksDB and InnoDB:
Benchmarking OLTP READ-WRITE transactions performance on TokuDB, RocksDB and InnoDB
Benchmarking READ-WRITE OLTP transactions on TokuDB
Step 1: Build data (100M records using oltp_read_write.lua) for benchmarking:
root@blr1p01-pfm-008:/usr/share/sysbench# sysbench oltp_read_write.lua --threads=100 --time=1800 --table-size=100000000 --db-driver=mysql --mysql-db=test --mysql-socket=/var/run/mysqld/mysqld.sock --mysql-storage-engine=tokudb --mysql-user=root --mysql-password=USEYOURPASSWORD prepare
Step 2- Confirm TokuDB schema is available with 100M records:
mysql> show table status like 'sbtest1%'\G;
*************************** 1. row ***************************
           Name: sbtest1
         Engine: TokuDB
        Version: 10
     Row_format: tokudb_zlib
           Rows: 100000000
 Avg_row_length: 189
    Data_length: 18900000000
Max_data_length: 9223372036854775807
   Index_length: 860645232
      Data_free: 18446744065834916496
 Auto_increment: 100000001
    Create_time: 2018-08-05 22:41:43
    Update_time: 2018-08-05 23:01:00
     Check_time: NULL
      Collation: latin1_swedish_ci
       Checksum: NULL
 Create_options:
        Comment:
1 row in set (0.00 sec)

ERROR:
No query specified
Step3 – Benchmarking OLTP READ-WRITE performance on TokuDB:
root@blr1p01-pfm-008:/usr/share/sysbench# sysbench oltp_read_write.lua --threads=100 --time=1800 --table-size=100000000  --db-driver=mysql --mysql-db=test --mysql-socket=/var/run/mysqld/mysqld.sock --mysql-storage-engine=tokudb --mysql-user=root --mysql-password=USEYOURPASSWORD run
sysbench 1.0.15 (using bundled LuaJIT 2.1.0-beta2)

Running the test with following options:
Number of threads: 100
Initializing random number generator from current time


Initializing worker threads...

Threads started!

SQL statistics:
    queries performed:
        read:                            19844342
        write:                           5669812
        other:                           2834906
        total:                           28349060
    transactions:                        1417453 (787.44 per sec.)
    queries:                             28349060 (15748.86 per sec.)
    ignored errors:                      0      (0.00 per sec.)
    reconnects:                          0      (0.00 per sec.)

General statistics:
    total time:                          1800.0668s
    total number of events:              1417453

Latency (ms):
         min:                                    3.90
         avg:                                  126.99
         max:                                  426.41
         95th percentile:                      147.61
         sum:                            179997357.31

Threads fairness:
    events (avg/stddev):           14174.5300/7.61
    execution time (avg/stddev):   1799.9736/0.02
Interpreting results
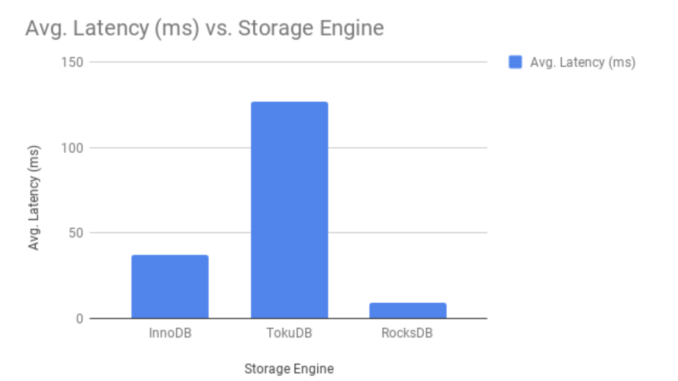
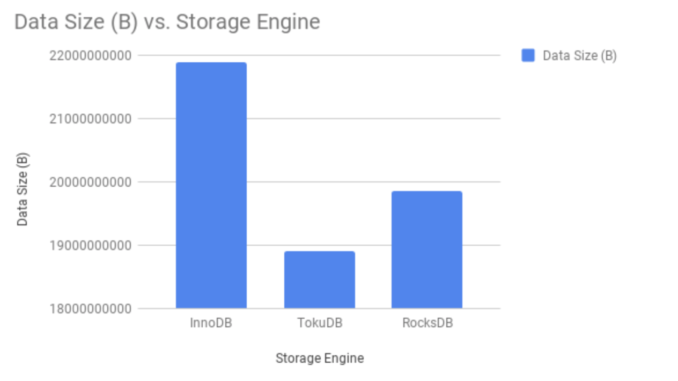
QPS (Queries per second) – 15748.86
Average latency (ms) – 126.99
Benchmarking READ-WRITE OLTP transactions on RocksDB
Step 1: Build data (100M records using oltp_read_write.lua) for benchmarking:
root@blr1p01-pfm-008:/usr/share/sysbench# sysbench oltp_read_write.lua --threads=100 --time=1800 --table-size=100000000 --db-driver=mysql --mysql-db=test --mysql-socket=/var/run/mysqld/mysqld.sock --mysql-storage-engine=rocksdb --mysql-user=root --mysql-password=USEYOURPASSWORD prepare
Step 2- Confirm RocksDB schema is available with 100M records:
mysql> show table status like 'sbtest1%'\G;
*************************** 1. row ***************************
           Name: sbtest1
         Engine: ROCKSDB
        Version: 10
     Row_format: Fixed
           Rows: 100000000
 Avg_row_length: 198
    Data_length: 19855694789
Max_data_length: 0
   Index_length: 750521319
      Data_free: 0
 Auto_increment: 100000001
    Create_time: NULL
    Update_time: NULL
     Check_time: NULL
      Collation: latin1_swedish_ci
       Checksum: NULL
 Create_options:
        Comment:
1 row in set (0.00 sec)

ERROR:
No query specified
Step3 – Benchmarking OLTP READ-WRITE performance on RocksDB:
root@blr1p01-pfm-008:/usr/share/sysbench# sysbench oltp_read_write.lua --threads=100 --time=1800 --table-size=100000000  --db-driver=mysql --mysql-db=test --mysql-socket=/var/run/mysqld/mysqld.sock --mysql-storage-engine=rocksdb --mysql-user=root --mysql-password=USEYOURPASSWORD run
sysbench 1.0.15 (using bundled LuaJIT 2.1.0-beta2)

Running the test with following options:
Number of threads: 100
Initializing random number generator from current time


Initializing worker threads...

Threads started!

SQL statistics:
    queries performed:
        read:                            286818014
        write:                           81910410
        other:                           40961372
        total:                           409689796
    transactions:                        20474371 (11374.39 per sec.)
    queries:                             409689796 (227600.23 per sec.)
    ignored errors:                      12630  (7.02 per sec.)
    reconnects:                          0      (0.00 per sec.)

General statistics:
    total time:                          1800.0375s
    total number of events:              20474371

Latency (ms):
         min:                                    2.50
         avg:                                    8.79
         max:                                  402.68
         95th percentile:                       12.75
         sum:                            179935638.52

Threads fairness:
    events (avg/stddev):           204743.7100/2264.14
    execution time (avg/stddev):   1799.3564/0.01
Interpreting results
QPS (Queries per second) – 227600.23
Average latency (ms) – 8.79
Benchmarking READ-WRITE OLTP transactions on InnoDB
Step 1: Build data (100M records using oltp_read_write.lua) for benchmarking:
root@blr1p01-pfm-008:/usr/share/sysbench# sysbench oltp_read_write.lua --threads=100 --time=1800 --table-size=100000000 --db-driver=mysql --mysql-db=test --mysql-socket=/var/run/mysqld/mysqld.sock --mysql-user=root --mysql-password=USEYOURPASSWORD prepare
Step 2- Confirm InnoDB schema is available with 100M records:
mysql> show table status like 'sbtest1%'\G;
*************************** 1. row ***************************
           Name: sbtest1
         Engine: InnoDB
        Version: 10
     Row_format: Dynamic
           Rows: 100000000
 Avg_row_length: 221
    Data_length: 21885878272
Max_data_length: 0
   Index_length: 0
      Data_free: 6291456
 Auto_increment: 100000001
    Create_time: 2018-08-06 10:24:54
    Update_time: 2018-08-06 10:31:53
     Check_time: NULL
      Collation: latin1_swedish_ci
       Checksum: NULL
 Create_options:
        Comment:
1 row in set (0.00 sec)

ERROR:
No query specified
Step3 – Benchmarking OLTP READ-WRITE performance on InnoDB:
root@blr1p01-pfm-008:/usr/share/sysbench# sysbench oltp_read_write.lua --threads=100 --time=1800 --table-size=100000000 --db-driver=mysql --mysql-db=test --mysql-socket=/var/run/mysqld/mysqld.sock --mysql-user=root --mysql-password=USEYOURPASSWORD run
sysbench 1.0.15 (using bundled LuaJIT 2.1.0-beta2)

Running the test with following options:
Number of threads: 100
Initializing random number generator from current time


Initializing worker threads...

Threads started!

SQL statistics:
    queries performed:
        read:                            67383470
        write:                           19251931
        other:                           9626043
        total:                           96261444
    transactions:                        4812938 (2673.78 per sec.)
    queries:                             96261444 (53477.03 per sec.)
    ignored errors:                      167    (0.09 per sec.)
    reconnects:                          0      (0.00 per sec.)

General statistics:
    total time:                          1800.0491s
    total number of events:              4812938

Latency (ms):
         min:                                    2.28
         avg:                                   37.40
         max:                                 1177.78
         95th percentile:                       71.83
         sum:                            179981855.37

Threads fairness:
    events (avg/stddev):           48129.3800/110.24
    execution time (avg/stddev):   1799.8186/0.00
Interpreting results
QPS (Queries per second) – 53477.03
Average latency (ms) – 37.40
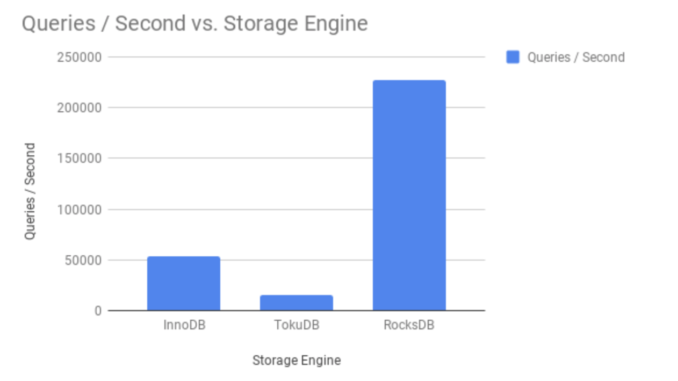
Graphical representation of OLTP READ-WRITE transactions performance in TokuDB, RocksDB and InnoDB:
Conclusion
The results of benchmarking concluded RocksDB the most ideal candidate for SSD based storage infrastructure compared to InnoDB and TokuDB, The most compelling reasons for using RocksDB on SSD are performance, storage efficiency/compression and much smaller write amplification compared to InnoDB or TokuDB.
The post Comparing TokuDB, RocksDB and InnoDB Performance on Intel(R) Xeon(R) Gold 6140 CPU appeared first on The WebScale Database Infrastructure Operations Experts.
]]>The post Benchmarking CPU, Memory, file I/O and mutex performance using Sysbench appeared first on The WebScale Database Infrastructure Operations Experts.
]]>Benchmarking CPU using Sysbench
This benchmark is configured with the number of simultaneous threads and the maximum number to verify if it is a prime.
[root@localhost shiv]# sysbench --test=cpu --cpu-max-prime=2000000 --num-threads=120 run
Running the test with following options:
Number of threads: 120
Initializing random number generator from current time


Prime numbers limit: 2000000

Initializing worker threads...

Threads started!

CPU speed:
    events per second:     0.69

Throughput:
    events/s (eps):                      0.6891
    time elapsed:                        174.1418s
    total number of events:              120

Latency (ms):
         min:                               169807.71
         avg:                               172640.02
         max:                               174120.65
         95th percentile:                   100000.00
         sum:                             20716802.25

Threads fairness:
    events (avg/stddev):           1.0000/0.00
    execution time (avg/stddev):   172.6400/0.83
[root@localhost shiv]# sysbench --test=threads --thread-locks=10 --max-time=60 run

sysbench 1.1.0-651e7fd (using bundled LuaJIT 2.1.0-beta3)

Running the test with following options:
Number of threads: 1
Initializing random number generator from current time


Initializing worker threads...

Threads started!


Throughput:
    events/s (eps):                      2366.0725
    time elapsed:                        60.0003s
    total number of events:              141965

Latency (ms):
         min:                                    0.38
         avg:                                    0.42
         max:                                    8.86
         95th percentile:                        0.53
         sum:                                59942.51

Threads fairness:
    events (avg/stddev):           141965.0000/0.00
    execution time (avg/stddev):   59.9425/0.00
To conclude the interpretation of thread performance benchmarking, we annotate time elapsed (actual time for the completion of the activity), in this case it “60.0003” seconds.
[root@localhost shiv]# sysbench --test=mutex --num-threads=130 run
WARNING: the --test option is deprecated. You can pass a script name or path on the command line without any options.
WARNING: --num-threads is deprecated, use --threads instead
sysbench 1.1.0-651e7fd (using bundled LuaJIT 2.1.0-beta3)

Running the test with following options:
Number of threads: 130
Initializing random number generator from current time


Initializing worker threads...

Threads started!


Throughput:
    events/s (eps):                      5.8047
    time elapsed:                        22.3956s
    total number of events:              130

Latency (ms):
         min:                                17566.82
         avg:                                20789.93
         max:                                22230.90
         95th percentile:                    21641.55
         sum:                              2702690.46

Threads fairness:
    events (avg/stddev):           1.0000/0.00
    execution time (avg/stddev):   20.7899/0.82
The throughput and average latency are the two matrices we consider to interpret mutex workload performance :
Throughput:
    events/s (eps):                      5.8047
    time elapsed:                        22.3956s

Latency (ms):
         min:                                17566.82
         avg:                                20789.93
         max:                                22230.90
         95th percentile:                    21641.55
         sum:                              2702690.46
Benchmarking the memory workload
When we use sysbench to benchmark memory, sysbench allocate a memory buffer and then read or write from/on it, each time for the size of a pointer (32 bit or 64 bit) and until the total buffer size has been read from or written to. This activity will be continued till the provided volume (–memory-total-size) is reached. The load can be increased or reduced by providing multiple threads (–num-threads), size of buffer (–memory-block-size) and request type (read / write / sequential / random)
[root@localhost shiv]# sysbench --test=memory --num-threads=140 --memory-total-size=10G run

sysbench 1.1.0-651e7fd (using bundled LuaJIT 2.1.0-beta3)

Running the test with following options:
Number of threads: 140
Initializing random number generator from current time


Running memory speed test with the following options:
  block size: 1KiB
  total size: 10240MiB
  operation: write
  scope: global

Initializing worker threads...

Threads started!

Total operations: 10485720 (3351958.44 per second)

10239.96 MiB transferred (3273.40 MiB/sec)


Throughput:
    events/s (eps):                      3351958.4393
    time elapsed:                        3.1282s
    total number of events:              10485720

Latency (ms):
         min:                                    0.00
         avg:                                    0.01
         max:                                 2931.98
         95th percentile:                        0.00
         sum:                               123371.54

Threads fairness:
    events (avg/stddev):           74898.0000/0.00
    execution time (avg/stddev):   0.8812/0.93
Throughput and operations per second are the important matrices to measure for memory workload benchmarking :
Total operations: 10485720 (3351958.44 per second)

10239.96 MiB transferred (3273.40 MiB/sec)
Benchmarking file system I/O with Sysbench
You can use multiple scenarios for benchmarking file system I/O but here we have used rndrw (combined random read / write) for more complex I/O and production similar I/O operations, This happens in three steps explained below:
- Prepare – Creates the files for testing
- Run – Performs the benchmarking and reporting
- Cleanup – Clean the system by deleting the files
Prepare
[root@localhost shiv]# sysbench --num-threads=16 --test=fileio --file-total-size=10G --file-test-mode=rndrw prepare

sysbench 1.1.0-651e7fd (using bundled LuaJIT 2.1.0-beta3)

128 files, 81920Kb each, 10240Mb total
Creating files for the test...
Extra file open flags: (none)
Reusing existing file test_file.0
Reusing existing file test_file.1
Reusing existing file test_file.2
Reusing existing file test_file.3
..................................
..................................

Reusing existing file test_file.122
Reusing existing file test_file.123
Reusing existing file test_file.124
Reusing existing file test_file.125
Reusing existing file test_file.126
Reusing existing file test_file.127
Run
[root@localhost shiv]# sysbench --num-threads=16 --test=fileio --file-total-size=10G --file-test-mode=rndrw run

sysbench 1.1.0-651e7fd (using bundled LuaJIT 2.1.0-beta3)

Running the test with following options:
Number of threads: 16
Initializing random number generator from current time


Extra file open flags: (none)
128 files, 80MiB each
10GiB total file size
Block size 16KiB
Number of IO requests: 0
Read/Write ratio for combined random IO test: 1.50
Periodic FSYNC enabled, calling fsync() each 100 requests.
Calling fsync() at the end of test, Enabled.
Using synchronous I/O mode
Doing random r/w test
Initializing worker threads...

Threads started!


Throughput:
         read:  IOPS=2495.85 39.00 MiB/s (40.89 MB/s)
         write: IOPS=1663.70 26.00 MiB/s (27.26 MB/s)
         fsync: IOPS=5311.68

Latency (ms):
         min:                                  0.00
         avg:                                  1.69
         max:                                631.90
         95th percentile:                      5.00
         sum:                             159794.48
Cleanup
[root@localhost shiv]# sysbench --num-threads=16 --test=fileio --file-total-size=10G --file-test-mode=rndrw cleanup
WARNING: the --test option is deprecated. You can pass a script name or path on the command line without any options.
WARNING: --num-threads is deprecated, use --threads instead
sysbench 1.1.0-651e7fd (using bundled LuaJIT 2.1.0-beta3)

Removing test files...
In the file system I/O benchmarking, We spend time annotating and interpreting only throughput (both reads and writes) under varying loads, Here in the test above read throughput is 40.89 MB/s and the write throughput is 27.26 MB/s
The post Benchmarking CPU, Memory, file I/O and mutex performance using Sysbench appeared first on The WebScale Database Infrastructure Operations Experts.
]]>The post Benchmarking MySQL 5.7 using Sysbench 1.1 appeared first on The WebScale Database Infrastructure Operations Experts.
]]>CPU – How long it takes for CPU to compute maximum primary number ? You may as well add how many threads are participating in this benchmarking process . This is very direct and easy way to benchmark the CPU performance.
File I/O – Benchmarking disk I/O performance considering all possible scenarios like direct io, sync, async etc. testing sequential reads / writes and random reads / writes , This makes an very scalable disk I/O benchmarking possible.
OLTP – Benchmarking MySQL under all possible workloads, like SELECT only queries (random / sequential SELECT) , INSERT / UPDATE / DELETE operations on multiple use case scenarios like bulk data loading, range-based updates, high volume data deletes (both random and sequential) etc. There is no MySQL benchmarking complete without Sysbench
Installing Sysbench
There are several ways to install Sysbench, It’s very well documented here – https://github.com/akopytov/sysbench#linux so we are not repeating it here again but we personally prefer installing Sysbench from source for many reasons so I have shared my method of installing Sysbench on CentOS
Git clone Sysbench :
[root@localhost Sysbench]# git clone https://github.com/akopytov/sysbench.git
Cloning into 'sysbench'...
remote: Counting objects: 8891, done.
remote: Total 8891 (delta 0), reused 0 (delta 0), pack-reused 8891
Receiving objects: 100% (8891/8891), 3.88 MiB | 1.47 MiB/s, done.
Resolving deltas: 100% (6320/6320), done.
[root@localhost sysbench]# ls
COPYING    Makefile.am       README-WIN.txt  autogen.sh  configure.ac  install-sh  missing        rpm      snap  tests
ChangeLog  README-Oracle.md  README.md       config      debian        m4          mkinstalldirs  scripts  src
Build Requirements (we use CentOS 7.3)
[root@localhost sysbench]# yum -y install make automake libtool pkgconfig libaio-devel

  Verifying  : glibc-2.17-157.el7.x86_64                                                                                             21/23
  Verifying  : libgomp-4.8.5-11.el7.x86_64                                                                                           22/23
  Verifying  : glibc-common-2.17-157.el7.x86_64                                                                                      23/23

Installed:
  automake.noarch 0:1.13.4-3.el7             libaio-devel.x86_64 0:0.3.109-13.el7             libtool.x86_64 0:2.4.2-22.el7_3

Dependency Installed:
  autoconf.noarch 0:2.69-11.el7              cpp.x86_64 0:4.8.5-16.el7_4.2                gcc.x86_64 0:4.8.5-16.el7_4.2
  glibc-devel.x86_64 0:2.17-196.el7_4.2      glibc-headers.x86_64 0:2.17-196.el7_4.2      kernel-headers.x86_64 0:3.10.0-693.21.1.el7
  libmpc.x86_64 0:1.0.1-3.el7                m4.x86_64 0:1.4.16-10.el7                    mpfr.x86_64 0:3.1.1-4.el7
  perl-Data-Dumper.x86_64 0:2.145-3.el7      perl-Test-Harness.noarch 0:3.28-3.el7        perl-Thread-Queue.noarch 0:3.02-2.el7

Dependency Updated:
  glibc.x86_64 0:2.17-196.el7_4.2             glibc-common.x86_64 0:2.17-196.el7_4.2           libgcc.x86_64 0:4.8.5-16.el7_4.2
  libgomp.x86_64 0:4.8.5-16.el7_4.2

Complete!
[root@localhost sysbench]# yum -y install mysql-devel

  Verifying  : e2fsprogs-libs-1.42.9-9.el7.x86_64                                                                                    34/35
  Verifying  : krb5-libs-1.14.1-26.el7.x86_64                                                                                        35/35

Installed:
  mariadb-devel.x86_64 1:5.5.56-2.el7

Dependency Installed:
  keyutils-libs-devel.x86_64 0:1.5.8-3.el7       krb5-devel.x86_64 0:1.15.1-8.el7           libcom_err-devel.x86_64 0:1.42.9-10.el7
  libkadm5.x86_64 0:1.15.1-8.el7                 libselinux-devel.x86_64 0:2.5-11.el7       libsepol-devel.x86_64 0:2.5-6.el7
  libverto-devel.x86_64 0:0.2.5-4.el7            openssl-devel.x86_64 1:1.0.2k-8.el7        pcre-devel.x86_64 0:8.32-17.el7
  zlib-devel.x86_64 0:1.2.7-17.el7

Dependency Updated:
  e2fsprogs.x86_64 0:1.42.9-10.el7             e2fsprogs-libs.x86_64 0:1.42.9-10.el7         krb5-libs.x86_64 0:1.15.1-8.el7
  libcom_err.x86_64 0:1.42.9-10.el7            libselinux.x86_64 0:2.5-11.el7                libselinux-python.x86_64 0:2.5-11.el7
  libselinux-utils.x86_64 0:2.5-11.el7         libss.x86_64 0:1.42.9-10.el7                  mariadb-libs.x86_64 1:5.5.56-2.el7
  openssl.x86_64 1:1.0.2k-8.el7                openssl-libs.x86_64 1:1.0.2k-8.el7            pcre.x86_64 0:8.32-17.el7

Complete!
Install Sysbench from source
Step 1 – Run “autogen.sh”
[root@localhost sysbench]# ./autogen.sh
perl: warning: Setting locale failed.
perl: warning: Please check that your locale settings:
	LANGUAGE = (unset),
	LC_ALL = (unset),
	LC_CTYPE = "UTF-8",
	LANG = "en_US.UTF-8"

configure.ac:59: installing 'config/ar-lib'
configure.ac:45: installing 'config/compile'
configure.ac:27: installing 'config/config.guess'
configure.ac:27: installing 'config/config.sub'
configure.ac:32: installing 'config/install-sh'
configure.ac:32: installing 'config/missing'
src/Makefile.am: installing 'config/depcomp'
parallel-tests: installing 'config/test-driver'
autoreconf: Leaving directory `.'
Step 2 – Run “configure.sh”
[root@localhost sysbench]# ls
COPYING      Makefile.in       README.md   autom4te.cache  configure.ac  m4             rpm      src
ChangeLog    README-Oracle.md  aclocal.m4  config          debian        missing        scripts  tests
Makefile.am  README-WIN.txt    autogen.sh  configure       install-sh    mkinstalldirs  snap     third_party
[root@localhost sysbench]# ./configure
checking build system type... x86_64-unknown-linux-gnu
checking host system type... x86_64-unknown-linux-gnu
checking target system type... x86_64-unknown-linux-gnu

===============================================================================
sysbench version   : 1.1.0-651e7fd
CC                 : gcc -std=gnu99
CFLAGS             : -O3 -funroll-loops -ggdb3  -march=core2 -Wall -Wextra -Wpointer-arith -Wbad-function-cast -Wstrict-prototypes -Wnested-externs -Wno-format-zero-length -Wundef -Wstrict-prototypes -Wmissing-prototypes -Wmissing-declarations -Wredundant-decls -Wcast-align   -pthread
CPPFLAGS           : -D_GNU_SOURCE   -I$(top_srcdir)/src -I$(abs_top_builddir)/third_party/luajit/inc -I$(abs_top_builddir)/third_party/concurrency_kit/include
LDFLAGS            : -L/usr/local/lib
LIBS               : -laio -lm

prefix             : /usr/local
bindir             : ${prefix}/bin
libexecdir         : ${prefix}/libexec
mandir             : ${prefix}/share/man
datadir            : ${prefix}/share

MySQL support      : yes
Drizzle support    : no
AttachSQL support  : no
Oracle support     : no
PostgreSQL support : no

LuaJIT             : bundled
LUAJIT_CFLAGS      : -I$(abs_top_builddir)/third_party/luajit/inc
LUAJIT_LIBS        : $(abs_top_builddir)/third_party/luajit/lib/libluajit-5.1.a -ldl
LUAJIT_LDFLAGS     : -rdynamic

Concurrency Kit    : bundled
CK_CFLAGS          : -I$(abs_top_builddir)/third_party/concurrency_kit/include
CK_LIBS            : $(abs_top_builddir)/third_party/concurrency_kit/lib/libck.a
configure flags    :
===============================================================================
Step 3 – Make sysbench for MySQL benchmarking with Lua scripts
[root@localhost sysbench]#
[root@localhost sysbench]# make -j
Making all in third_party/luajit
make[1]: Entering directory `/home/shiv/Sysbench/sysbench/third_party/luajit'
make -C ./luajit clean
make[2]: Entering directory `/home/shiv/Sysbench/sysbench/third_party/luajit/luajit'
make -C src clean
make[3]: Entering directory `/home/shiv/Sysbench/sysbench/third_party/luajit/luajit/src'
rm -f luajit libluajit.a libluajit.so host/minilua host/buildvm lj_vm.S lj_bcdef.h lj_ffdef.h lj_libdef.h lj_recdef.h lj_folddef.h host/buildvm_arch.h jit/vmdef.lua *.o host/*.o *.obj *.lib *.exp *.dll *.exe *.manifest *.pdb *.ilk
make[3]: Leaving directory `/home/shiv/Sysbench/sysbench/third_party/luajit/luajit/src'
make[2]: Leaving directory `/home/shiv/Sysbench/sysbench/third_party/luajit/luajit'

libtool: link: gcc -std=gnu99 -Wall -Wextra -Wpointer-arith -Wbad-function-cast -Wstrict-prototypes -Wnested-externs -Wno-format-zero-length -Wundef -Wstrict-prototypes -Wmissing-prototypes -Wmissing-declarations -Wredundant-decls -Wcast-align -pthread -O3 -funroll-loops -ggdb3 -march=core2 -rdynamic -o sysbench sysbench.o sb_timer.o sb_options.o sb_logger.o db_driver.o sb_histogram.o sb_rand.o sb_thread.o sb_barrier.o sb_lua.o sb_util.o sb_counter.o  -L/usr/local/lib tests/fileio/libsbfileio.a tests/threads/libsbthreads.a tests/memory/libsbmemory.a tests/cpu/libsbcpu.a tests/mutex/libsbmutex.a drivers/mysql/libsbmysql.a -L/usr/lib64/mysql -lmysqlclient -lpthread -lz -lssl -lcrypto /home/shiv/Sysbench/sysbench/third_party/luajit/lib/libluajit-5.1.a -ldl /home/shiv/Sysbench/sysbench/third_party/concurrency_kit/lib/libck.a -laio -lm -pthread
make[2]: Leaving directory `/home/shiv/Sysbench/sysbench/src'
make[1]: Leaving directory `/home/shiv/Sysbench/sysbench/src'
Making all in tests
make[1]: Entering directory `/home/shiv/Sysbench/sysbench/tests'
make[1]: Nothing to be done for `all'.
make[1]: Leaving directory `/home/shiv/Sysbench/sysbench/tests'
make[1]: Entering directory `/home/shiv/Sysbench/sysbench'
make[1]: Nothing to be done for `all-am'.
make[1]: Leaving directory `/home/shiv/Sysbench/sysbench'
[root@localhost sysbench]#
[root@localhost sysbench]# make install
Making install in third_party/luajit
make[1]: Entering directory `/home/shiv/Sysbench/sysbench/third_party/luajit'
make[2]: Entering directory `/home/shiv/Sysbench/sysbench/third_party/luajit'
make[2]: Nothing to be done for `install-exec-am'.
make[2]: Nothing to be done for `install-data-am'.
make[2]: Leaving directory `/home/shiv/Sysbench/sysbench/third_party/luajit'
make[1]: Leaving directory `/home/shiv/Sysbench/sysbench/third_party/luajit'
Making install in third_party/concurrency_kit
make[1]: Entering directory `/home/shiv/Sysbench/sysbench/third_party/concurrency_kit'
make[2]: Entering directory `/home/shiv/Sysbench/sysbench/third_party/concurrency_kit'
make[2]: Nothing to be done for `install-exec-am'.
make[2]: Nothing to be done for `install-data-am'.
make[2]: Leaving directory `/home/shiv/Sysbench/sysbench/third_party/concurrency_kit'
make[1]: Leaving directory `/home/shiv/Sysbench/sysbench/third_party/concurrency_kit'
Making install in src
make[1]: Entering directory `/home/shiv/Sysbench/sysbench/src'

 /usr/bin/mkdir -p '/usr/local/share/sysbench/tests'
 /usr/bin/install -c test_run.sh '/usr/local/share/sysbench/tests'
make[2]: Leaving directory `/home/shiv/Sysbench/sysbench/tests'
make[1]: Leaving directory `/home/shiv/Sysbench/sysbench/tests'
make[1]: Entering directory `/home/shiv/Sysbench/sysbench'
make[2]: Entering directory `/home/shiv/Sysbench/sysbench'
make[2]: Nothing to be done for `install-exec-am'.
make[2]: Nothing to be done for `install-data-am'.
make[2]: Leaving directory `/home/shiv/Sysbench/sysbench'
make[1]: Leaving directory `/home/shiv/Sysbench/sysbench'
[root@localhost sysbench]#
Step 4 – Confirm successful installation of Sysbench 1.1
[root@localhost sysbench]# sysbench --version
sysbench 1.1.0-651e7fd
[root@localhost sysbench]#
How to use Sysbench for benchmarking ?
Benchmarking CPU
Benchmarking CPU with just 1 thread , we look for time elapsed value majorly (In this case it is 10.0457s)
[root@localhost sysbench]# sysbench --test=cpu --cpu-max-prime=300000 run

sysbench 1.1.0-651e7fd (using bundled LuaJIT 2.1.0-beta3)

Running the test with following options:
Number of threads: 1
Initializing random number generator from current time


Prime numbers limit: 300000

Initializing worker threads...

Threads started!

CPU speed:
    events per second:     9.85

Throughput:
    events/s (eps):                      9.8550
    time elapsed:                        10.0457s
    total number of events:              99

Latency (ms):
         min:                                   91.73
         avg:                                  101.46
         max:                                  179.27
         95th percentile:                      110.66
         sum:                                10044.86

Threads fairness:
    events (avg/stddev):           99.0000/0.00
    execution time (avg/stddev):   10.0449/0.00

[root@localhost sysbench]#
Benchmarking CPU with 60 threads (if you notice –test option is deprecated with Sysbench 1.1)
[root@localhost sysbench]# sysbench --test=cpu --cpu-max-prime=300000 --num-threads=60 run

sysbench 1.1.0-651e7fd (using bundled LuaJIT 2.1.0-beta3)

Running the test with following options:
Number of threads: 60
Initializing random number generator from current time


Prime numbers limit: 300000

Initializing worker threads...

Threads started!

CPU speed:
    events per second:     9.90

Throughput:
    events/s (eps):                      9.9047
    time elapsed:                        12.1155s
    total number of events:              120

Latency (ms):
         min:                                 4802.24
         avg:                                 5781.75
         max:                                 6633.59
         95th percentile:                     6360.91
         sum:                               693809.67

Threads fairness:
    events (avg/stddev):           2.0000/0.00
    execution time (avg/stddev):   11.5635/0.28

[root@localhost sysbench]#
Benchmarking RAM / Memory (both reads and writes)
[root@localhost sysbench]# sysbench --test=memory --memory-block-size=64K --memory-scope=global --memory-total-size=300G --memory-oper=read run

sysbench 1.1.0-651e7fd (using bundled LuaJIT 2.1.0-beta3)

Running the test with following options:
Number of threads: 1
Initializing random number generator from current time


Running memory speed test with the following options:
  block size: 64KiB
  total size: 307200MiB
  operation: read
  scope: global

Initializing worker threads...

Threads started!

Total operations: 3210450 (321043.11 per second)

200653.12 MiB transferred (20065.19 MiB/sec)


Throughput:
    events/s (eps):                      321043.1076
    time elapsed:                        10.0001s
    total number of events:              3210450

Latency (ms):
         min:                                    0.00
         avg:                                    0.00
         max:                                   22.43
         95th percentile:                        0.00
         sum:                                 9251.30

Threads fairness:
    events (avg/stddev):           3210450.0000/0.00
    execution time (avg/stddev):   9.2513/0.00
[root@localhost sysbench]# sysbench --test=memory --memory-block-size=64K --memory-scope=global --memory-total-size=300G --memory-oper=write run

sysbench 1.1.0-651e7fd (using bundled LuaJIT 2.1.0-beta3)

Running the test with following options:
Number of threads: 1
Initializing random number generator from current time


Running memory speed test with the following options:
  block size: 64KiB
  total size: 307200MiB
  operation: write
  scope: global

Initializing worker threads...

Threads started!

Total operations: 2378246 (237823.34 per second)

148640.38 MiB transferred (14863.96 MiB/sec)


Throughput:
    events/s (eps):                      237823.3394
    time elapsed:                        10.0001s
    total number of events:              2378246

Latency (ms):
         min:                                    0.00
         avg:                                    0.00
         max:                                    7.84
         95th percentile:                        0.00
         sum:                                 9485.47

Threads fairness:
    events (avg/stddev):           2378246.0000/0.00
    execution time (avg/stddev):   9.4855/0.00
Benchmarking Disk I/O
The following I/O operations can be benchmarked using Sysbench :
- Sequential write – seqwr
- Sequential rewrite – seqrewr
- Sequential read – seqrd
- Random read – rndrd
- Random write – rndwr
- Combined random read/write – rndrw
Examples
Step 1 – Create a file , define total number of threads and file test mode. In the example below, we have selected combined random read/write (rndrw)
[root@localhost sysbench]# sysbench --num-threads=16 --test=fileio --file-total-size=2G --file-test-mode=rndrw prepare

sysbench 1.1.0-651e7fd (using bundled LuaJIT 2.1.0-beta3)

128 files, 16384Kb each, 2048Mb total
Creating files for the test...
Extra file open flags: (none)
Creating file test_file.0
Creating file test_file.1
Creating file test_file.2
Creating file test_file.3
Creating file test_file.4
Creating file test_file.5
Creating file test_file.6
Creating file test_file.7
Creating file test_file.8
Creating file test_file.9
Creating file test_file.10
Creating file test_file.11
Creating file test_file.12
Creating file test_file.13
Creating file test_file.14
Creating file test_file.15
.........
............
Creating file test_file.125
Creating file test_file.126
Creating file test_file.127
2147483648 bytes written in 3.21 seconds (637.65 MiB/sec).
Step 2 – Run benchmarking test on file created above
[root@localhost sysbench]# sysbench --num-threads=16 --test=fileio --file-total-size=2G --file-test-mode=rndrw run

sysbench 1.1.0-651e7fd (using bundled LuaJIT 2.1.0-beta3)

128 files, 16MiB each
2GiB total file size
Block size 16KiB
Number of IO requests: 0
Read/Write ratio for combined random IO test: 1.50
Periodic FSYNC enabled, calling fsync() each 100 requests.
Calling fsync() at the end of test, Enabled.
Using synchronous I/O mode
Doing random r/w test
Initializing worker threads...

Threads started!


Throughput:
         read:  IOPS=2111.56 32.99 MiB/s (34.60 MB/s)
         write: IOPS=1407.37 21.99 MiB/s (23.06 MB/s)
         fsync: IOPS=4500.34

Latency (ms):
         min:                                  0.00
         avg:                                  1.99
         max:                                621.12
         95th percentile:                      4.10
         sum:                             159899.55
Step 3 – Remove the files once completed benchmarking
[root@localhost sysbench]# sysbench --num-threads=16 --test=fileio --file-total-size=2G --file-test-mode=rndrw cleanup

sysbench 1.1.0-651e7fd (using bundled LuaJIT 2.1.0-beta3)

Removing test files...
Benchmarking MySQL using custom Lua scripts available with installation of Sysbench 1.1 (/usr/local/share/sysbench)
We have custom Lua scripts available with Sysbench 1.1 for benchmarking MySQL (I have listed them below)
[root@localhost sysbench]# ls
bulk_insert.lua  oltp_delete.lua  oltp_point_select.lua  oltp_read_write.lua    oltp_update_non_index.lua  select_random_points.lua  tests
oltp_common.lua  oltp_insert.lua  oltp_read_only.lua     oltp_update_index.lua  oltp_write_only.lua        select_random_ranges.lua
Step 1 – create a MySQL database for running the benchmarking tests
mysql> create database sysbench;
Query OK, 1 row affected (0.00 sec)
We have chosen “select_random_points.lua” script for benchmarking MySQL 5.7(default setting) in the example below :
Step 2 – Prepare sbtest1 table in sysbench database create above with 2M records
[root@localhost sysbench]# sysbench select_random_points.lua --table-size=2000000 --num-threads=1 --rand-type=uniform --db-driver=mysql --mysql-db=sysbench --mysql-user=root --mysql-password=SriLanka/2018 prepare
sysbench 1.1.0-651e7fd (using bundled LuaJIT 2.1.0-beta3)

Creating table 'sbtest1'...
Inserting 2000000 records into 'sbtest1'
Creating a secondary index on 'sbtest1'...
[root@localhost sysbench]#
mysql> show table status like 'sbtest%' \G;
*************************** 1. row ***************************
           Name: sbtest1
         Engine: InnoDB
        Version: 10
     Row_format: Dynamic
           Rows: 1921969
 Avg_row_length: 233
    Data_length: 449724416
Max_data_length: 0
   Index_length: 0
      Data_free: 5242880
 Auto_increment: 2000001
    Create_time: 2018-03-12 23:32:13
    Update_time: 2018-03-12 23:32:07
     Check_time: NULL
      Collation: latin1_swedish_ci
       Checksum: NULL
 Create_options:
        Comment:
1 row in set (0.00 sec)

ERROR:
No query specified
Step 3 – Run the benchmark test using select_random_ponts.lua script , We have selected 100 threads for this test :
[root@localhost sysbench]# sysbench select_random_points.lua --table-size=2000000 --num-threads=100 --rand-type=uniform --db-driver=mysql --mysql-db=sysbench --mysql-user=root --mysql-password=SriLanka/2018 run

sysbench 1.1.0-651e7fd (using bundled LuaJIT 2.1.0-beta3)

Running the test with following options:
Number of threads: 100
Initializing random number generator from current time


Initializing worker threads...

Threads started!

SQL statistics:
    queries performed:
        read:                            28214
        write:                           0
        other:                           0
        total:                           28214
    transactions:                        28214  (2799.30 per sec.)
    queries:                             28214  (2799.30 per sec.)
    ignored errors:                      0      (0.00 per sec.)
    reconnects:                          0      (0.00 per sec.)

Throughput:
    events/s (eps):                      2799.2957
    time elapsed:                        10.0790s
    total number of events:              28214

Latency (ms):
         min:                                    0.15
         avg:                                   35.50
         max:                                 1727.81
         95th percentile:                       77.19
         sum:                              1001542.39

Threads fairness:
    events (avg/stddev):           282.1400/13.24
    execution time (avg/stddev):   10.0154/0.02
In the above report, time elapsed (at MinervaDB we measure performance by response time ) is most important matrix for me, Though we consider transactions / queries per second equally to measure the load in the system
Step 4 – Please don’t not forget to cleanup MySQL database created (sysbench in this example)
[root@localhost sysbench]# sysbench select_random_points.lua --table-size=2000000 --num-threads=100 --rand-type=uniform --db-driver=mysql --mysql-db=sysbench --mysql-user=root --mysql-password=SriLanka/2018 cleanup
sysbench 1.1.0-651e7fd (using bundled LuaJIT 2.1.0-beta3)

Dropping table 'sbtest1'...
[root@localhost sysbench]#
Conclusion
The only intention of this blog is to help you learn how to install Sysbench 1.1 and benchmark MySQL, We have not tweaked MySQL for performance and the data collected with this exercise is not for publishing MySQL 5.7 performance benchmarking results.
The post Benchmarking MySQL 5.7 using Sysbench 1.1 appeared first on The WebScale Database Infrastructure Operations Experts.
]]>