The post Benchmarking MySQL 8.0 Performance on Amazon EC2 appeared first on The WebScale Database Infrastructure Operations Experts.
]]>The scope of performance benchmarking
The core objective of this benchmarking exercise is to measure MySQL 8.0 performance, This include INSERTs , SELECTs and complex transaction processing (both INSERTs and SELECTs) without any tuning of MySQL 8 instance’s my.cnf. We agree tuning my.cnf will greatly improve performance but in this activity we wanted to benchmark MySQL 8 transaction processing capabilities and technically in MinervaDB we measure performance by Response Time and believe you can build high performance MySQL applications by writing optimal SQL. We have used Sysbench (https://github.com/MinervaDB/MinervaDB-Sysbench release 1.0.20) for this benchmarking activity. This is not a paid / sponsored benchmarking effort by any of the software or hardware vendors, We will remain forever an vendor neutral and independent web-scale database infrastructure operations company with core expertise in performance, scalability, high availability and database reliability engineering. You can download detailed copy of this benchmarking here
Note: This MySQL 8.0 performance benchmarking paper is published by MinervaDB Performance Engineering Team, You are free to copy the entire content for research and publishing without copyrighting the content. This document is distributed in the hope that it will be useful but WITHOUT ANY WARRANTY; without even the implied warranty of MERCHANTABILITY or FITNESS FOR A PARTICULAR PURPOSE.
☛ A low cost and instant gratification health check-up for your MySQL infrastructure operations from MinervaDB
- Highly responsive and proactive MySQL performance health check-up, diagnostics and forensics.
- Detailed report on your MySQL configuration, expensive SQL, index operations, performance, scalability and reliability.
- Recommendations for building an optimal, scalable, highly available and reliable MySQL infrastructure operations.
- Per MySQL instance performance audit, detailed report and recommendations.
- Security Audit – Detailed Database Security Audit Report which includes the results of the audit and an actionable Compliance and Security Plan for fixing vulnerabilities and ensuring the ongoing security of your data.
** You are paying us only for the MySQL instance we have worked for :
| MySQL Health Check-up | Rate ( plus GST / Goods and Services Tax where relevant ) |
|---|---|
| MySQL infrastructure operations detailed health check-up, diagnostics report and recommendations | US $7,500 / MySQL instance |
☛ MinervaDB contacts – Sales & General Inquiries
| Business Function | Contact |
|---|---|
 CONTACT GLOBAL SALES (24*7) CONTACT GLOBAL SALES (24*7) |  (844) 588-7287 (USA) (415) 212-6625 (USA) (778) 770-5251 (Canada) (844) 588-7287 (USA) (415) 212-6625 (USA) (778) 770-5251 (Canada) |
| TOLL FREE PHONE (24*7) | (844) 588-7287 |
 MINERVADB FAX MINERVADB FAX | +1 (209) 314-2364 |
 MinervaDB Email - General / Sales / Consulting MinervaDB Email - General / Sales / Consulting | contact@minervadb.com |
| MinervaDB Email - Support | support@minervadb.com |
| MinervaDB Email -Remote DBA | remotedba@minervadb.com |
| Shiv Iyer Email - Founder and Principal | shiv@minervadb.com |
 CORPORATE ADDRESS: CALIFORNIA CORPORATE ADDRESS: CALIFORNIA | MinervaDB Inc., 340 S LEMON AVE #9718 WALNUT 91789 CA, US |
| CORPORATE ADDRESS: DELAWARE | MinervaDB Inc., PO Box 2093 PHILADELPHIA PIKE #3339 CLAYMONT, DE 19703 |
| CORPORATE ADDRESS: HOUSTON | MinervaDB Inc., 1321 Upland Dr. PMB 19322, Houston, TX 77043, US |
The post Benchmarking MySQL 8.0 Performance on Amazon EC2 appeared first on The WebScale Database Infrastructure Operations Experts.
]]>The post Auditing MariaDB for Secured Database Infrastructure Operations appeared first on The WebScale Database Infrastructure Operations Experts.
]]>MariaDB Audit Plugin installation
The MariaDB Audit Plugin is provided as a dynamic library: server_audit.so (server_audit.dll for Windows). The file path of the plugin library is stored in the plugin_dir system variable:
MariaDB [(none)]> select @@plugin_dir;
+--------------------------+
| @@plugin_dir             |
+--------------------------+
| /usr/lib64/mysql/plugin/ |
+--------------------------+
1 row in set (0.000 sec)
One way to install this plug-in is to execute the INSTALL SONAME statement while logged into MariaDB. You must use an administrative account with INSERT privilege for the mysql.plugin table:
MariaDB [(none)]> INSTALL SONAME 'server_audit';
Loading Plugin at Start-Up
You can also load the plugin from the command-line as a startup parameter by configuring my.cnf or my.ini in /etc/my.cnf or /etc/mysql/my.cnf , We have copied below the configuration of my.cnf for enabling MariaDB Audit Plugin (please add these variables after [mysqld] or [mariadb] ):
plugin_load=server_audit=server_audit.so

server_audit_events=CONNECT,QUERY,TABLE

server_audit_logging=ON

server_audit=FORCE_PLUS_PERMANENT
We don’t want somebody uninstall MariaDB Audit Plugin so enabled system variable, server_audit=FORCE_PLUS_PERMANENT , The example below explains this scenario much better:
MariaDB [(none)]> UNINSTALL PLUGIN server_audit;
ERROR 1702 (HY000): Plugin 'server_audit' is force_plus_permanent and can not be unloaded
To see the list of audit plugin-related variables in your MariaDB server, execute the command below:
MariaDB [(none)]> SHOW GLOBAL VARIABLES LIKE 'server_audit%';
+-------------------------------+-----------------------+
| Variable_name                 | Value                 |
+-------------------------------+-----------------------+
| server_audit_events           | CONNECT,QUERY,TABLE   |
| server_audit_excl_users       |                       |
| server_audit_file_path        | server_audit.log      |
| server_audit_file_rotate_now  | OFF                   |
| server_audit_file_rotate_size | 1000000               |
| server_audit_file_rotations   | 9                     |
| server_audit_incl_users       |                       |
| server_audit_logging          | ON                    |
| server_audit_mode             | 0                     |
| server_audit_output_type      | file                  |
| server_audit_query_log_limit  | 1024                  |
| server_audit_syslog_facility  | LOG_USER              |
| server_audit_syslog_ident     | mysql-server_auditing |
| server_audit_syslog_info      |                       |
| server_audit_syslog_priority  | LOG_INFO              |
+-------------------------------+-----------------------+
15 rows in set (0.002 sec)
Uncontrolled MariaDB Audit Plugins are major concerns in any MariaDB database infrastructure operations, I strongly recommend our customers to consider log rotate “server_audit.log” file, You can force a rotation by enabling the server_audit_file_rotate_now :
MariaDB [(none)]> SET GLOBAL server_audit_file_rotate_now = ON;
Query OK, 0 rows affected (0.015 sec)
You can configure the size limit of MariaDB Audit Plugin by setting variable, server_audit_file_rotate_size . To limit the number of log files created, set the variable, server_audit_file_rotations. To force log file rotations you can set the variable, server_audit_file_rotate_now to ON:
[mariadb]
..
server_audit_file_rotate_now=ON
server_audit_file_rotate_size=1000000
server_audit_file_rotations=10
...
MariaDB Audit Plugin report:
[root@localhost mysql]# tail -f server_audit.log
20180720 20:39:22,localhost.localdomain,root,localhost,13,1501,QUERY,,'SELECT DATABASE()',0
20180720 20:39:22,localhost.localdomain,root,localhost,13,1503,QUERY,sakila,'show databases',0
20180720 20:39:22,localhost.localdomain,root,localhost,13,1504,QUERY,sakila,'show tables',0
20180720 20:39:27,localhost.localdomain,root,localhost,13,1528,QUERY,sakila,'show tables',0
20180720 20:39:43,localhost.localdomain,root,localhost,13,1529,READ,sakila,customer,
20180720 20:39:43,localhost.localdomain,root,localhost,13,1529,QUERY,sakila,'select * from customer limit 100',0
20180720 20:39:52,localhost.localdomain,root,localhost,13,1530,QUERY,sakila,'show tables',0
20180720 20:40:07,localhost.localdomain,root,localhost,13,1531,READ,sakila,actor,
20180720 20:40:07,localhost.localdomain,root,localhost,13,1531,QUERY,sakila,'select * from actor limit 100',0
20180720 20:40:30,localhost.localdomain,root,localhost,13,0,DISCONNECT,sakila,,0
Conclusion
We recommend most of our customers (using MariaDB) to enable MariaDB Audit Plugin to closely monitor what is happening to their database infrastructure, This really helps to proactively troubleshoot if anything going wrong with their MariaDB operations. Reliable and secured database operations is equally important like performance and scalability.
The post Auditing MariaDB for Secured Database Infrastructure Operations appeared first on The WebScale Database Infrastructure Operations Experts.
]]>The post A friendly comparison of InnoDB and MyRocks Performance appeared first on The WebScale Database Infrastructure Operations Experts.
]]>How InnoDB and MyRocks are different ?
- MyRocks supports only READ-COMMITTED isolation level, There is no REPEATABLE-READ isolation level like InnoDB so no gap locking like InnoDB, We have written detailed blog on InnoDB transaction isolation levels here
- To get an verbose information about MyRocks instance, the log is located in ” /var/lib/mysql/#rocksdb ” . Much more detailed story about your RocksDB diagnostics report can be generated with the command SHOW ENGINE ROCKSDB STATUS , It really takes good amount of time to understand and interpret MyRocks operations matrices.
- In MyRocks, you have rocksdb_block_cache_size system variable which is somewhat similar to innodb_buffer_pool_size but It’s mainly beneficial for reads. By default it uses buffered reads and OS cache contains cached compressed data and RockDB block cache will contain uncompressed data. You can have two levels of cache or disable buffering by forcing block cache to use direct reads with configuration rocksdb_use_direct_reads=ON.
- LSM Data Structure – MyRocks is not an alternative or advanced version of InnoDB, LSM data structure is great for write-intensive database operations, reads will be slow and full table scans are too expensive. so InnoDB and RocksDB together makes an great combination !
Benchmarking InnoDB and MyRocks performance with sysbench 1.0.14 for OLTP operations
Linux – CentOS Linux release 7.3.1611 (Core)
Database infrastructure – MariaDB 10.3.7
Building database infrastructure for benchmarking
We have used “oltp_common.lua” script to create database infrastructure for benchmarking InnoDB and MyRocks, We have not tuned both InnoDB and MyRocks variables for performance. The script below creates database for benchmarking:
[root@localhost sysbench]#
[root@localhost sysbench]# sysbench bulk_insert.lua  --threads=1 --db-driver=mysql --mysql-db=test --mysql-socket=/var/lib/mysql/mysql.sock --mysql-user=root --mysql-password=MyPassword2018  --mysql-storage-engine=rocksdb prepare
sysbench 1.0.14 (using bundled LuaJIT 2.1.0-beta2)

Creating table 'sbtest1'...
[root@localhost sysbench]#
Benchmarking bulk INSERT performance on InnoDB and MyRocks
Benchmarking OLTP insert on InnoDB using “oltp_insert.lua”
Script to create data (5M records) for benchmarking OLTP INSERT performance:
[root@localhost sysbench]# sysbench oltp_insert.lua --threads=100 --time=180 --table-size=5000000  --db-driver=mysql --mysql-db=test --mysql-socket=/var/lib/mysql/mysql.sock --mysql-user=root --mysql-password=MyPassword2018 prepare
sysbench 1.0.14 (using bundled LuaJIT 2.1.0-beta2)

Initializing worker threads...

Creating table 'sbtest1'...
Inserting 5000000 records into 'sbtest1'
Creating a secondary index on 'sbtest1'...
[root@localhost sysbench]#
MariaDB [test]> show table status like 'sbtest1'\G;
*************************** 1. row ***************************
            Name: sbtest1
          Engine: InnoDB
         Version: 10
      Row_format: Dynamic
            Rows: 5404891
  Avg_row_length: 265
     Data_length: 1433403392
 Max_data_length: 0
    Index_length: 157024256
       Data_free: 4194304
  Auto_increment: 5696281
     Create_time: 2018-06-03 12:48:12
     Update_time: 2018-06-03 12:52:03
      Check_time: NULL
       Collation: latin1_swedish_ci
        Checksum: NULL
  Create_options:
         Comment:
Max_index_length: 0
       Temporary: N
1 row in set (0.000 sec)

ERROR: No query specified

MariaDB [test]>
Script for benchmarking InnoDB OLTP INSERT performance:
[root@localhost sysbench]# sysbench oltp_insert.lua --threads=100 --time=180 --table-size=5000000  --db-driver=mysql --mysql-db=test --mysql-socket=/var/lib/mysql/mysql.sock --mysql-user=root --mysql-password=MyPassword2018 run
sysbench 1.0.14 (using bundled LuaJIT 2.1.0-beta2)

Running the test with following options:
Number of threads: 100
Initializing random number generator from current time


Initializing worker threads...

Threads started!

SQL statistics:
    queries performed:
        read:                            0
        write:                           696280
        other:                           0
        total:                           696280
    transactions:                        696280 (3866.32 per sec.)
    queries:                             696280 (3866.32 per sec.)
    ignored errors:                      0      (0.00 per sec.)
    reconnects:                          0      (0.00 per sec.)

General statistics:
    total time:                          180.0872s
    total number of events:              696280

Latency (ms):
         min:                                    0.62
         avg:                                   25.85
         max:                                  358.63
         95th percentile:                       81.48
         sum:                             17998504.11

Threads fairness:
    events (avg/stddev):           6962.8000/57.61
    execution time (avg/stddev):   179.9850/0.04
What we look for seriously in this benchmarking is QPS (queries per seconds) , In the test above it is 3866 QPS
Benchmarking MyRocks INSERT performance using Sysbench 1.0.14:
The steps are same, except for explicitly mentioning the storage engine RocksDB in sysbench scripts: “–mysql-storage-engine=rocksdb”
Script for benchmarking OLTP insert on MyRocks using “oltp_insert.lua” :
[root@localhost sysbench]# sysbench oltp_insert.lua --threads=100 --time=180 --table-size=5000000  --db-driver=mysql --mysql-db=test --mysql-socket=/var/lib/mysql/mysql.sock --mysql-user=root --mysql-password=MyPassword2018 --mysql-storage-engine=rocksdb prepare
sysbench 1.0.14 (using bundled LuaJIT 2.1.0-beta2)

Initializing worker threads...

Creating table 'sbtest1'...
Inserting 5000000 records into 'sbtest1'
Creating a secondary index on 'sbtest1'...
[root@localhost sysbench]#
MariaDB [test]> show table status like 'sbtest1%'\G;
*************************** 1. row ***************************
            Name: sbtest1
          Engine: ROCKSDB
         Version: 10
      Row_format: Fixed
            Rows: 5000000
  Avg_row_length: 198
     Data_length: 992949774
 Max_data_length: 0
    Index_length: 38739880
       Data_free: 0
  Auto_increment: 5000001
     Create_time: NULL
     Update_time: NULL
      Check_time: NULL
       Collation: latin1_swedish_ci
        Checksum: NULL
  Create_options:
         Comment:
Max_index_length: 0
       Temporary: N
1 row in set (0.007 sec)

ERROR: No query specified

MariaDB [test]>
Script for benchmarking RocksDB OLTP INSERT performance:
[root@localhost sysbench]# sysbench oltp_insert.lua --threads=100 --time=180 --table-size=5000000  --db-driver=mysql --mysql-db=test --mysql-socket=/var/lib/mysql/mysql.sock --mysql-user=root --mysql-password=MyPassword2018 --mysql-storage-engine=rocksdb run
sysbench 1.0.14 (using bundled LuaJIT 2.1.0-beta2)

Running the test with following options:
Number of threads: 100
Initializing random number generator from current time


Initializing worker threads...

Threads started!

SQL statistics:
    queries performed:
        read:                            0
        write:                           123049
        other:                           0
        total:                           123049
    transactions:                        123049 (683.37 per sec.)
    queries:                             123049 (683.37 per sec.)
    ignored errors:                      0      (0.00 per sec.)
    reconnects:                          0      (0.00 per sec.)

General statistics:
    total time:                          180.0618s
    total number of events:              123049

Latency (ms):
         min:                                    1.03
         avg:                                  146.30
         max:                                 1675.09
         95th percentile:                      308.84
         sum:                             18001689.44

Threads fairness:
    events (avg/stddev):           1230.4900/26.26
    execution time (avg/stddev):   180.0169/0.02

[root@localhost sysbench]#
Result: OLTP INSERT performance for RocksDB is 683 QPS (queries per second)
The graphical representation of more interesting performance benchmarking results on multiple bulk INSERT transactions scenarios:
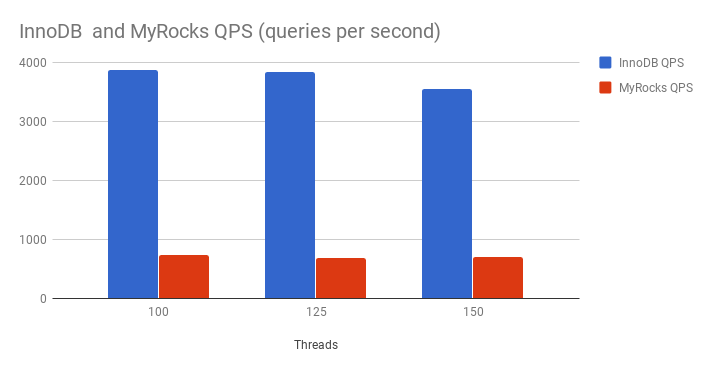
Conclusion
OLTP INSERT performance benchmarking clearly proves InnoDB is almost 6X faster than MyRocks. So MyRocks is not recommended for bulk INSERT transactions !
OLTP WRITE only transactions performance benchmarking for InnoDB and MyRocks
OLTP WRITE only performance benchmarking for InnoDB using “oltp_write_only.lua”
The steps remains same for “oltp_write_only.lua” script like “oltp_insert.lua” mentioned above, So we are directly copying the results of benchmarking without explaining details again:
[root@localhost sysbench]# sysbench oltp_write_only.lua  --threads=100  --table-size=5000000  --db-driver=mysql --mysql-db=test --mysql-socket=/var/lib/mysql/mysql.sock --mysql-user=root --mysql-password=MyPassword2018 prepare
sysbench 1.0.14 (using bundled LuaJIT 2.1.0-beta2)

Initializing worker threads...

Creating table 'sbtest1'...
Inserting 5000000 records into 'sbtest1'
Creating a secondary index on 'sbtest1'...
[root@localhost sysbench]# sysbench oltp_write_only.lua  --threads=100  --table-size=5000000  --db-driver=mysql --mysql-db=test --mysql-socket=/var/lib/mysql/mysql.sock --mysql-user=root --mysql-password=MyPassword2018 run
sysbench 1.0.14 (using bundled LuaJIT 2.1.0-beta2)

Running the test with following options:
Number of threads: 100
Initializing random number generator from current time


Initializing worker threads...

Threads started!

SQL statistics:
    queries performed:
        read:                            0
        write:                           14529
        other:                           7265
        total:                           21794
    transactions:                        3632   (355.03 per sec.)
    queries:                             21794  (2130.37 per sec.)
    ignored errors:                      1      (0.10 per sec.)
    reconnects:                          0      (0.00 per sec.)

General statistics:
    total time:                          10.2285s
    total number of events:              3632

Latency (ms):
         min:                                    1.88
         avg:                                  277.61
         max:                                 2701.56
         95th percentile:                      977.74
         sum:                              1008267.12

Threads fairness:
    events (avg/stddev):           36.3200/4.36
    execution time (avg/stddev):   10.0827/0.09
Result : 2130 QPS (queries per second)
OLTP WRITE only performance benchmarking for RocksDB using “oltp_write_only.lua”
[root@localhost sysbench]# sysbench oltp_write_only.lua  --threads=100  --table-size=5000000  --db-driver=mysql --mysql-db=test --mysql-socket=/var/lib/mysql/mysql.sock --mysql-user=root --mysql-password=MyPassword2018 --mysql-storage-engine=rocksdb prepare
sysbench 1.0.14 (using bundled LuaJIT 2.1.0-beta2)

Initializing worker threads...

Creating table 'sbtest1'...
Inserting 5000000 records into 'sbtest1'
Creating a secondary index on 'sbtest1'...
[root@localhost sysbench]# sysbench oltp_write_only.lua  --threads=100  --table-size=5000000  --db-driver=mysql --mysql-db=test --mysql-socket=/var/lib/mysql/mysql.sock --mysql-user=root --mysql-password=MyPassword2018 --mysql-storage-engine=rocksdb run
sysbench 1.0.14 (using bundled LuaJIT 2.1.0-beta2)

Running the test with following options:
Number of threads: 100
Initializing random number generator from current time


Initializing worker threads...

Threads started!

SQL statistics:
    queries performed:
        read:                            0
        write:                           25191
        other:                           12596
        total:                           37787
    transactions:                        6296   (625.73 per sec.)
    queries:                             37787  (3755.49 per sec.)
    ignored errors:                      4      (0.40 per sec.)
    reconnects:                          0      (0.00 per sec.)

General statistics:
    total time:                          10.0603s
    total number of events:              6296

Latency (ms):
         min:                                    1.39
         avg:                                  159.29
         max:                                 3620.58
         95th percentile:                      846.57
         sum:                              1002895.84

Threads fairness:
    events (avg/stddev):           62.9600/25.26
    execution time (avg/stddev):   10.0290/0.02
Result : 3755 QPS (queries per second)
The graphical representation of more interesting performance benchmarking results on multiple WRITE only transactions scenarios:
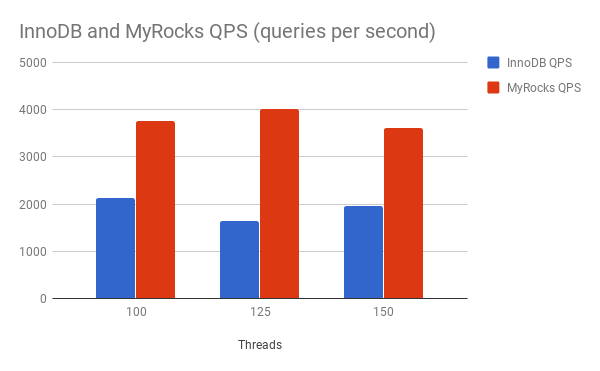
Conclusion
MyRocks OLTP write only performance is almost 2X compared to InnoDB, So MyRocks is definitely an preferred option for high performance and scalable writes, Thanks to LSM data structure !
OLTP READ-WRITE performance benchmarking using Sysbench lua script “oltp_read_write.lua”
The lua scripts below create data for OLTP READ-WRITE performance benchmarking:
Benchmarking OLTP READ-WRITE performance for InnoDB:
[root@localhost sysbench]# sysbench oltp_read_write.lua  --threads=100  --table-size=5000000  --db-driver=mysql --mysql-db=test --mysql-socket=/var/lib/mysql/mysql.sock --mysql-user=root --mysql-password=MyPassword2018 prepare
sysbench 1.0.14 (using bundled LuaJIT 2.1.0-beta2)

Initializing worker threads...

Creating table 'sbtest1'...
Inserting 5000000 records into 'sbtest1'
Creating a secondary index on 'sbtest1'...
[root@localhost sysbench]# sysbench oltp_read_write.lua  --threads=100  --table-size=5000000  --db-driver=mysql --mysql-db=test --mysql-socket=/var/lib/mysql/mysql.sock --mysql-user=root --mysql-password=MyPassword2018 run
sysbench 1.0.14 (using bundled LuaJIT 2.1.0-beta2)

Running the test with following options:
Number of threads: 100
Initializing random number generator from current time


Initializing worker threads...

Threads started!

SQL statistics:
    queries performed:
        read:                            15652
        write:                           4472
        other:                           2236
        total:                           22360
    transactions:                        1118   (105.96 per sec.)
    queries:                             22360  (2119.20 per sec.)
    ignored errors:                      0      (0.00 per sec.)
    reconnects:                          0      (0.00 per sec.)

General statistics:
    total time:                          10.5301s
    total number of events:              1118

Latency (ms):
         min:                                   15.71
         avg:                                  922.19
         max:                                 4973.09
         95th percentile:                     2009.23
         sum:                              1031006.57

Threads fairness:
    events (avg/stddev):           11.1800/1.68
    execution time (avg/stddev):   10.3101/0.13

[root@localhost sysbench]#
Result: 2119 QPS (queries per second)
Benchmarking OLTP READ-WRITE performance for RocksDB:
[root@localhost sysbench]# sysbench oltp_read_write.lua  --threads=100  --table-size=5000000  --db-driver=mysql --mysql-db=test --mysql-socket=/var/lib/mysql/mysql.sock --mysql-user=root --mysql-password=MyPassword2018 --mysql-storage-engine=rocksdb prepare
sysbench 1.0.14 (using bundled LuaJIT 2.1.0-beta2)

Initializing worker threads...

Creating table 'sbtest1'...
Inserting 5000000 records into 'sbtest1'
Creating a secondary index on 'sbtest1'...
[root@localhost sysbench]# sysbench oltp_read_write.lua  --threads=100  --table-size=5000000  --db-driver=mysql --mysql-db=test --mysql-socket=/var/lib/mysql/mysql.sock --mysql-user=root --mysql-password=MyPassword2018 --mysql-storage-engine=rocksdb run
sysbench 1.0.14 (using bundled LuaJIT 2.1.0-beta2)

Running the test with following options:
Number of threads: 100
Initializing random number generator from current time


Initializing worker threads...

Threads started!

SQL statistics:
    queries performed:
        read:                            26964
        write:                           7628
        other:                           3827
        total:                           38419
    transactions:                        1901   (182.46 per sec.)
    queries:                             38419  (3687.46 per sec.)
    ignored errors:                      25     (2.40 per sec.)
    reconnects:                          0      (0.00 per sec.)

General statistics:
    total time:                          10.4153s
    total number of events:              1901

Latency (ms):
         min:                                   11.23
         avg:                                  540.87
         max:                                 3480.91
         95th percentile:                     1352.03
         sum:                              1028196.02

Threads fairness:
    events (avg/stddev):           19.0100/2.25
    execution time (avg/stddev):   10.2820/0.10

[root@localhost sysbench]#
Result: 3687 QPS (queries per second)
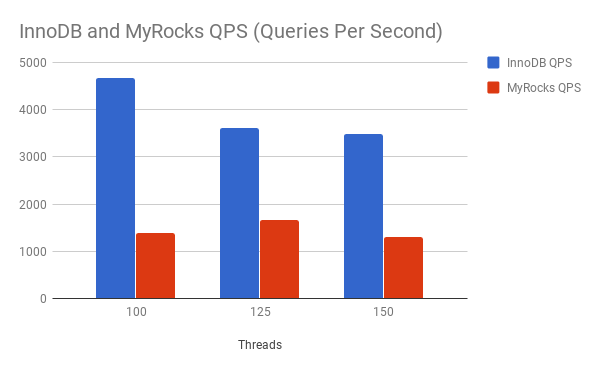
The graphical representation of more interesting performance benchmarking results on multiple READ-WRITE transactions scenarios:
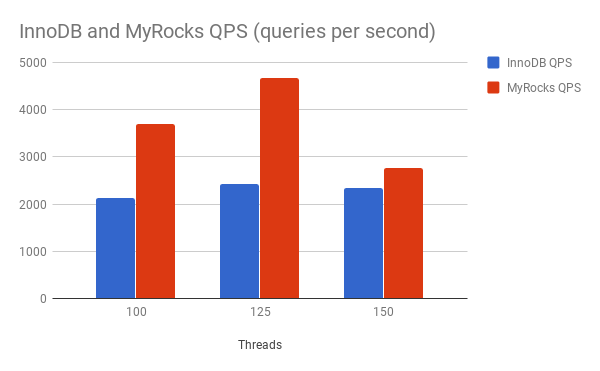
Conclusion
OLTP READ-WRITE I/O operations benchmarking results confirm MyRocks is the definite choice, May be these result vary more if we invest in tuning the InnoDB and MyRocks for performance.
Benchmarking OLTP READ ONLY operations using Sysbench oltp_read_only.lua script
OLTP READ ONLY transactions performance benchmarking for InnoDB:
[root@localhost sysbench]# sysbench oltp_read_only.lua  --threads=100  --table-size=5000000  --db-driver=mysql --mysql-db=test --mysql-socket=/var/lib/mysql/mysql.sock --mysql-user=root --mysql-password=MyPassword2018  prepare
sysbench 1.0.14 (using bundled LuaJIT 2.1.0-beta2)

Initializing worker threads...

Creating table 'sbtest1'...
Inserting 5000000 records into 'sbtest1'
Creating a secondary index on 'sbtest1'...
[root@localhost sysbench]# sysbench oltp_read_only.lua  --threads=100  --table-size=5000000  --db-driver=mysql --mysql-db=test --mysql-socket=/var/lib/mysql/mysql.sock --mysql-user=root --mysql-password=MyPassword2018  run
sysbench 1.0.14 (using bundled LuaJIT 2.1.0-beta2)

Running the test with following options:
Number of threads: 100
Initializing random number generator from current time


Initializing worker threads...

Threads started!

SQL statistics:
    queries performed:
        read:                            51072
        write:                           0
        other:                           7296
        total:                           58368
    transactions:                        3648   (352.59 per sec.)
    queries:                             58368  (5641.45 per sec.)
    ignored errors:                      0      (0.00 per sec.)
    reconnects:                          0      (0.00 per sec.)

General statistics:
    total time:                          10.3436s
    total number of events:              3648

Latency (ms):
         min:                                    1.10
         avg:                                  274.41
         max:                                 2863.46
         95th percentile:                      733.00
         sum:                              1001047.53

Threads fairness:
    events (avg/stddev):           36.4800/6.57
    execution time (avg/stddev):   10.0105/0.05
Result: 5641 QPS (queries per second)
OLTP READ ONLY transactions performance benchmarking for RocksDB:
[root@localhost sysbench]# sysbench oltp_read_only.lua  --threads=100  --table-size=5000000  --db-driver=mysql --mysql-db=test --mysql-socket=/var/lib/mysql/mysql.sock --mysql-user=root --mysql-password=MyPassword2018 --mysql-storage-engine=rocksdb prepare
sysbench 1.0.14 (using bundled LuaJIT 2.1.0-beta2)

Initializing worker threads...

Creating table 'sbtest1'...
Inserting 5000000 records into 'sbtest1'
Creating a secondary index on 'sbtest1'...
[root@localhost sysbench]# sysbench oltp_read_only.lua  --threads=100  --table-size=5000000  --db-driver=mysql --mysql-db=test --mysql-socket=/var/lib/mysql/mysql.sock --mysql-user=root --mysql-password=MyPassword2018 --mysql-storage-engine=rocksdb run
sysbench 1.0.14 (using bundled LuaJIT 2.1.0-beta2)

Running the test with following options:
Number of threads: 100
Initializing random number generator from current time


Initializing worker threads...

Threads started!

SQL statistics:
    queries performed:
        read:                            26362
        write:                           0
        other:                           3766
        total:                           30128
    transactions:                        1883   (182.77 per sec.)
    queries:                             30128  (2924.32 per sec.)
    ignored errors:                      0      (0.00 per sec.)
    reconnects:                          0      (0.00 per sec.)

General statistics:
    total time:                          10.2983s
    total number of events:              1883

Latency (ms):
         min:                                    6.20
         avg:                                  540.16
         max:                                 5258.04
         95th percentile:                     2045.74
         sum:                              1017118.10

Threads fairness:
    events (avg/stddev):           18.8300/2.29
    execution time (avg/stddev):   10.1712/0.08
Result: 2924 QPS (queries per second)
The graphical representation of more interesting performance benchmarking results on multiple READ only transactions scenarios:
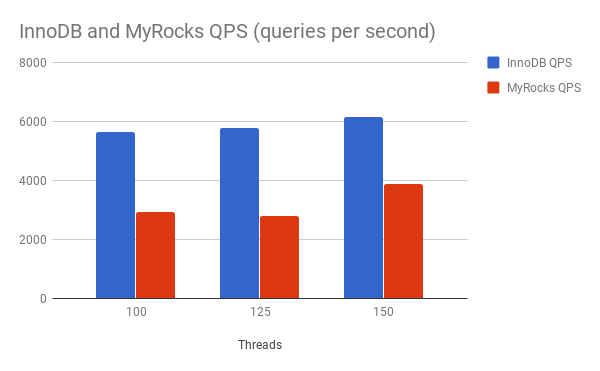
Conclusion
InnoDB works great if it is OLTP READ only transactions, So we can continue recommending customers to use InnoDB for read intensive database operations.
Benchmarking OLTP DELETE ONLY operations using Sysbench oltp_delete.lua script
OLTP DELETE ONLY transactions performance benchmarking for InnoDB:
[root@localhost sysbench]# sysbench oltp_delete.lua  --threads=100  --table-size=5000000  --db-driver=mysql --mysql-db=test --mysql-socket=/var/lib/mysql/mysql.sock --mysql-user=root --mysql-password=MyPassword2018 prepare
sysbench 1.0.14 (using bundled LuaJIT 2.1.0-beta2)

Initializing worker threads...

Creating table 'sbtest1'...
Inserting 5000000 records into 'sbtest1'
Creating a secondary index on 'sbtest1'...
[root@localhost sysbench]# sysbench oltp_delete.lua  --threads=100  --table-size=5000000  --db-driver=mysql --mysql-db=test --mysql-socket=/var/lib/mysql/mysql.sock --mysql-user=root --mysql-password=MyPassword2018 run
sysbench 1.0.14 (using bundled LuaJIT 2.1.0-beta2)

Running the test with following options:
Number of threads: 100
Initializing random number generator from current time


Initializing worker threads...

Threads started!

SQL statistics:
    queries performed:
        read:                            0
        write:                           21659
        other:                           4464
        total:                           26123
    transactions:                        26123  (2521.93 per sec.)
    queries:                             26123  (2521.93 per sec.)
    ignored errors:                      0      (0.00 per sec.)
    reconnects:                          0      (0.00 per sec.)

General statistics:
    total time:                          10.3568s
    total number of events:              26123

Latency (ms):
         min:                                    0.04
         avg:                                   38.08
         max:                                 2679.06
         95th percentile:                      116.80
         sum:                               994654.43

Threads fairness:
    events (avg/stddev):           261.2300/46.27
    execution time (avg/stddev):   9.9465/0.18

[root@localhost sysbench]#
Result: 2521 QPS (queries per second)
OLTP DELETE ONLY transactions performance benchmarking for RocksDB:
[root@localhost sysbench]# sysbench oltp_delete.lua  --threads=100  --table-size=5000000  --db-driver=mysql --mysql-db=test --mysql-socket=/var/lib/mysql/mysql.sock --mysql-user=root --mysql-password=MyPassword2018 --mysql-storage-engine=rocksdb prepare
sysbench 1.0.14 (using bundled LuaJIT 2.1.0-beta2)

Initializing worker threads...

Creating table 'sbtest1'...
Inserting 5000000 records into 'sbtest1'
Creating a secondary index on 'sbtest1'...
[root@localhost sysbench]# sysbench oltp_delete.lua  --threads=100  --table-size=5000000  --db-driver=mysql --mysql-db=test --mysql-socket=/var/lib/mysql/mysql.sock --mysql-user=root --mysql-password=MyPassword2018 --mysql-storage-engine=rocksdb run
sysbench 1.0.14 (using bundled LuaJIT 2.1.0-beta2)

Running the test with following options:
Number of threads: 100
Initializing random number generator from current time


Initializing worker threads...

Threads started!

SQL statistics:
    queries performed:
        read:                            0
        write:                           7094
        other:                           421
        total:                           7515
    transactions:                        7515   (746.81 per sec.)
    queries:                             7515   (746.81 per sec.)
    ignored errors:                      0      (0.00 per sec.)
    reconnects:                          0      (0.00 per sec.)

General statistics:
    total time:                          10.0613s
    total number of events:              7515

Latency (ms):
         min:                                    0.43
         avg:                                  133.42
         max:                                 1666.25
         95th percentile:                      502.20
         sum:                              1002663.49

Threads fairness:
    events (avg/stddev):           75.1500/15.50
    execution time (avg/stddev):   10.0266/0.02
Result: 746 QPS (queries per second)
The graphical representation of more interesting performance benchmarking results on multiple DELETE only transactions scenarios:
Conclusion
InnoDB is almost 3X faster than MyRocks in OLTP DELETE operations.
InnoDB and MyRocks performance comparison :
- InnoDB is the definite choice if the transaction model is bulk INSERT, READ and DELETE intensive database operations.
- MyRocks performance is much better than InnoDB in WRITE and READ-WRITE intensive database operations.
The post A friendly comparison of InnoDB and MyRocks Performance appeared first on The WebScale Database Infrastructure Operations Experts.
]]>The post How to monitor Linux operations ? appeared first on The WebScale Database Infrastructure Operations Experts.
]]>How long Linux server is up and running ?
[root@localhost ~]# uptime
 12:32:56 up 1800 min,  83 users,  load average: 88.01, 88.52, 88.64
[root@localhost ~]#
Print all the processes running as root
[root@localhost ~]# ps -U root -u root
  PID TTY          TIME CMD
    1 ?        00:00:00 systemd
    2 ?        00:00:00 kthreadd
    3 ?        00:00:00 ksoftirqd/0
    4 ?        00:00:00 kworker/0:0
    5 ?        00:00:00 kworker/0:0H
    6 ?        00:00:00 kworker/u2:0
    7 ?        00:00:00 migration/0
    8 ?        00:00:00 rcu_bh
    9 ?        00:00:00 rcu_sched
   10 ?        00:00:00 watchdog/0
   12 ?        00:00:00 kdevtmpfs
   13 ?        00:00:00 netns
   14 ?        00:00:00 khungtaskd
   15 ?        00:00:00 writeback
   16 ?        00:00:00 kintegrityd
   17 ?        00:00:00 bioset
   18 ?        00:00:00 kblockd
[root@localhost ~]# ps -A

[root@localhost ~]# ps -A
  PID TTY          TIME CMD
    1 ?        00:00:00 systemd
    2 ?        00:00:00 kthreadd
    3 ?        00:00:00 ksoftirqd/0
    4 ?        00:00:00 kworker/0:0

[root@localhost ~]# ps -e
  PID TTY          TIME CMD
    1 ?        00:00:00 systemd
    2 ?        00:00:00 kthreadd
    3 ?        00:00:00 ksoftirqd/0
    4 ?        00:00:00 kworker/0:0
    5 ?        00:00:00 kworker/0:0H
Print all the processes owned by MySQL
[root@localhost ~]# ps -fG mysql
UID        PID  PPID  C STIME TTY          TIME CMD
mysql     1165     1  0 10:54 ?        00:00:00 /usr/sbin/mysqld --daemonize --pid-file=/var/run/mysqld/mysqld.pid
[root@localhost ~]#
Top
Displays all actively running processes in real-time, The matrices addressed in Linux “top” command are CPU usage, Memory usage, Swap Memory, Cache Size, Buffer Size, Process PID, User, Commandsetc.
[root@localhost ~]# top

top - 11:37:31 up 43 min,  3 users,  load average: 0.50, 0.15, 0.08
Tasks:  90 total,   1 running,  89 sleeping,   0 stopped,   0 zombie
%Cpu(s):100.0 us,  0.0 sy,  0.0 ni,  0.0 id,  0.0 wa,  0.0 hi,  0.0 si,  0.0 st
KiB Mem :  1016156 total,   541664 free,   307024 used,   167468 buff/cache
KiB Swap:  2097148 total,  2097148 free,        0 used.   553344 avail Mem

  PID USER      PR  NI    VIRT    RES    SHR S %CPU %MEM     TIME+ COMMAND
 1412 root      20   0   31068   1720   1324 S 99.7  0.2   0:43.38 sysbench
    1 root      20   0  125572   4096   2496 S  0.0  0.4   0:00.76 systemd
    2 root      20   0       0      0      0 S  0.0  0.0   0:00.00 kthreadd
    3 root      20   0       0      0      0 S  0.0  0.0   0:00.04 ksoftirqd/0
    5 root       0 -20       0      0      0 S  0.0  0.0   0:00.00 kworker/0:0H
    6 root      20   0       0      0      0 S  0.0  0.0   0:00.00 kworker/u2:0
    7 root      rt   0       0      0      0 S  0.0  0.0   0:00.00 migration/0
    8 root      20   0       0      0      0 S  0.0  0.0   0:00.00 rcu_bh
    9 root      20   0       0      0      0 S  0.0  0.0   0:00.15 rcu_sched
Press “c” option in running top command to know absolute path of running process
top - 11:43:20 up 49 min,  3 users,  load average: 1.27, 0.88, 0.43
Tasks:  90 total,   1 running,  88 sleeping,   1 stopped,   0 zombie
%Cpu(s): 99.2 us,  0.0 sy,  0.0 ni,  0.0 id,  0.0 wa,  0.0 hi,  0.8 si,  0.0 st
KiB Mem :  1016156 total,   540768 free,   307752 used,   167636 buff/cache
KiB Swap:  2097148 total,  2097148 free,        0 used.   552484 avail Mem

  PID USER      PR  NI    VIRT    RES    SHR S %CPU %MEM     TIME+ COMMAND
 1412 root      20   0   31068   1720   1324 S 99.7  0.2   6:31.61 sysbench --test=cpu --cpu-max-prime=300000000 run
 1415 root      20   0       0      0      0 S  0.3  0.0   0:00.14 [kworker/0:3]
    1 root      20   0  125572   4096   2496 S  0.0  0.4   0:00.77 /usr/lib/systemd/systemd --switched-root --system +
    2 root      20   0       0      0      0 S  0.0  0.0   0:00.00 [kthreadd]
    3 root      20   0       0      0      0 S  0.0  0.0   0:00.04 [ksoftirqd/0]
    5 root       0 -20       0      0      0 S  0.0  0.0   0:00.00 [kworker/0:0H]
    6 root      20   0       0      0      0 S  0.0  0.0   0:00.00 [kworker/u2:0]
Monitor CPU statistics using IOSTAT
[root@localhost ~]# iostat -c
Linux 3.10.0-693.21.1.el7.x86_64 (localhost.localdomain) 	04/21/2018 	_x86_64_	(1 CPU)

avg-cpu:  %user   %nice %system %iowait  %steal   %idle
           4.73    0.00    0.28    0.15    0.00   94.84
Top five CPU consuming processes
[root@localhost ~]# watch "ps aux | sort -nrk 3,3 | head -n 5"

Every 2.0s: ps aux | sort -nrk 3,3 | head -n 5                                                          Sat Apr 21 15:44:49 2018

root	  2658 99.8  0.2  39160  2816 pts/0    Sl+  15:38   6:41 sysbench --test=cpu --cpu-max-prime=30000000 --num-threads=120
mysql     1165  1.8 24.4 1152160 248112 ?      Sl   10:54   5:20 /usr/sbin/mysqld --daemonize --pid-file=/var/run/mysqld/mysqld.
USER	   PID %CPU %MEM    VSZ   RSS TTY      STAT START   TIME COMMAND
root	   932  0.0  0.0 113372   940 ?        S    10:54   0:00 /sbin/dhclient -d -q -sf /usr/libexec/nm-dhcp-helper -pf /var/r
root        92  0.0  0.0      0     0 ?        S    10:54   0:00 [kauditd]
Monitor % of CPU and memory consumption by Linux processes
[root@localhost ~]# ps aux k-pcpu | head -6
USER       PID %CPU %MEM    VSZ   RSS TTY      STAT START   TIME COMMAND
root      2658 99.8  0.2  39160  2816 pts/0    Sl+  15:38  10:05 sysbench --test=cpu --cpu-max-prime=30000000 --num-threads=120 run
mysql     1165  1.8 24.4 1152160 248112 ?      Sl   10:54   5:20 /usr/sbin/mysqld --daemonize --pid-file=/var/run/mysqld/mysqld.pid
root         1  0.0  0.2 125572  2148 ?        Ss   10:54   0:00 /usr/lib/systemd/systemd --switched-root --system --deserialize 21
root         2  0.0  0.0      0     0 ?        S    10:54   0:00 [kthreadd]
root         3  0.0  0.0      0     0 ?        S    10:54   0:00 [ksoftirqd/0]
Monitor active and inactive memory
[root@localhost ~]# vmstat -a
procs -----------memory---------- ---swap-- -----io---- -system-- ------cpu-----
 r  b   swpd   free  inact active   si   so    bi    bo   in   cs us sy id wa st
 2  0      0 540052 114584 294208    0    0    52    11  131   76  7  0 93  0  0
[root@localhost ~]#
Monitoring memory usage with timestamp
[root@localhost ~]# vmstat -t 1 50
procs -----------memory---------- ---swap-- -----io---- -system-- ------cpu----- -----timestamp-----
 r  b   swpd   free   buff  cache   si   so    bi    bo   in   cs us sy id wa st                 IST
 2  0      0 540508   2108 165580    0    0    22     5  146   65  9  0 91  0  0 2018-04-21 13:01:38
 2  0      0 540508   2108 165580    0    0     0     0  300   76 100  0  0  0  0 2018-04-21 13:01:39
 2  0      0 540508   2108 165580    0    0     0     0  283   76 100  0  0  0  0 2018-04-21 13:01:40
 1  0      0 540508   2108 165580    0    0     0     0  246   73 100  0  0  0  0 2018-04-21 13:01:41
 1  0      0 540508   2108 165580    0    0     0     0  280   84 96  4  0  0  0 2018-04-21 13:01:42
 2  0      0 540508   2108 165576    0    0     0    24  337   93 100  0  0  0  0 2018-04-21 13:01:43
 1  0      0 540508   2108 165576    0    0     0     0  283   79 100  0  0  0  0 2018-04-21 13:01:44
Monitoring top five memory consuming processes
[root@localhost ~]# ps -eo pid,comm,%cpu,%mem --sort=-%mem | head -n 5
  PID COMMAND         %CPU %MEM
 1165 mysqld           1.8 24.4
 2405 dhclient         0.0  1.5
  774 NetworkManager   0.0  0.4
 1137 tuned            0.0  0.2
Monitoring disk I/O statistics
[root@localhost ~]# iostat -d
Linux 3.10.0-693.21.1.el7.x86_64 (localhost.localdomain) 	04/21/2018 	_x86_64_	(1 CPU)

Device:            tps    kB_read/s    kB_wrtn/s    kB_read    kB_wrtn
sda              27.68      1191.80      3866.67   13191808   42799263
dm-0             22.33      1185.06      3838.77   13117158   42490503
dm-1              8.38         5.99        27.71      66324     306712
More detailed disk I/O monitoring at process level using ‘iotop’
To monitor disk I/O more detailed at process level (very much real-time) we use ‘iotop’
Total DISK READ :     269.52 M/s | Total DISK WRITE :      50.85 M/s
Actual DISK READ:     269.52 M/s | Actual DISK WRITE:      51.96 M/s
  TID  PRIO  USER     DISK READ  DISK WRITE  SWAPIN     IO>    COMMAND
 1821 be/4 root     1564.46 K/s  204.70 K/s  0.00 % 50.39 % sysbench fileio --thr~le-test-mode=rndrw run
 1893 be/4 root      720.09 K/s  190.07 K/s  0.00 % 42.68 % sysbench fileio --thr~le-test-mode=rndrw run
 2080 be/4 root      789.54 K/s  190.07 K/s  0.00 % 42.23 % sysbench fileio --thr~le-test-mode=rndrw run
 1867 be/4 root     1286.66 K/s  190.07 K/s  0.00 % 41.35 % sysbench fileio --thr~le-test-mode=rndrw run
 1870 be/4 root      321.66 K/s  160.83 K/s  0.00 % 41.16 % sysbench fileio --thr~le-test-mode=rndrw run
 1833 be/4 root     1257.41 K/s  204.70 K/s  0.00 % 40.66 % sysbench fileio --thr~le-test-mode=rndrw run
 1934 be/4 root      789.54 K/s  190.07 K/s  0.00 % 40.15 % sysbench fileio --thr~le-test-mode=rndrw run
 2035 be/4 root     1286.66 K/s  204.70 K/s  0.00 % 39.73 % sysbench fileio --thr~le-test-mode=rndrw run
 1975 be/4 root      745.68 K/s  190.07 K/s  0.00 % 39.49 % sysbench fileio --thr~le-test-mode=rndrw run
 1851 be/4 root     1579.08 K/s  190.07 K/s  0.00 % 39.36 % sysbench fileio --thr~le-test-mode=rndrw run
 1836 be/4 root      877.27 K/s  190.07 K/s  0.00 % 39.35 % sysbench fileio --thr~le-test-mode=rndrw run
 2001 be/4 root      160.83 K/s  131.59 K/s  0.00 % 39.34 % sysbench fileio --thr~le-test-mode=rndrw run
 1879 be/4 root     1842.26 K/s  190.07 K/s  0.00 % 39.22 % sysbench fileio --thr~le-test-mode=rndrw run
 1872 be/4 root      263.18 K/s  204.70 K/s  0.00 % 38.48 % sysbench fileio --thr~le-test-mode=rndrw run
 1953 be/4 root        2.81 M/s  146.21 K/s  0.00 % 38.35 % sysbench fileio --thr~le-test-mode=rndrw run
 1941 be/4 root      292.42 K/s  277.80 K/s  0.00 % 38.31 % sysbench fileio --thr~le-test-mode=rndrw run
 1913 be/4 root     1345.14 K/s  204.70 K/s  0.00 % 38.02 % sysbench fileio --thr~le-test-mode=rndrw run
 2017 be/4 root      628.71 K/s  160.83 K/s  0.00 % 37.93 % sysbench fileio --thr~le-test-mode=rndrw run
 2040 be/4 root      745.68 K/s  190.07 K/s  0.00 % 37.61 % sysbench fileio --thr~le-test-mode=rndrw run
 1942 be/4 root      555.60 K/s  160.83 K/s  0.00 % 37.49 % sysbench fileio --thr~le-test-mode=rndrw run
 1980 be/4 root      233.94 K/s  219.32 K/s  0.00 % 37.49 % sysbench fileio --thr~le-test-mode=rndrw run
This is how usually we begin a MySQL performance benchmarking and audit project, We first understand the load in the Linux and from there our matrices will be completely MySQL biased, We deliver very detailed performance optimization recommendation, which will / can be used by our customers for performance optimization and capacity planning / sizing.
The post How to monitor Linux operations ? appeared first on The WebScale Database Infrastructure Operations Experts.
]]>The post Benchmarking CPU, Memory, file I/O and mutex performance using Sysbench appeared first on The WebScale Database Infrastructure Operations Experts.
]]>Benchmarking CPU using Sysbench
This benchmark is configured with the number of simultaneous threads and the maximum number to verify if it is a prime.
[root@localhost shiv]# sysbench --test=cpu --cpu-max-prime=2000000 --num-threads=120 run
Running the test with following options:
Number of threads: 120
Initializing random number generator from current time


Prime numbers limit: 2000000

Initializing worker threads...

Threads started!

CPU speed:
    events per second:     0.69

Throughput:
    events/s (eps):                      0.6891
    time elapsed:                        174.1418s
    total number of events:              120

Latency (ms):
         min:                               169807.71
         avg:                               172640.02
         max:                               174120.65
         95th percentile:                   100000.00
         sum:                             20716802.25

Threads fairness:
    events (avg/stddev):           1.0000/0.00
    execution time (avg/stddev):   172.6400/0.83
[root@localhost shiv]# sysbench --test=threads --thread-locks=10 --max-time=60 run

sysbench 1.1.0-651e7fd (using bundled LuaJIT 2.1.0-beta3)

Running the test with following options:
Number of threads: 1
Initializing random number generator from current time


Initializing worker threads...

Threads started!


Throughput:
    events/s (eps):                      2366.0725
    time elapsed:                        60.0003s
    total number of events:              141965

Latency (ms):
         min:                                    0.38
         avg:                                    0.42
         max:                                    8.86
         95th percentile:                        0.53
         sum:                                59942.51

Threads fairness:
    events (avg/stddev):           141965.0000/0.00
    execution time (avg/stddev):   59.9425/0.00
To conclude the interpretation of thread performance benchmarking, we annotate time elapsed (actual time for the completion of the activity), in this case it “60.0003” seconds.
[root@localhost shiv]# sysbench --test=mutex --num-threads=130 run
WARNING: the --test option is deprecated. You can pass a script name or path on the command line without any options.
WARNING: --num-threads is deprecated, use --threads instead
sysbench 1.1.0-651e7fd (using bundled LuaJIT 2.1.0-beta3)

Running the test with following options:
Number of threads: 130
Initializing random number generator from current time


Initializing worker threads...

Threads started!


Throughput:
    events/s (eps):                      5.8047
    time elapsed:                        22.3956s
    total number of events:              130

Latency (ms):
         min:                                17566.82
         avg:                                20789.93
         max:                                22230.90
         95th percentile:                    21641.55
         sum:                              2702690.46

Threads fairness:
    events (avg/stddev):           1.0000/0.00
    execution time (avg/stddev):   20.7899/0.82
The throughput and average latency are the two matrices we consider to interpret mutex workload performance :
Throughput:
    events/s (eps):                      5.8047
    time elapsed:                        22.3956s

Latency (ms):
         min:                                17566.82
         avg:                                20789.93
         max:                                22230.90
         95th percentile:                    21641.55
         sum:                              2702690.46
Benchmarking the memory workload
When we use sysbench to benchmark memory, sysbench allocate a memory buffer and then read or write from/on it, each time for the size of a pointer (32 bit or 64 bit) and until the total buffer size has been read from or written to. This activity will be continued till the provided volume (–memory-total-size) is reached. The load can be increased or reduced by providing multiple threads (–num-threads), size of buffer (–memory-block-size) and request type (read / write / sequential / random)
[root@localhost shiv]# sysbench --test=memory --num-threads=140 --memory-total-size=10G run

sysbench 1.1.0-651e7fd (using bundled LuaJIT 2.1.0-beta3)

Running the test with following options:
Number of threads: 140
Initializing random number generator from current time


Running memory speed test with the following options:
  block size: 1KiB
  total size: 10240MiB
  operation: write
  scope: global

Initializing worker threads...

Threads started!

Total operations: 10485720 (3351958.44 per second)

10239.96 MiB transferred (3273.40 MiB/sec)


Throughput:
    events/s (eps):                      3351958.4393
    time elapsed:                        3.1282s
    total number of events:              10485720

Latency (ms):
         min:                                    0.00
         avg:                                    0.01
         max:                                 2931.98
         95th percentile:                        0.00
         sum:                               123371.54

Threads fairness:
    events (avg/stddev):           74898.0000/0.00
    execution time (avg/stddev):   0.8812/0.93
Throughput and operations per second are the important matrices to measure for memory workload benchmarking :
Total operations: 10485720 (3351958.44 per second)

10239.96 MiB transferred (3273.40 MiB/sec)
Benchmarking file system I/O with Sysbench
You can use multiple scenarios for benchmarking file system I/O but here we have used rndrw (combined random read / write) for more complex I/O and production similar I/O operations, This happens in three steps explained below:
- Prepare – Creates the files for testing
- Run – Performs the benchmarking and reporting
- Cleanup – Clean the system by deleting the files
Prepare
[root@localhost shiv]# sysbench --num-threads=16 --test=fileio --file-total-size=10G --file-test-mode=rndrw prepare

sysbench 1.1.0-651e7fd (using bundled LuaJIT 2.1.0-beta3)

128 files, 81920Kb each, 10240Mb total
Creating files for the test...
Extra file open flags: (none)
Reusing existing file test_file.0
Reusing existing file test_file.1
Reusing existing file test_file.2
Reusing existing file test_file.3
..................................
..................................

Reusing existing file test_file.122
Reusing existing file test_file.123
Reusing existing file test_file.124
Reusing existing file test_file.125
Reusing existing file test_file.126
Reusing existing file test_file.127
Run
[root@localhost shiv]# sysbench --num-threads=16 --test=fileio --file-total-size=10G --file-test-mode=rndrw run

sysbench 1.1.0-651e7fd (using bundled LuaJIT 2.1.0-beta3)

Running the test with following options:
Number of threads: 16
Initializing random number generator from current time


Extra file open flags: (none)
128 files, 80MiB each
10GiB total file size
Block size 16KiB
Number of IO requests: 0
Read/Write ratio for combined random IO test: 1.50
Periodic FSYNC enabled, calling fsync() each 100 requests.
Calling fsync() at the end of test, Enabled.
Using synchronous I/O mode
Doing random r/w test
Initializing worker threads...

Threads started!


Throughput:
         read:  IOPS=2495.85 39.00 MiB/s (40.89 MB/s)
         write: IOPS=1663.70 26.00 MiB/s (27.26 MB/s)
         fsync: IOPS=5311.68

Latency (ms):
         min:                                  0.00
         avg:                                  1.69
         max:                                631.90
         95th percentile:                      5.00
         sum:                             159794.48
Cleanup
[root@localhost shiv]# sysbench --num-threads=16 --test=fileio --file-total-size=10G --file-test-mode=rndrw cleanup
WARNING: the --test option is deprecated. You can pass a script name or path on the command line without any options.
WARNING: --num-threads is deprecated, use --threads instead
sysbench 1.1.0-651e7fd (using bundled LuaJIT 2.1.0-beta3)

Removing test files...
In the file system I/O benchmarking, We spend time annotating and interpreting only throughput (both reads and writes) under varying loads, Here in the test above read throughput is 40.89 MB/s and the write throughput is 27.26 MB/s
The post Benchmarking CPU, Memory, file I/O and mutex performance using Sysbench appeared first on The WebScale Database Infrastructure Operations Experts.
]]>The post Benchmarking MySQL 5.7 using Sysbench 1.1 appeared first on The WebScale Database Infrastructure Operations Experts.
]]>CPU – How long it takes for CPU to compute maximum primary number ? You may as well add how many threads are participating in this benchmarking process . This is very direct and easy way to benchmark the CPU performance.
File I/O – Benchmarking disk I/O performance considering all possible scenarios like direct io, sync, async etc. testing sequential reads / writes and random reads / writes , This makes an very scalable disk I/O benchmarking possible.
OLTP – Benchmarking MySQL under all possible workloads, like SELECT only queries (random / sequential SELECT) , INSERT / UPDATE / DELETE operations on multiple use case scenarios like bulk data loading, range-based updates, high volume data deletes (both random and sequential) etc. There is no MySQL benchmarking complete without Sysbench
Installing Sysbench
There are several ways to install Sysbench, It’s very well documented here – https://github.com/akopytov/sysbench#linux so we are not repeating it here again but we personally prefer installing Sysbench from source for many reasons so I have shared my method of installing Sysbench on CentOS
Git clone Sysbench :
[root@localhost Sysbench]# git clone https://github.com/akopytov/sysbench.git
Cloning into 'sysbench'...
remote: Counting objects: 8891, done.
remote: Total 8891 (delta 0), reused 0 (delta 0), pack-reused 8891
Receiving objects: 100% (8891/8891), 3.88 MiB | 1.47 MiB/s, done.
Resolving deltas: 100% (6320/6320), done.
[root@localhost sysbench]# ls
COPYING    Makefile.am       README-WIN.txt  autogen.sh  configure.ac  install-sh  missing        rpm      snap  tests
ChangeLog  README-Oracle.md  README.md       config      debian        m4          mkinstalldirs  scripts  src
Build Requirements (we use CentOS 7.3)
[root@localhost sysbench]# yum -y install make automake libtool pkgconfig libaio-devel

  Verifying  : glibc-2.17-157.el7.x86_64                                                                                             21/23
  Verifying  : libgomp-4.8.5-11.el7.x86_64                                                                                           22/23
  Verifying  : glibc-common-2.17-157.el7.x86_64                                                                                      23/23

Installed:
  automake.noarch 0:1.13.4-3.el7             libaio-devel.x86_64 0:0.3.109-13.el7             libtool.x86_64 0:2.4.2-22.el7_3

Dependency Installed:
  autoconf.noarch 0:2.69-11.el7              cpp.x86_64 0:4.8.5-16.el7_4.2                gcc.x86_64 0:4.8.5-16.el7_4.2
  glibc-devel.x86_64 0:2.17-196.el7_4.2      glibc-headers.x86_64 0:2.17-196.el7_4.2      kernel-headers.x86_64 0:3.10.0-693.21.1.el7
  libmpc.x86_64 0:1.0.1-3.el7                m4.x86_64 0:1.4.16-10.el7                    mpfr.x86_64 0:3.1.1-4.el7
  perl-Data-Dumper.x86_64 0:2.145-3.el7      perl-Test-Harness.noarch 0:3.28-3.el7        perl-Thread-Queue.noarch 0:3.02-2.el7

Dependency Updated:
  glibc.x86_64 0:2.17-196.el7_4.2             glibc-common.x86_64 0:2.17-196.el7_4.2           libgcc.x86_64 0:4.8.5-16.el7_4.2
  libgomp.x86_64 0:4.8.5-16.el7_4.2

Complete!
[root@localhost sysbench]# yum -y install mysql-devel

  Verifying  : e2fsprogs-libs-1.42.9-9.el7.x86_64                                                                                    34/35
  Verifying  : krb5-libs-1.14.1-26.el7.x86_64                                                                                        35/35

Installed:
  mariadb-devel.x86_64 1:5.5.56-2.el7

Dependency Installed:
  keyutils-libs-devel.x86_64 0:1.5.8-3.el7       krb5-devel.x86_64 0:1.15.1-8.el7           libcom_err-devel.x86_64 0:1.42.9-10.el7
  libkadm5.x86_64 0:1.15.1-8.el7                 libselinux-devel.x86_64 0:2.5-11.el7       libsepol-devel.x86_64 0:2.5-6.el7
  libverto-devel.x86_64 0:0.2.5-4.el7            openssl-devel.x86_64 1:1.0.2k-8.el7        pcre-devel.x86_64 0:8.32-17.el7
  zlib-devel.x86_64 0:1.2.7-17.el7

Dependency Updated:
  e2fsprogs.x86_64 0:1.42.9-10.el7             e2fsprogs-libs.x86_64 0:1.42.9-10.el7         krb5-libs.x86_64 0:1.15.1-8.el7
  libcom_err.x86_64 0:1.42.9-10.el7            libselinux.x86_64 0:2.5-11.el7                libselinux-python.x86_64 0:2.5-11.el7
  libselinux-utils.x86_64 0:2.5-11.el7         libss.x86_64 0:1.42.9-10.el7                  mariadb-libs.x86_64 1:5.5.56-2.el7
  openssl.x86_64 1:1.0.2k-8.el7                openssl-libs.x86_64 1:1.0.2k-8.el7            pcre.x86_64 0:8.32-17.el7

Complete!
Install Sysbench from source
Step 1 – Run “autogen.sh”
[root@localhost sysbench]# ./autogen.sh
perl: warning: Setting locale failed.
perl: warning: Please check that your locale settings:
	LANGUAGE = (unset),
	LC_ALL = (unset),
	LC_CTYPE = "UTF-8",
	LANG = "en_US.UTF-8"

configure.ac:59: installing 'config/ar-lib'
configure.ac:45: installing 'config/compile'
configure.ac:27: installing 'config/config.guess'
configure.ac:27: installing 'config/config.sub'
configure.ac:32: installing 'config/install-sh'
configure.ac:32: installing 'config/missing'
src/Makefile.am: installing 'config/depcomp'
parallel-tests: installing 'config/test-driver'
autoreconf: Leaving directory `.'
Step 2 – Run “configure.sh”
[root@localhost sysbench]# ls
COPYING      Makefile.in       README.md   autom4te.cache  configure.ac  m4             rpm      src
ChangeLog    README-Oracle.md  aclocal.m4  config          debian        missing        scripts  tests
Makefile.am  README-WIN.txt    autogen.sh  configure       install-sh    mkinstalldirs  snap     third_party
[root@localhost sysbench]# ./configure
checking build system type... x86_64-unknown-linux-gnu
checking host system type... x86_64-unknown-linux-gnu
checking target system type... x86_64-unknown-linux-gnu

===============================================================================
sysbench version   : 1.1.0-651e7fd
CC                 : gcc -std=gnu99
CFLAGS             : -O3 -funroll-loops -ggdb3  -march=core2 -Wall -Wextra -Wpointer-arith -Wbad-function-cast -Wstrict-prototypes -Wnested-externs -Wno-format-zero-length -Wundef -Wstrict-prototypes -Wmissing-prototypes -Wmissing-declarations -Wredundant-decls -Wcast-align   -pthread
CPPFLAGS           : -D_GNU_SOURCE   -I$(top_srcdir)/src -I$(abs_top_builddir)/third_party/luajit/inc -I$(abs_top_builddir)/third_party/concurrency_kit/include
LDFLAGS            : -L/usr/local/lib
LIBS               : -laio -lm

prefix             : /usr/local
bindir             : ${prefix}/bin
libexecdir         : ${prefix}/libexec
mandir             : ${prefix}/share/man
datadir            : ${prefix}/share

MySQL support      : yes
Drizzle support    : no
AttachSQL support  : no
Oracle support     : no
PostgreSQL support : no

LuaJIT             : bundled
LUAJIT_CFLAGS      : -I$(abs_top_builddir)/third_party/luajit/inc
LUAJIT_LIBS        : $(abs_top_builddir)/third_party/luajit/lib/libluajit-5.1.a -ldl
LUAJIT_LDFLAGS     : -rdynamic

Concurrency Kit    : bundled
CK_CFLAGS          : -I$(abs_top_builddir)/third_party/concurrency_kit/include
CK_LIBS            : $(abs_top_builddir)/third_party/concurrency_kit/lib/libck.a
configure flags    :
===============================================================================
Step 3 – Make sysbench for MySQL benchmarking with Lua scripts
[root@localhost sysbench]#
[root@localhost sysbench]# make -j
Making all in third_party/luajit
make[1]: Entering directory `/home/shiv/Sysbench/sysbench/third_party/luajit'
make -C ./luajit clean
make[2]: Entering directory `/home/shiv/Sysbench/sysbench/third_party/luajit/luajit'
make -C src clean
make[3]: Entering directory `/home/shiv/Sysbench/sysbench/third_party/luajit/luajit/src'
rm -f luajit libluajit.a libluajit.so host/minilua host/buildvm lj_vm.S lj_bcdef.h lj_ffdef.h lj_libdef.h lj_recdef.h lj_folddef.h host/buildvm_arch.h jit/vmdef.lua *.o host/*.o *.obj *.lib *.exp *.dll *.exe *.manifest *.pdb *.ilk
make[3]: Leaving directory `/home/shiv/Sysbench/sysbench/third_party/luajit/luajit/src'
make[2]: Leaving directory `/home/shiv/Sysbench/sysbench/third_party/luajit/luajit'

libtool: link: gcc -std=gnu99 -Wall -Wextra -Wpointer-arith -Wbad-function-cast -Wstrict-prototypes -Wnested-externs -Wno-format-zero-length -Wundef -Wstrict-prototypes -Wmissing-prototypes -Wmissing-declarations -Wredundant-decls -Wcast-align -pthread -O3 -funroll-loops -ggdb3 -march=core2 -rdynamic -o sysbench sysbench.o sb_timer.o sb_options.o sb_logger.o db_driver.o sb_histogram.o sb_rand.o sb_thread.o sb_barrier.o sb_lua.o sb_util.o sb_counter.o  -L/usr/local/lib tests/fileio/libsbfileio.a tests/threads/libsbthreads.a tests/memory/libsbmemory.a tests/cpu/libsbcpu.a tests/mutex/libsbmutex.a drivers/mysql/libsbmysql.a -L/usr/lib64/mysql -lmysqlclient -lpthread -lz -lssl -lcrypto /home/shiv/Sysbench/sysbench/third_party/luajit/lib/libluajit-5.1.a -ldl /home/shiv/Sysbench/sysbench/third_party/concurrency_kit/lib/libck.a -laio -lm -pthread
make[2]: Leaving directory `/home/shiv/Sysbench/sysbench/src'
make[1]: Leaving directory `/home/shiv/Sysbench/sysbench/src'
Making all in tests
make[1]: Entering directory `/home/shiv/Sysbench/sysbench/tests'
make[1]: Nothing to be done for `all'.
make[1]: Leaving directory `/home/shiv/Sysbench/sysbench/tests'
make[1]: Entering directory `/home/shiv/Sysbench/sysbench'
make[1]: Nothing to be done for `all-am'.
make[1]: Leaving directory `/home/shiv/Sysbench/sysbench'
[root@localhost sysbench]#
[root@localhost sysbench]# make install
Making install in third_party/luajit
make[1]: Entering directory `/home/shiv/Sysbench/sysbench/third_party/luajit'
make[2]: Entering directory `/home/shiv/Sysbench/sysbench/third_party/luajit'
make[2]: Nothing to be done for `install-exec-am'.
make[2]: Nothing to be done for `install-data-am'.
make[2]: Leaving directory `/home/shiv/Sysbench/sysbench/third_party/luajit'
make[1]: Leaving directory `/home/shiv/Sysbench/sysbench/third_party/luajit'
Making install in third_party/concurrency_kit
make[1]: Entering directory `/home/shiv/Sysbench/sysbench/third_party/concurrency_kit'
make[2]: Entering directory `/home/shiv/Sysbench/sysbench/third_party/concurrency_kit'
make[2]: Nothing to be done for `install-exec-am'.
make[2]: Nothing to be done for `install-data-am'.
make[2]: Leaving directory `/home/shiv/Sysbench/sysbench/third_party/concurrency_kit'
make[1]: Leaving directory `/home/shiv/Sysbench/sysbench/third_party/concurrency_kit'
Making install in src
make[1]: Entering directory `/home/shiv/Sysbench/sysbench/src'

 /usr/bin/mkdir -p '/usr/local/share/sysbench/tests'
 /usr/bin/install -c test_run.sh '/usr/local/share/sysbench/tests'
make[2]: Leaving directory `/home/shiv/Sysbench/sysbench/tests'
make[1]: Leaving directory `/home/shiv/Sysbench/sysbench/tests'
make[1]: Entering directory `/home/shiv/Sysbench/sysbench'
make[2]: Entering directory `/home/shiv/Sysbench/sysbench'
make[2]: Nothing to be done for `install-exec-am'.
make[2]: Nothing to be done for `install-data-am'.
make[2]: Leaving directory `/home/shiv/Sysbench/sysbench'
make[1]: Leaving directory `/home/shiv/Sysbench/sysbench'
[root@localhost sysbench]#
Step 4 – Confirm successful installation of Sysbench 1.1
[root@localhost sysbench]# sysbench --version
sysbench 1.1.0-651e7fd
[root@localhost sysbench]#
How to use Sysbench for benchmarking ?
Benchmarking CPU
Benchmarking CPU with just 1 thread , we look for time elapsed value majorly (In this case it is 10.0457s)
[root@localhost sysbench]# sysbench --test=cpu --cpu-max-prime=300000 run

sysbench 1.1.0-651e7fd (using bundled LuaJIT 2.1.0-beta3)

Running the test with following options:
Number of threads: 1
Initializing random number generator from current time


Prime numbers limit: 300000

Initializing worker threads...

Threads started!

CPU speed:
    events per second:     9.85

Throughput:
    events/s (eps):                      9.8550
    time elapsed:                        10.0457s
    total number of events:              99

Latency (ms):
         min:                                   91.73
         avg:                                  101.46
         max:                                  179.27
         95th percentile:                      110.66
         sum:                                10044.86

Threads fairness:
    events (avg/stddev):           99.0000/0.00
    execution time (avg/stddev):   10.0449/0.00

[root@localhost sysbench]#
Benchmarking CPU with 60 threads (if you notice –test option is deprecated with Sysbench 1.1)
[root@localhost sysbench]# sysbench --test=cpu --cpu-max-prime=300000 --num-threads=60 run

sysbench 1.1.0-651e7fd (using bundled LuaJIT 2.1.0-beta3)

Running the test with following options:
Number of threads: 60
Initializing random number generator from current time


Prime numbers limit: 300000

Initializing worker threads...

Threads started!

CPU speed:
    events per second:     9.90

Throughput:
    events/s (eps):                      9.9047
    time elapsed:                        12.1155s
    total number of events:              120

Latency (ms):
         min:                                 4802.24
         avg:                                 5781.75
         max:                                 6633.59
         95th percentile:                     6360.91
         sum:                               693809.67

Threads fairness:
    events (avg/stddev):           2.0000/0.00
    execution time (avg/stddev):   11.5635/0.28

[root@localhost sysbench]#
Benchmarking RAM / Memory (both reads and writes)
[root@localhost sysbench]# sysbench --test=memory --memory-block-size=64K --memory-scope=global --memory-total-size=300G --memory-oper=read run

sysbench 1.1.0-651e7fd (using bundled LuaJIT 2.1.0-beta3)

Running the test with following options:
Number of threads: 1
Initializing random number generator from current time


Running memory speed test with the following options:
  block size: 64KiB
  total size: 307200MiB
  operation: read
  scope: global

Initializing worker threads...

Threads started!

Total operations: 3210450 (321043.11 per second)

200653.12 MiB transferred (20065.19 MiB/sec)


Throughput:
    events/s (eps):                      321043.1076
    time elapsed:                        10.0001s
    total number of events:              3210450

Latency (ms):
         min:                                    0.00
         avg:                                    0.00
         max:                                   22.43
         95th percentile:                        0.00
         sum:                                 9251.30

Threads fairness:
    events (avg/stddev):           3210450.0000/0.00
    execution time (avg/stddev):   9.2513/0.00
[root@localhost sysbench]# sysbench --test=memory --memory-block-size=64K --memory-scope=global --memory-total-size=300G --memory-oper=write run

sysbench 1.1.0-651e7fd (using bundled LuaJIT 2.1.0-beta3)

Running the test with following options:
Number of threads: 1
Initializing random number generator from current time


Running memory speed test with the following options:
  block size: 64KiB
  total size: 307200MiB
  operation: write
  scope: global

Initializing worker threads...

Threads started!

Total operations: 2378246 (237823.34 per second)

148640.38 MiB transferred (14863.96 MiB/sec)


Throughput:
    events/s (eps):                      237823.3394
    time elapsed:                        10.0001s
    total number of events:              2378246

Latency (ms):
         min:                                    0.00
         avg:                                    0.00
         max:                                    7.84
         95th percentile:                        0.00
         sum:                                 9485.47

Threads fairness:
    events (avg/stddev):           2378246.0000/0.00
    execution time (avg/stddev):   9.4855/0.00
Benchmarking Disk I/O
The following I/O operations can be benchmarked using Sysbench :
- Sequential write – seqwr
- Sequential rewrite – seqrewr
- Sequential read – seqrd
- Random read – rndrd
- Random write – rndwr
- Combined random read/write – rndrw
Examples
Step 1 – Create a file , define total number of threads and file test mode. In the example below, we have selected combined random read/write (rndrw)
[root@localhost sysbench]# sysbench --num-threads=16 --test=fileio --file-total-size=2G --file-test-mode=rndrw prepare

sysbench 1.1.0-651e7fd (using bundled LuaJIT 2.1.0-beta3)

128 files, 16384Kb each, 2048Mb total
Creating files for the test...
Extra file open flags: (none)
Creating file test_file.0
Creating file test_file.1
Creating file test_file.2
Creating file test_file.3
Creating file test_file.4
Creating file test_file.5
Creating file test_file.6
Creating file test_file.7
Creating file test_file.8
Creating file test_file.9
Creating file test_file.10
Creating file test_file.11
Creating file test_file.12
Creating file test_file.13
Creating file test_file.14
Creating file test_file.15
.........
............
Creating file test_file.125
Creating file test_file.126
Creating file test_file.127
2147483648 bytes written in 3.21 seconds (637.65 MiB/sec).
Step 2 – Run benchmarking test on file created above
[root@localhost sysbench]# sysbench --num-threads=16 --test=fileio --file-total-size=2G --file-test-mode=rndrw run

sysbench 1.1.0-651e7fd (using bundled LuaJIT 2.1.0-beta3)

128 files, 16MiB each
2GiB total file size
Block size 16KiB
Number of IO requests: 0
Read/Write ratio for combined random IO test: 1.50
Periodic FSYNC enabled, calling fsync() each 100 requests.
Calling fsync() at the end of test, Enabled.
Using synchronous I/O mode
Doing random r/w test
Initializing worker threads...

Threads started!


Throughput:
         read:  IOPS=2111.56 32.99 MiB/s (34.60 MB/s)
         write: IOPS=1407.37 21.99 MiB/s (23.06 MB/s)
         fsync: IOPS=4500.34

Latency (ms):
         min:                                  0.00
         avg:                                  1.99
         max:                                621.12
         95th percentile:                      4.10
         sum:                             159899.55
Step 3 – Remove the files once completed benchmarking
[root@localhost sysbench]# sysbench --num-threads=16 --test=fileio --file-total-size=2G --file-test-mode=rndrw cleanup

sysbench 1.1.0-651e7fd (using bundled LuaJIT 2.1.0-beta3)

Removing test files...
Benchmarking MySQL using custom Lua scripts available with installation of Sysbench 1.1 (/usr/local/share/sysbench)
We have custom Lua scripts available with Sysbench 1.1 for benchmarking MySQL (I have listed them below)
[root@localhost sysbench]# ls
bulk_insert.lua  oltp_delete.lua  oltp_point_select.lua  oltp_read_write.lua    oltp_update_non_index.lua  select_random_points.lua  tests
oltp_common.lua  oltp_insert.lua  oltp_read_only.lua     oltp_update_index.lua  oltp_write_only.lua        select_random_ranges.lua
Step 1 – create a MySQL database for running the benchmarking tests
mysql> create database sysbench;
Query OK, 1 row affected (0.00 sec)
We have chosen “select_random_points.lua” script for benchmarking MySQL 5.7(default setting) in the example below :
Step 2 – Prepare sbtest1 table in sysbench database create above with 2M records
[root@localhost sysbench]# sysbench select_random_points.lua --table-size=2000000 --num-threads=1 --rand-type=uniform --db-driver=mysql --mysql-db=sysbench --mysql-user=root --mysql-password=SriLanka/2018 prepare
sysbench 1.1.0-651e7fd (using bundled LuaJIT 2.1.0-beta3)

Creating table 'sbtest1'...
Inserting 2000000 records into 'sbtest1'
Creating a secondary index on 'sbtest1'...
[root@localhost sysbench]#
mysql> show table status like 'sbtest%' \G;
*************************** 1. row ***************************
           Name: sbtest1
         Engine: InnoDB
        Version: 10
     Row_format: Dynamic
           Rows: 1921969
 Avg_row_length: 233
    Data_length: 449724416
Max_data_length: 0
   Index_length: 0
      Data_free: 5242880
 Auto_increment: 2000001
    Create_time: 2018-03-12 23:32:13
    Update_time: 2018-03-12 23:32:07
     Check_time: NULL
      Collation: latin1_swedish_ci
       Checksum: NULL
 Create_options:
        Comment:
1 row in set (0.00 sec)

ERROR:
No query specified
Step 3 – Run the benchmark test using select_random_ponts.lua script , We have selected 100 threads for this test :
[root@localhost sysbench]# sysbench select_random_points.lua --table-size=2000000 --num-threads=100 --rand-type=uniform --db-driver=mysql --mysql-db=sysbench --mysql-user=root --mysql-password=SriLanka/2018 run

sysbench 1.1.0-651e7fd (using bundled LuaJIT 2.1.0-beta3)

Running the test with following options:
Number of threads: 100
Initializing random number generator from current time


Initializing worker threads...

Threads started!

SQL statistics:
    queries performed:
        read:                            28214
        write:                           0
        other:                           0
        total:                           28214
    transactions:                        28214  (2799.30 per sec.)
    queries:                             28214  (2799.30 per sec.)
    ignored errors:                      0      (0.00 per sec.)
    reconnects:                          0      (0.00 per sec.)

Throughput:
    events/s (eps):                      2799.2957
    time elapsed:                        10.0790s
    total number of events:              28214

Latency (ms):
         min:                                    0.15
         avg:                                   35.50
         max:                                 1727.81
         95th percentile:                       77.19
         sum:                              1001542.39

Threads fairness:
    events (avg/stddev):           282.1400/13.24
    execution time (avg/stddev):   10.0154/0.02
In the above report, time elapsed (at MinervaDB we measure performance by response time ) is most important matrix for me, Though we consider transactions / queries per second equally to measure the load in the system
Step 4 – Please don’t not forget to cleanup MySQL database created (sysbench in this example)
[root@localhost sysbench]# sysbench select_random_points.lua --table-size=2000000 --num-threads=100 --rand-type=uniform --db-driver=mysql --mysql-db=sysbench --mysql-user=root --mysql-password=SriLanka/2018 cleanup
sysbench 1.1.0-651e7fd (using bundled LuaJIT 2.1.0-beta3)

Dropping table 'sbtest1'...
[root@localhost sysbench]#
Conclusion
The only intention of this blog is to help you learn how to install Sysbench 1.1 and benchmark MySQL, We have not tweaked MySQL for performance and the data collected with this exercise is not for publishing MySQL 5.7 performance benchmarking results.
The post Benchmarking MySQL 5.7 using Sysbench 1.1 appeared first on The WebScale Database Infrastructure Operations Experts.
]]>The post MySQL Performance Audit, Health Check, Diagnostics and Forensics By MinervaDB appeared first on The WebScale Database Infrastructure Operations Experts.
]]>The post MySQL Performance Audit, Health Check, Diagnostics and Forensics By MinervaDB appeared first on The WebScale Database Infrastructure Operations Experts.
]]>