The post Tuning MyRocks for performance appeared first on The WebScale Database Infrastructure Operations Experts.
]]>We know InnoDB is constrained by a fixed compressed page size. Alignment during fragmentation and compression causes extra unused space because the leaf nodes are not full. Let’s consider a InnoDB table with a compressed page size of 8KB. A 16KB in-memory page compressed to 5KB still uses 8KB on storage. Adding to this, each entry in the primary key index has 13 bytes of metadata (6 byte transaction id + 7 byte rollback pointer), and the metadata is not compressed, making the space overhead significant for small rows. Typically flash devices are limited by the WRITE endurance, In a typical scenario were index values are stored in leaf nodes and sorted by key, the often operational database may not fit in memory and keys get updated in an random platform leading to higher write amplification. In the worst case, updating one row requires a number of page reads, makes several pages dirty, and forces many dirty pages to be written back to storage.
Sow now what I really love about MyRocks?
It’s all about much lower write amplification factor of RocksDB compared to InnoDB is what I am very much impressed about. On pure flash, reducing write volume (write amplification) is important because flash burns out if writing too much data. Reducing write volume also helps to improve overall throughput on flash. InnoDB adopts “update in place” architecture. Even though updating just 1 record, an entire page where the row belongs becomes dirty, and the dirty page has to be written back to storage. On typical OLTP systems, modification unit (row) size is much smaller than I/O unit (page) size. This makes write amplification very high. I have published performance benchmarking of InnoDB, RocksDB and TokuDB, You can read about it here
Things to remember before tuning MyRocks:
- Data loading limitations
- Limitation – Transaction must fit in memory:
- mysql > ALTER TABLE post_master ENGINE = RocksDB;
- Error 2013 (HY000): Lost connection to MySQL server during query.
- Higher memory consumption and eventually get killed by OOM killer
- mysql > ALTER TABLE post_master ENGINE = RocksDB;
- When loading data into MyRocks tables, there are two recommended session variables:
- SET session sql_log_bin=0;
- SET session rocksdb_bulk_load=1;
- Limitation – Transaction must fit in memory:
There are few interesting things to remember before bulk loading MyRocks and tuning the system variable rocksdb_bulk_load:
- Data being bulk loaded can never overlap with existing data in the table. It is always recommended to bulk data load into an empty table. But, The mode will allow loading some data into the table, doing other operations and then returning and bulk loading addition data if there is no overlap between what is loaded and what already exists.
- The data may not be visible until the bulk load mode is ended (i.e. the rocksdb_bulk_load is set to zero again). RocksDB stores data into “SST” (Sorted String Table) files and Until a particular SST has been added the data will not be visible to the rest of the system, thus issuing a SELECT on the table currently being bulk loaded will only show older data and will likely not show the most recently added rows. Ending the bulk load mode will cause the most recent SST file to be added. When bulk loading multiple tables, starting a new table will trigger the code to add the most recent SST file to the system — as a result, it is inadvisable to interleave INSERT statements to two or more tables during bulk load mode.
Configuring MyRocks for performance:
Character Sets:
- MyRocks works more optimal with case sensitive collations (latin1_bin, utf8_bin, binary)
Transaction
- Read Committed isolation level is recommended. MyRocks’s transaction isolation implementation is different from InnoDB, but close to PostgreSQL. Default tx isolation in PostgreSQL is Read Committed.
Compression
- Set kNoCompression (or kLZ4Compression) on L0-1 or L0-2
- In the bottommost level, using stronger compression algorithm (Zlib or ZSTD) is recommended.
- If using zlib compression, set kZlibCompression at the bottommost level (bottommost_compression).
- If using zlib compression, set compression level accordingly. The above example (compression_opts=-14:1:0) uses zlib compression level 1. If your application is not write intensive, setting (compression_opts=-14:6:0) will give better space savings (using zlib compression level 6).
- For other levels, set kLZ4Compression.
Data blocks, files and compactions
- Set level_compaction_dynamic_level_bytes=true
- Set proper rocksdb_block_size (default 4096). Larger block size will reduce space but increase CPU overhead because MyRocks has to uncompress many more bytes. There is a trade-off between space and CPU usage.
- Set rocksdb_max_open_files=-1. If setting greater than 0, RocksDB still uses table_cache, which will lock a mutex every time you access the file. I think you’ll see much greater benefit with -1 because then you will not need to go through LRUCache to get the table you need.
- Set reasonable rocksdb_max_background_jobs
- Set not small target_file_size_base (32MB is generally sufficient). Default is 4MB, which is generally too small and creates too many sst files. Too many sst files makes operations more difficult.
- Set Rate Limiter. Without rate limiter, compaction very often writes 300~500MB/s on pure flash, which may cause short stalls. On 4x MyRocks testing, 40MB/s rate limiter per instance gave pretty stable results (less than 200MB/s peak from iostat).
Bloom Filter
- Configure bloom filter and Prefix Extractor. Full Filter is recommended (Block based filter does not work for Get() + prefix bloom). Prefix extractor can be configured per column family and uses the first prefix_extractor bits as the key. If using one BIGINT column as a primary key, recommended bloom filter size is 12 (first 4 bytes are for internal index id + 8 byte BIGINT).
- Configure Memtable bloom filter. Memtable bloom filter is useful to reduce CPU usage, if you see high CPU usage at rocksdb::MemTable::KeyComparator. Size depends on Memtable size. Set memtable_prefix_bloom_bits=41943040 for 128MB Memtable (30/128M=4M keys * 10 bits per key).
Cache
- Do not set block_cache at rocksdb_default_cf_options (block_based_table_factory). If you do provide a block cache size on a default column family, the same cache is NOT reused for all such column families.
- Consider setting shared write buffer size (db_write_buffer_size)
- Consider using compaction_pri=kMinOverlappingRatio for writing less on compaction.
Reference Source: https://github.com/facebook/mysql-5.6/wiki/my.cnf-tuning
The post Tuning MyRocks for performance appeared first on The WebScale Database Infrastructure Operations Experts.
]]>The post Comparing TokuDB, RocksDB and InnoDB Performance on Intel(R) Xeon(R) Gold 6140 CPU appeared first on The WebScale Database Infrastructure Operations Experts.
]]>Monday, 6 August 2018
Performance Benchmarking of TokuDB, RocksDB and InnoDB on Intel(R) Xeon(R) Gold 6140 CPU
Hardware information
We have captured detailed information of the infrastructure (CPU, Diskand Memory) used for this benchmarking, This really helps anyone doing capacity planning / sizing of their database infrastructure.
CPU details (Intel(R) Xeon(R) Gold 6140 CPU @ 2.30GHz with 72 CPUs)
root@blr1p01-pfm-008:/home/t-minervadb# lscpu
Architecture:          x86_64
CPU op-mode(s):        32-bit, 64-bit
Byte Order:            Little Endian
CPU(s):                72
On-line CPU(s) list:   0-71
Thread(s) per core:    2
Core(s) per socket:    18
Socket(s):             2
NUMA node(s):          2
Vendor ID:             GenuineIntel
CPU family:            6
Model:                 85
Model name:            Intel(R) Xeon(R) Gold 6140 CPU @ 2.30GHz
Stepping:              4
CPU MHz:               1000.000
CPU max MHz:           2301.0000
CPU min MHz:           1000.0000
BogoMIPS:              4601.52
Virtualization:        VT-x
L1d cache:             32K
L1i cache:             32K
L2 cache:              1024K
L3 cache:              25344K
NUMA node0 CPU(s):     0-17,36-53
NUMA node1 CPU(s):     18-35,54-71
Flags:                 fpu vme de pse tsc msr pae mce cx8 apic sep mtrr pge mca cmov pat pse36 clflush dts acpi mmx fxsr sse sse2 ss ht tm pbe syscall nx pdpe1gb rdtscp lm constant_tsc art arch_perfmon pebs bts rep_good nopl xtopology nonstop_tsc aperfmperf eagerfpu pni pclmulqdq dtes64 monitor ds_cpl vmx smx est tm2 ssse3 sdbg fma cx16 xtpr pdcm pcid dca sse4_1 sse4_2 x2apic movbe popcnt tsc_deadline_timer aes xsave avx f16c rdrand lahf_lm abm 3dnowprefetch epb invpcid_single intel_pt spec_ctrl retpoline kaiser tpr_shadow vnmi flexpriority ept vpid fsgsbase tsc_adjust bmi1 hle avx2 smep bmi2 erms invpcid rtm cqm mpx avx512f rdseed adx smap clflushopt clwb avx512cd xsaveopt xsavec xgetbv1 cqm_llc cqm_occup_llc cqm_mbm_total cqm_mbm_local dtherm ida arat pln pts
Storage devices used for benchmarking (we used NVME SSD)
root@blr1p01-pfm-008:/home/t-minervadb# lsblk -io NAME,TYPE,SIZE,MOUNTPOINT,FSTYPE,MODEL
NAME        TYPE   SIZE MOUNTPOINT FSTYPE MODEL
sda         disk 446.1G                   LSI2208
|-sda1      part 438.7G /          ext4
`-sda2      part   7.5G [SWAP]     swap
nvme0n1     disk   2.9T /mnt       ext4   Micron_9200_MTFDHAL3T2TCU
nvme1n1     disk   2.9T                   Micron_9200_MTFDHAL3T2TCU
nvme2n1     disk   2.9T                   Micron_9200_MTFDHAL3T2TCU
nvme3n1     disk   2.9T                   Micron_9200_MTFDHAL3T2TCU
`-nvme3n1p1 part   128M
nvme4n1     disk   2.9T                   Micron_9200_MTFDHAL3T2TCU
`-nvme4n1p1 part   128M
nvme5n1     disk   2.9T                   Micron_9200_MTFDHAL3T2TCU
`-nvme5n1p1 part   128M
nvme6n1     disk   2.9T                   Micron_9200_MTFDHAL3T2TCU
`-nvme6n1p1 part   128M
nvme7n1     disk   2.9T                   Micron_9200_MTFDHAL3T2TCU
`-nvme7n1p1 part   128M
Memory
root@blr1p01-pfm-008:/home/t-minervadb# free
              total        used        free      shared  buff/cache   available
Mem:      527993080    33848440   480213336       18304    13931304   492519988
Swap:       7810044           0     7810044
root@blr1p01-pfm-008:/home/t-minervadb#
MySQL (we have used Percona Server 5.7.22-22 with InnoDB/XtraDB, TokuDB and RocksDB) configuration / system variables
We haven’t changed any of the system variables of TokuDB, RocksDB and InnoDB for performance:
TokuDB system variables
mysql> show variables like 'toku%';
+-----------------------------------------+-------------------------+
| Variable_name                           | Value                   |
+-----------------------------------------+-------------------------+
| tokudb_alter_print_error                | OFF                     |
| tokudb_analyze_delete_fraction          | 1.000000                |
| tokudb_analyze_in_background            | ON                      |
| tokudb_analyze_mode                     | TOKUDB_ANALYZE_STANDARD |
| tokudb_analyze_throttle                 | 0                       |
| tokudb_analyze_time                     | 5                       |
| tokudb_auto_analyze                     | 30                      |
| tokudb_block_size                       | 4194304                 |
| tokudb_bulk_fetch                       | ON                      |
| tokudb_cache_size                       | 270332456960            |
| tokudb_cachetable_pool_threads          | 0                       |
| tokudb_cardinality_scale_percent        | 100                     |
| tokudb_check_jemalloc                   | ON                      |
| tokudb_checkpoint_lock                  | OFF                     |
| tokudb_checkpoint_on_flush_logs         | OFF                     |
| tokudb_checkpoint_pool_threads          | 0                       |
| tokudb_checkpointing_period             | 60                      |
| tokudb_cleaner_iterations               | 5                       |
| tokudb_cleaner_period                   | 1                       |
| tokudb_client_pool_threads              | 0                       |
| tokudb_commit_sync                      | ON                      |
| tokudb_compress_buffers_before_eviction | ON                      |
| tokudb_create_index_online              | ON                      |
| tokudb_data_dir                         |                         |
| tokudb_debug                            | 0                       |
| tokudb_dir_cmd                          |                         |
| tokudb_dir_cmd_last_error               | 0                       |
| tokudb_dir_cmd_last_error_string        |                         |
| tokudb_dir_per_db                       | ON                      |
| tokudb_directio                         | OFF                     |
| tokudb_disable_hot_alter                | OFF                     |
| tokudb_disable_prefetching              | OFF                     |
| tokudb_disable_slow_alter               | OFF                     |
| tokudb_empty_scan                       | rl                      |
| tokudb_enable_fast_update               | OFF                     |
| tokudb_enable_fast_upsert               | OFF                     |
| tokudb_enable_partial_eviction          | ON                      |
| tokudb_fanout                           | 16                      |
| tokudb_fs_reserve_percent               | 5                       |
| tokudb_fsync_log_period                 | 0                       |
| tokudb_hide_default_row_format          | ON                      |
| tokudb_killed_time                      | 4000                    |
| tokudb_last_lock_timeout                |                         |
| tokudb_load_save_space                  | ON                      |
| tokudb_loader_memory_size               | 100000000               |
| tokudb_lock_timeout                     | 4000                    |
| tokudb_lock_timeout_debug               | 1                       |
| tokudb_log_dir                          |                         |
| tokudb_max_lock_memory                  | 33791557120             |
| tokudb_optimize_index_fraction          | 1.000000                |
| tokudb_optimize_index_name              |                         |
| tokudb_optimize_throttle                | 0                       |
| tokudb_prelock_empty                    | ON                      |
| tokudb_read_block_size                  | 65536                   |
| tokudb_read_buf_size                    | 131072                  |
| tokudb_read_status_frequency            | 10000                   |
| tokudb_row_format                       | tokudb_zlib             |
| tokudb_rpl_check_readonly               | ON                      |
| tokudb_rpl_lookup_rows                  | ON                      |
| tokudb_rpl_lookup_rows_delay            | 0                       |
| tokudb_rpl_unique_checks                | ON                      |
| tokudb_rpl_unique_checks_delay          | 0                       |
| tokudb_strip_frm_data                   | OFF                     |
| tokudb_support_xa                       | ON                      |
| tokudb_tmp_dir                          |                         |
| tokudb_version                          | 5.7.22-22               |
| tokudb_write_status_frequency           | 1000                    |
+-----------------------------------------+-------------------------+
67 rows in set (0.01 sec)
RocksDB system variables
mysql> show variables like 'rocks%'; +-------------------------------------------------+--------------------------------------------------------------------+ | Variable_name | Value | +-------------------------------------------------+--------------------------------------------------------------------+ | rocksdb_access_hint_on_compaction_start | 1 | | rocksdb_advise_random_on_open | ON | | rocksdb_allow_concurrent_memtable_write | OFF | | rocksdb_allow_mmap_reads | OFF | | rocksdb_allow_mmap_writes | OFF | | rocksdb_allow_to_start_after_corruption | OFF | | rocksdb_block_cache_size | 536870912 | | rocksdb_block_restart_interval | 16 | | rocksdb_block_size | 4096 | | rocksdb_block_size_deviation | 10 | | rocksdb_bulk_load | OFF | | rocksdb_bulk_load_allow_unsorted | OFF | | rocksdb_bulk_load_size | 1000 | | rocksdb_bytes_per_sync | 0 | | rocksdb_cache_index_and_filter_blocks | ON | | rocksdb_checksums_pct | 100 | | rocksdb_collect_sst_properties | ON | | rocksdb_commit_in_the_middle | OFF | | rocksdb_compact_cf | | | rocksdb_compaction_readahead_size | 0 | | rocksdb_compaction_sequential_deletes | 0 | | rocksdb_compaction_sequential_deletes_count_sd | OFF | | rocksdb_compaction_sequential_deletes_file_size | 0 | | rocksdb_compaction_sequential_deletes_window | 0 | | rocksdb_concurrent_prepare | ON | | rocksdb_create_checkpoint | | | rocksdb_create_if_missing | ON | | rocksdb_create_missing_column_families | OFF | | rocksdb_datadir | ./.rocksdb | | rocksdb_db_write_buffer_size | 0 | | rocksdb_deadlock_detect | OFF | | rocksdb_deadlock_detect_depth | 50 | | rocksdb_debug_optimizer_no_zero_cardinality | ON | | rocksdb_debug_ttl_ignore_pk | OFF | | rocksdb_debug_ttl_read_filter_ts | 0 | | rocksdb_debug_ttl_rec_ts | 0 | | rocksdb_debug_ttl_snapshot_ts | 0 | | rocksdb_default_cf_options | compression=kLZ4Compression;bottommost_compression=kLZ4Compression | | rocksdb_delayed_write_rate | 0 | | rocksdb_delete_obsolete_files_period_micros | 21600000000 | | rocksdb_enable_bulk_load_api | ON | | rocksdb_enable_thread_tracking | ON | | rocksdb_enable_ttl | ON | | rocksdb_enable_ttl_read_filtering | ON | | rocksdb_enable_write_thread_adaptive_yield | OFF | | rocksdb_error_if_exists | OFF | | rocksdb_flush_log_at_trx_commit | 1 | | rocksdb_force_compute_memtable_stats | ON | | rocksdb_force_compute_memtable_stats_cachetime | 60000000 | | rocksdb_force_flush_memtable_and_lzero_now | OFF | | rocksdb_force_flush_memtable_now | OFF | | rocksdb_force_index_records_in_range | 0 | | rocksdb_hash_index_allow_collision | ON | | rocksdb_ignore_unknown_options | ON | | rocksdb_index_type | kBinarySearch | | rocksdb_info_log_level | error_level | | rocksdb_is_fd_close_on_exec | ON | | rocksdb_keep_log_file_num | 1000 | | rocksdb_large_prefix | OFF | | rocksdb_lock_scanned_rows | OFF | | rocksdb_lock_wait_timeout | 1 | | rocksdb_log_file_time_to_roll | 0 | | rocksdb_manifest_preallocation_size | 4194304 | | rocksdb_manual_wal_flush | ON | | rocksdb_max_background_jobs | 2 | | rocksdb_max_latest_deadlocks | 5 | | rocksdb_max_log_file_size | 0 | | rocksdb_max_manifest_file_size | 18446744073709551615 | | rocksdb_max_open_files | 512 | | rocksdb_max_row_locks | 1048576 | | rocksdb_max_subcompactions | 1 | | rocksdb_max_total_wal_size | 0 | | rocksdb_merge_buf_size | 67108864 | | rocksdb_merge_combine_read_size | 1073741824 | | rocksdb_merge_tmp_file_removal_delay_ms | 0 | | rocksdb_new_table_reader_for_compaction_inputs | OFF | | rocksdb_no_block_cache | OFF | | rocksdb_override_cf_options | | | rocksdb_paranoid_checks | ON | | rocksdb_pause_background_work | OFF | | rocksdb_perf_context_level | 0 | | rocksdb_persistent_cache_path | | | rocksdb_persistent_cache_size_mb | 0 | | rocksdb_pin_l0_filter_and_index_blocks_in_cache | ON | | rocksdb_print_snapshot_conflict_queries | OFF | | rocksdb_rate_limiter_bytes_per_sec | 0 | | rocksdb_read_free_rpl_tables | | | rocksdb_records_in_range | 0 | | rocksdb_reset_stats | OFF | | rocksdb_rpl_skip_tx_api | OFF | | rocksdb_seconds_between_stat_computes | 3600 | | rocksdb_signal_drop_index_thread | OFF | | rocksdb_sim_cache_size | 0 | | rocksdb_skip_bloom_filter_on_read | OFF | | rocksdb_skip_fill_cache | OFF | | rocksdb_sst_mgr_rate_bytes_per_sec | 0 | | rocksdb_stats_dump_period_sec | 600 | | rocksdb_store_row_debug_checksums | OFF | | rocksdb_strict_collation_check | ON | | rocksdb_strict_collation_exceptions | | | rocksdb_table_cache_numshardbits | 6 | | rocksdb_table_stats_sampling_pct | 10 | | rocksdb_tmpdir | | | rocksdb_trace_sst_api | OFF | | rocksdb_two_write_queues | ON | | rocksdb_unsafe_for_binlog | OFF | | rocksdb_update_cf_options | | | rocksdb_use_adaptive_mutex | OFF | | rocksdb_use_direct_io_for_flush_and_compaction | OFF | | rocksdb_use_direct_reads | OFF | | rocksdb_use_fsync | OFF | | rocksdb_validate_tables | 1 | | rocksdb_verify_row_debug_checksums | OFF | | rocksdb_wal_bytes_per_sync | 0 | | rocksdb_wal_dir | | | rocksdb_wal_recovery_mode | 1 | | rocksdb_wal_size_limit_mb | 0 | | rocksdb_wal_ttl_seconds | 0 | | rocksdb_whole_key_filtering | ON | | rocksdb_write_batch_max_bytes | 0 | | rocksdb_write_disable_wal | OFF | | rocksdb_write_ignore_missing_column_families | OFF | +-------------------------------------------------+--------------------------------------------------------------------+ 122 rows in set (0.00 sec)
InnoDB system variables
mysql> show variables like 'innod%'; +-------------------------------------------+------------------------+ | Variable_name | Value | +-------------------------------------------+------------------------+ | innodb_adaptive_flushing | ON | | innodb_adaptive_flushing_lwm | 10 | | innodb_adaptive_hash_index | ON | | innodb_adaptive_hash_index_parts | 8 | | innodb_adaptive_max_sleep_delay | 150000 | | innodb_api_bk_commit_interval | 5 | | innodb_api_disable_rowlock | OFF | | innodb_api_enable_binlog | OFF | | innodb_api_enable_mdl | OFF | | innodb_api_trx_level | 0 | | innodb_autoextend_increment | 64 | | innodb_autoinc_lock_mode | 1 | | innodb_buffer_pool_chunk_size | 134217728 | | innodb_buffer_pool_dump_at_shutdown | ON | | innodb_buffer_pool_dump_now | OFF | | innodb_buffer_pool_dump_pct | 25 | | innodb_buffer_pool_filename | ib_buffer_pool | | innodb_buffer_pool_instances | 1 | | innodb_buffer_pool_load_abort | OFF | | innodb_buffer_pool_load_at_startup | ON | | innodb_buffer_pool_load_now | OFF | | innodb_buffer_pool_size | 134217728 | | innodb_change_buffer_max_size | 25 | | innodb_change_buffering | all | | innodb_checksum_algorithm | crc32 | | innodb_checksums | ON | | innodb_cleaner_lsn_age_factor | high_checkpoint | | innodb_cmp_per_index_enabled | OFF | | innodb_commit_concurrency | 0 | | innodb_compressed_columns_threshold | 96 | | innodb_compressed_columns_zip_level | 6 | | innodb_compression_failure_threshold_pct | 5 | | innodb_compression_level | 6 | | innodb_compression_pad_pct_max | 50 | | innodb_concurrency_tickets | 5000 | | innodb_corrupt_table_action | assert | | innodb_data_file_path | ibdata1:12M:autoextend | | innodb_data_home_dir | | | innodb_deadlock_detect | ON | | innodb_default_row_format | dynamic | | innodb_disable_sort_file_cache | OFF | | innodb_doublewrite | ON | | innodb_empty_free_list_algorithm | backoff | | innodb_encrypt_online_alter_logs | OFF | | innodb_encrypt_tables | OFF | | innodb_fast_shutdown | 1 | | innodb_file_format | Barracuda | | innodb_file_format_check | ON | | innodb_file_format_max | Barracuda | | innodb_file_per_table | ON | | innodb_fill_factor | 100 | | innodb_flush_log_at_timeout | 1 | | innodb_flush_log_at_trx_commit | 1 | | innodb_flush_method | | | innodb_flush_neighbors | 1 | | innodb_flush_sync | ON | | innodb_flushing_avg_loops | 30 | | innodb_force_load_corrupted | OFF | | innodb_force_recovery | 0 | | innodb_ft_aux_table | | | innodb_ft_cache_size | 8000000 | | innodb_ft_enable_diag_print | OFF | | innodb_ft_enable_stopword | ON | | innodb_ft_ignore_stopwords | OFF | | innodb_ft_max_token_size | 84 | | innodb_ft_min_token_size | 3 | | innodb_ft_num_word_optimize | 2000 | | innodb_ft_result_cache_limit | 2000000000 | | innodb_ft_server_stopword_table | | | innodb_ft_sort_pll_degree | 2 | | innodb_ft_total_cache_size | 640000000 | | innodb_ft_user_stopword_table | | | innodb_io_capacity | 200 | | innodb_io_capacity_max | 2000 | | innodb_kill_idle_transaction | 0 | | innodb_large_prefix | ON | | innodb_lock_wait_timeout | 50 | | innodb_locks_unsafe_for_binlog | OFF | | innodb_log_buffer_size | 16777216 | | innodb_log_checksums | ON | | innodb_log_compressed_pages | ON | | innodb_log_file_size | 50331648 | | innodb_log_files_in_group | 2 | | innodb_log_group_home_dir | ./ | | innodb_log_write_ahead_size | 8192 | | innodb_lru_scan_depth | 1024 | | innodb_max_bitmap_file_size | 104857600 | | innodb_max_changed_pages | 1000000 | | innodb_max_dirty_pages_pct | 75.000000 | | innodb_max_dirty_pages_pct_lwm | 0.000000 | | innodb_max_purge_lag | 0 | | innodb_max_purge_lag_delay | 0 | | innodb_max_undo_log_size | 1073741824 | | innodb_monitor_disable | | | innodb_monitor_enable | | | innodb_monitor_reset | | | innodb_monitor_reset_all | | | innodb_numa_interleave | OFF | | innodb_old_blocks_pct | 37 | | innodb_old_blocks_time | 1000 | | innodb_online_alter_log_max_size | 134217728 | | innodb_open_files | 431 | | innodb_optimize_fulltext_only | OFF | | innodb_page_cleaners | 1 | | innodb_page_size | 16384 | | innodb_parallel_doublewrite_path | xb_doublewrite | | innodb_print_all_deadlocks | OFF | | innodb_print_lock_wait_timeout_info | OFF | | innodb_purge_batch_size | 300 | | innodb_purge_rseg_truncate_frequency | 128 | | innodb_purge_threads | 4 | | innodb_random_read_ahead | OFF | | innodb_read_ahead_threshold | 56 | | innodb_read_io_threads | 4 | | innodb_read_only | OFF | | innodb_replication_delay | 0 | | innodb_rollback_on_timeout | OFF | | innodb_rollback_segments | 128 | | innodb_show_locks_held | 10 | | innodb_show_verbose_locks | 0 | | innodb_sort_buffer_size | 1048576 | | innodb_spin_wait_delay | 6 | | innodb_stats_auto_recalc | ON | | innodb_stats_include_delete_marked | OFF | | innodb_stats_method | nulls_equal | | innodb_stats_on_metadata | OFF | | innodb_stats_persistent | ON | | innodb_stats_persistent_sample_pages | 20 | | innodb_stats_sample_pages | 8 | | innodb_stats_transient_sample_pages | 8 | | innodb_status_output | OFF | | innodb_status_output_locks | OFF | | innodb_strict_mode | ON | | innodb_support_xa | ON | | innodb_sync_array_size | 1 | | innodb_sync_spin_loops | 30 | | innodb_table_locks | ON | | innodb_temp_data_file_path | ibtmp1:12M:autoextend | | innodb_temp_tablespace_encrypt | OFF | | innodb_thread_concurrency | 0 | | innodb_thread_sleep_delay | 10000 | | innodb_tmpdir | | | innodb_track_changed_pages | OFF | | innodb_undo_directory | ./ | | innodb_undo_log_truncate | OFF | | innodb_undo_logs | 128 | | innodb_undo_tablespaces | 0 | | innodb_use_global_flush_log_at_trx_commit | ON | | innodb_use_native_aio | ON | | innodb_version | 5.7.22-22 | | innodb_write_io_threads | 4 | +-------------------------------------------+------------------------+ 151 rows in set (0.00 sec)
Benchmarking OLTP INSERT performance on TokuDB, RocksDB and InnoDB
TokuDB OLTP INSERT performance benchmarking using Sysbench
Building Database Infrastructure for benchmarking (Percona Server with TokuDB) with INSERT operations:
root@blr1p01-pfm-008:/usr/share/sysbench# sysbench oltp_insert.lua --threads=100 --time=1800 --table-size=100000000  --db-driver=mysql --mysql-db=test --mysql-socket=/var/run/mysqld/mysqld.sock --mysql-user=root --mysql-password=USEYOURPASSWORD --mysql-storage-engine=tokudb prepare
sysbench 1.0.15 (using bundled LuaJIT 2.1.0-beta2)

Initializing worker threads...

Creating table 'sbtest1'...
Inserting 100000000 records into 'sbtest1'
Creating a secondary index on 'sbtest1'...
“sbtest1” schema structure ( TokuDB storage engine with 100M rows)
mysql> show table status like 'sbtest1%'\G;
*************************** 1. row ***************************
Name: sbtest1
Engine: TokuDB
Version: 10
Row_format: tokudb_zlib
Rows: 100000000
Avg_row_length: 189
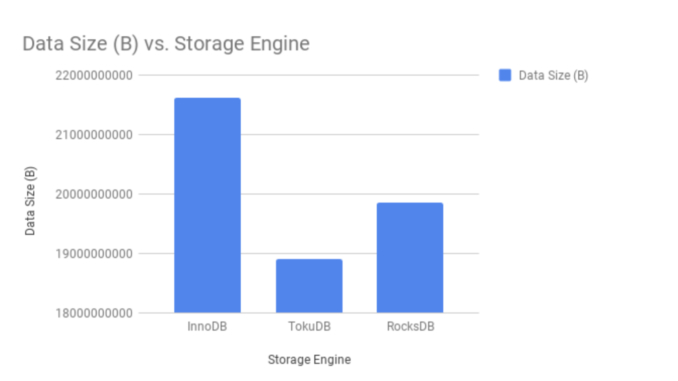
Data_length: 18900000000
Max_data_length: 9223372036854775807
Index_length: 860808942
Data_free: 18446744065817975570
Auto_increment: 100000001
Create_time: 2018-08-03 23:03:35
Update_time: 2018-08-03 23:23:51
Check_time: NULL
Collation: latin1_swedish_ci
Checksum: NULL
Create_options:
Comment:
1 row in set (0.00 sec)
ERROR:
No query specified
Benchmarking TokuDB (with 100M rows) INSERT using Sysbench (oltp_insert.lua)
root@blr1p01-pfm-008:/usr/share/sysbench# sysbench oltp_insert.lua --threads=100 --time=1800 --table-size=100000000 --db-driver=mysql --mysql-db=test --mysql-socket=/var/run/mysqld/mysqld.sock --mysql-user=root --mysql-password=USEYOURPASSWORD --mysql-storage-engine=tokudb run
Monitoring the benchmarking
mysql> show full processlist\G;
*************************** 1. row ***************************
           Id: 106
         User: root
         Host: localhost
           db: test
      Command: Query
         Time: 0
        State: update
         Info: INSERT INTO sbtest1 (id, k, c, pad) VALUES (0, 49754892, '62632931051-58961919101-49940198850-21078424594-43546312816-91483171956-63147821178-73320074434-75390450161-85244468625', '72758152721-79346997448-32739052749-09956023061-33461120469')
    Rows_sent: 0
Rows_examined: 0
*************************** 2. row ***************************
           Id: 107
         User: root
         Host: localhost
           db: test
      Command: Query
         Time: 0
        State: update
         Info: INSERT INTO sbtest1 (id, k, c, pad) VALUES (0, 38299901, '73492364485-17164009439-13897782190-82384134069-56725118845-05888552123-04466761496-73013947541-76946111000-82170241506', '57825848902-56599269429-55553620227-85565361679-86108748354')
    Rows_sent: 0
Rows_examined: 0
*************************** 3. row ***************************
           Id: 108
         User: root
         Host: localhost
           db: test
      Command: Query
         Time: 0
        State: closing tables
         Info: INSERT INTO sbtest1 (id, k, c, pad) VALUES (0, 50461359, '82489034494-43306780333-31830745333-81619557910-15670574031-38606658735-35015531633-82686313168-29930813640-55800112343', '98734612239-15166737116-32153746057-36526618555-01917900606')
    Rows_sent: 0
Rows_examined: 0
*************************** 4. row ***************************
           Id: 109
         User: root
         Host: localhost
           db: test
      Command: Query
         Time: 0
        State: update
         Info: INSERT INTO sbtest1 (id, k, c, pad) VALUES (0, 50305368, '26004165285-71866035101-19429620467-21730816230-28360163045-85578016857-31504027785-22011080750-52188150293-29047779256', '40086488864-24563838334-16649832399-35567929449-35827527600')
    Rows_sent: 0
Rows_examined: 0

*************************** 98. row ***************************
           Id: 203
         User: root
         Host: localhost
           db: test
      Command: Query
         Time: 0
        State: update
         Info: INSERT INTO sbtest1 (id, k, c, pad) VALUES (0, 50008367, '08590860349-55330969614-92736003669-70093680275-08791372163-86879862146-65906035624-31616634007-39285699730-30091204027', '03546380555-08125979095-56416888610-57364610871-45465441885')
    Rows_sent: 0
Rows_examined: 0
*************************** 99. row ***************************
           Id: 204
         User: root
         Host: localhost
           db: test
      Command: Query
         Time: 0
        State: update
         Info: INSERT INTO sbtest1 (id, k, c, pad) VALUES (0, 54541565, '62284574810-41408816172-84693515960-17097326417-15199773762-35816031089-51785557714-03836189148-75055812047-57404275889', '89419445215-23758954221-31182195029-89303506158-96423989766')
    Rows_sent: 0
Rows_examined: 0
*************************** 100. row ***************************
           Id: 205
         User: root
         Host: localhost
           db: test
      Command: Query
         Time: 0
        State: update
         Info: INSERT INTO sbtest1 (id, k, c, pad) VALUES (0, 49961655, '04968809340-71773840704-69257717063-97968863839-17701720758-38065324563-11587467460-13905955489-57279753705-77707929689', '02758577051-41889982054-46749141829-07683639044-92209230468')
    Rows_sent: 0
Rows_examined: 0
*************************** 101. row ***************************
           Id: 206
         User: root
         Host: localhost
           db: NULL
      Command: Query
         Time: 0
        State: starting
         Info: show full processlist
    Rows_sent: 0
Rows_examined: 0
101 rows in set (0.00 sec)

ERROR:
No query specified
Result
When interpreting the benchmarking results, I look for transactions / queries per second (in this case, it is 10048.74 per sec.) and average latency (9.95 ms.) ,
root@blr1p01-pfm-008:/usr/share/sysbench# sysbench oltp_insert.lua --threads=100 --time=1800 --table-size=100000000 --db-driver=mysql --mysql-db=test --mysql-socket=/var/run/mysqld/mysqld.sock --mysql-user=root --mysql-password=USEYOURPASSWORD --mysql-storage-engine=tokudb run
sysbench 1.0.15 (using bundled LuaJIT 2.1.0-beta2)
Running the test with following options:
Number of threads: 100
Initializing random number generator from current time
Initializing worker threads...
Threads started!
SQL statistics:
queries performed:
read: 0
write: 18088064
other: 0
total: 18088064
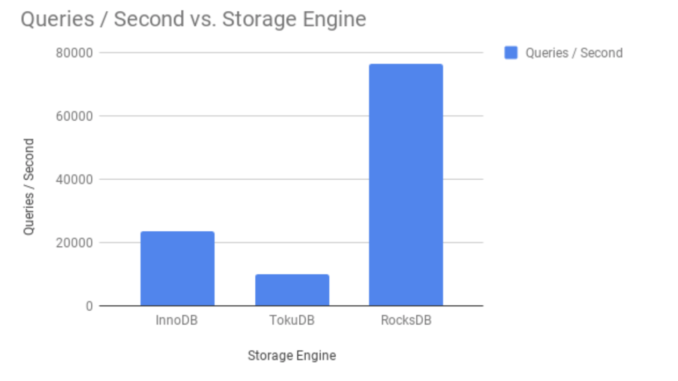
transactions: 18088064 (10048.74 per sec.)
queries: 18088064 (10048.74 per sec.)
ignored errors: 0 (0.00 per sec.)
reconnects: 0 (0.00 per sec.)
General statistics:
total time: 1800.0299s
total number of events: 18088064
Latency (ms):
min: 0.24
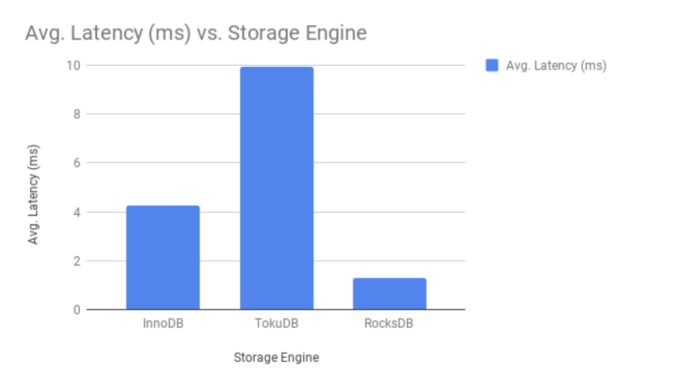
avg: 9.95
max: 210.80
95th percentile: 22.28
sum: 179905047.86
Threads fairness:
events (avg/stddev): 180880.6400/323.88
execution time (avg/stddev): 1799.0505/0.01
Benchmarking OLTP INSERT performance on RocksDB using Sysbench
Step 1 – Prepare data
sysbench oltp_insert.lua --threads=100 --time=1800 --table-size=100000000 --db-driver=mysql --mysql-db=test --mysql-socket=/var/run/mysqld/mysqld.sock --mysql-user=root --mysql-password=USEYOURPASSWORD --mysql-storage-engine=rocksdb prepare
Step 2 – “sbtest1” schema structure ( RocksDB storage engine with 100M rows)
mysql> show table status like 'sbtest1'\G;
*************************** 1. row ***************************
           Name: sbtest1
         Engine: ROCKSDB
        Version: 10
     Row_format: Fixed
           Rows: 100000000
 Avg_row_length: 198
    Data_length: 19855730417
Max_data_length: 0
   Index_length: 750521287
      Data_free: 0
 Auto_increment: 100000001
    Create_time: NULL
    Update_time: NULL
     Check_time: NULL
      Collation: latin1_swedish_ci
       Checksum: NULL
 Create_options:
        Comment:
1 row in set (0.01 sec)

ERROR:
No query specified
Step3 – Benchmarking OLTP INSERT performance on RocksDB
root@blr1p01-pfm-008:/usr/share/sysbench# sysbench oltp_insert.lua --threads=100 --time=1800 --table-size=100000000  --db-driver=mysql --mysql-db=test --mysql-socket=/var/run/mysqld/mysqld.sock --mysql-user=root --mysql-password=USEYOURPASSWORD --mysql-storage-engine=rocksdb run
sysbench 1.0.15 (using bundled LuaJIT 2.1.0-beta2)

Running the test with following options:
Number of threads: 100
Initializing random number generator from current time


Initializing worker threads...

Threads started!

SQL statistics:
    queries performed:
        read:                            0
        write:                           137298161
        other:                           0
        total:                           137298161
    transactions:                        137298161 (76275.15 per sec.)
    queries:                             137298161 (76275.15 per sec.)
    ignored errors:                      0      (0.00 per sec.)
    reconnects:                          0      (0.00 per sec.)

General statistics:
    total time:                          1800.0344s
    total number of events:              137298161

Latency (ms):
         min:                                    0.29
         avg:                                    1.31
         max:                                   66.32
         95th percentile:                        1.67
         sum:                            179465859.14

Threads fairness:
    events (avg/stddev):           1372981.6100/73.07
    execution time (avg/stddev):   1794.6586/0.02
Interpreting results
Transactions / Queries (per second) – 76275.15
Average latency (ms) – 1.31
Benchmarking OLTP INSERT performance on InnoDB using Sysbench
Step 1 – prepare data for benchmarking
root@blr1p01-pfm-008:/usr/share/sysbench# sysbench oltp_insert.lua --threads=100 --time=1800 --table-size=100000000  --db-driver=mysql --mysql-db=test --mysql-socket=/var/run/mysqld/mysqld.sock --mysql-user=root --mysql-password=USEYOURPASSWORD  prepare
sysbench 1.0.15 (using bundled LuaJIT 2.1.0-beta2)

Initializing worker threads...

Creating table 'sbtest1'...
Inserting 100000000 records into 'sbtest1'
Creating a secondary index on 'sbtest1'...
Step 2 – “sbtest1” schema structure ( InnoDB storage engine with 100M rows)
mysql> show table status like 'sbtest1%'\G;
*************************** 1. row ***************************
           Name: sbtest1
         Engine: InnoDB
        Version: 10
     Row_format: Dynamic
           Rows: 98682155
 Avg_row_length: 218
    Data_length: 21611151360
Max_data_length: 0
   Index_length: 0
      Data_free: 3145728
 Auto_increment: 100000001
    Create_time: 2018-08-04 17:14:04
    Update_time: 2018-08-04 17:11:01
     Check_time: NULL
      Collation: latin1_swedish_ci
       Checksum: NULL
 Create_options:
        Comment:
1 row in set (0.00 sec)

ERROR:
No query specified
Step3 – Benchmarking OLTP INSERT performance on InnoDB
root@blr1p01-pfm-008:/usr/share/sysbench# sysbench oltp_insert.lua --threads=100 --time=1800 --table-size=100000000  --db-driver=mysql --mysql-db=test --mysql-socket=/var/run/mysqld/mysqld.sock --mysql-user=root --mysql-password=USEYOURPASSWORD  run
sysbench 1.0.15 (using bundled LuaJIT 2.1.0-beta2)

Running the test with following options:
Number of threads: 100
Initializing random number generator from current time


Initializing worker threads...

Threads started!

SQL statistics:
    queries performed:
        read:                            0
        write:                           42243914
        other:                           0
        total:                           42243914
    transactions:                        42243914 (23468.40 per sec.)
    queries:                             42243914 (23468.40 per sec.)
    ignored errors:                      0      (0.00 per sec.)
    reconnects:                          0      (0.00 per sec.)

General statistics:
    total time:                          1800.0319s
    total number of events:              42243914

Latency (ms):
         min:                                    0.12
         avg:                                    4.26
         max:                                 1051.64
         95th percentile:                       21.50
         sum:                            179801087.85

Threads fairness:
    events (avg/stddev):           422439.1400/1171.09
    execution time (avg/stddev):   1798.0109/0.01
Interpreting results
Transactions / Queries (per second) – 23468.40
Average latency (ms) – 4.26
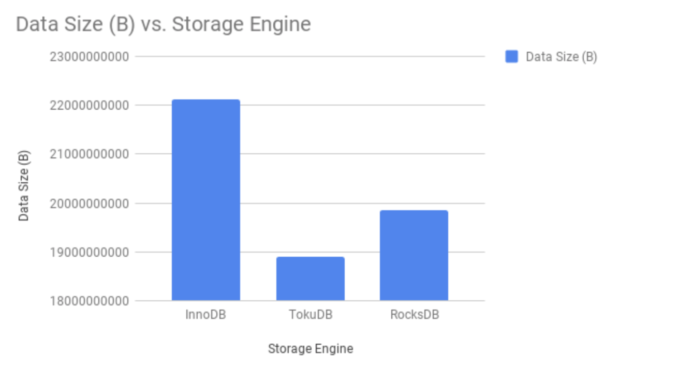
Graphical representation of OLTP INSERT performance in TokuDB, RocksDB and InnoDB:
Benchmarking OLTP READ-ONLY transactions performance on TokuDB, RocksDB and InnoDB
Benchmarking READ-ONLY OLTP transactions (100M records using oltp_read_only.lua) on TokuDB:
root@blr1p01-pfm-008:/usr/share/sysbench# sysbench oltp_read_only.lua --threads=100 --time=1800 --table-size=100000000 --db-driver=mysql --mysql-db=test --mysql-socket=/var/run/mysqld/mysqld.sock --mysql-storage-engine=tokudb --mysql-user=root --mysql-password=USEYOURPASSWORD prepare
Step 2- Confirm TokuDB schema is available with 100M records:
mysql> show table status like 'sbtest1%'\G;
*************************** 1. row ***************************
           Name: sbtest1
         Engine: TokuDB
        Version: 10
     Row_format: tokudb_zlib
           Rows: 100000000
 Avg_row_length: 189
    Data_length: 18900000000
Max_data_length: 9223372036854775807
   Index_length: 860426496
      Data_free: 18446744065835135232
 Auto_increment: 100000001
    Create_time: 2018-08-05 12:53:50
    Update_time: 2018-08-05 13:13:38
     Check_time: NULL
      Collation: latin1_swedish_ci
       Checksum: NULL
 Create_options:
        Comment:
1 row in set (0.00 sec)

ERROR:
No query specified
Step 3 – Benchmarking TokuDB OLTP READ-ONLY transaction performance:
root@blr1p01-pfm-008:/usr/share/sysbench# sysbench oltp_read_only.lua --threads=100 --time=1800 --table-size=100000000  --db-driver=mysql --mysql-db=test --mysql-socket=/var/run/mysqld/mysqld.sock --mysql-storage-engine=tokudb --mysql-user=root --mysql-password=USEYOURPASSWORD run
sysbench 1.0.15 (using bundled LuaJIT 2.1.0-beta2)

Running the test with following options:
Number of threads: 100
Initializing random number generator from current time


Initializing worker threads...

Threads started!

SQL statistics:
    queries performed:
        read:                            231960820
        write:                           0
        other:                           33137260
        total:                           265098080
    transactions:                        16568630 (9204.59 per sec.)
    queries:                             265098080 (147273.50 per sec.)
    ignored errors:                      0      (0.00 per sec.)
    reconnects:                          0      (0.00 per sec.)

General statistics:
    total time:                          1800.0348s
    total number of events:              16568630

Latency (ms):
         min:                                    1.71
         avg:                                   10.86
         max:                                   51.11
         95th percentile:                       13.22
         sum:                            179951191.99

Threads fairness:
    events (avg/stddev):           165686.3000/481.89
    execution time (avg/stddev):   1799.5119/0.01
Interpreting results
QPS (Queries per second) – 147273.50
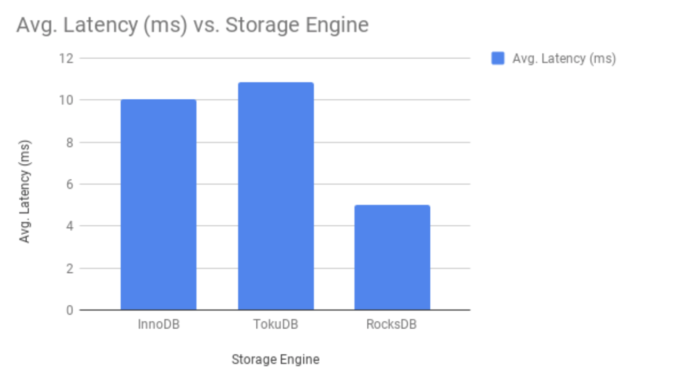
Average latency (ms) – 10.86
Benchmarking READ-ONLY OLTP transactions on RocksDB
Step 1- Build data(100M records using oltp_read_only.lua) for benchmarking:
root@blr1p01-pfm-008:/usr/share/sysbench# sysbench oltp_read_only.lua --threads=100 --time=1800 --table-size=100000000 --db-driver=mysql --mysql-db=test --mysql-socket=/var/run/mysqld/mysqld.sock --mysql-storage-engine=rocksdb --mysql-user=root --mysql-password=USEYOURPASSWORD prepare
Step 2- Confirm RocksDB schema is available with 100M records:
mysql> show table status like 'sbtest%'\G;
*************************** 1. row ***************************
           Name: sbtest1
         Engine: ROCKSDB
        Version: 10
     Row_format: Fixed
           Rows: 100000000
 Avg_row_length: 198
    Data_length: 19855730417
Max_data_length: 0
   Index_length: 750521333
      Data_free: 0
 Auto_increment: 100000001
    Create_time: NULL
    Update_time: NULL
     Check_time: NULL
      Collation: latin1_swedish_ci
       Checksum: NULL
 Create_options:
        Comment:
1 row in set (0.00 sec)

ERROR:
No query specified
Step 3 – Benchmarking RocksDB OLTP READ-ONLY transaction performance:
root@blr1p01-pfm-008:/usr/share/sysbench# sysbench oltp_read_only.lua --threads=100 --time=1800 --table-size=100000000  --db-driver=mysql --mysql-db=test --mysql-socket=/var/run/mysqld/mysqld.sock --mysql-storage-engine=rocksdb --mysql-user=root --mysql-password=USEYOURPASSWORD run
sysbench 1.0.15 (using bundled LuaJIT 2.1.0-beta2)

Running the test with following options:
Number of threads: 100
Initializing random number generator from current time


Initializing worker threads...

Threads started!

SQL statistics:
    queries performed:
        read:                            494461100
        write:                           0
        other:                           70637300
        total:                           565098400
    transactions:                        35318650 (19621.05 per sec.)
    queries:                             565098400 (313936.76 per sec.)
    ignored errors:                      0      (0.00 per sec.)
    reconnects:                          0      (0.00 per sec.)

General statistics:
    total time:                          1800.0349s
    total number of events:              35318650

Latency (ms):
         min:                                    1.80
         avg:                                    5.09
         max:                                  323.58
         95th percentile:                        7.70
         sum:                            179898262.01

Threads fairness:
    events (avg/stddev):           353186.5000/2619.22
    execution time (avg/stddev):   1798.9826/0.02
Interpreting results
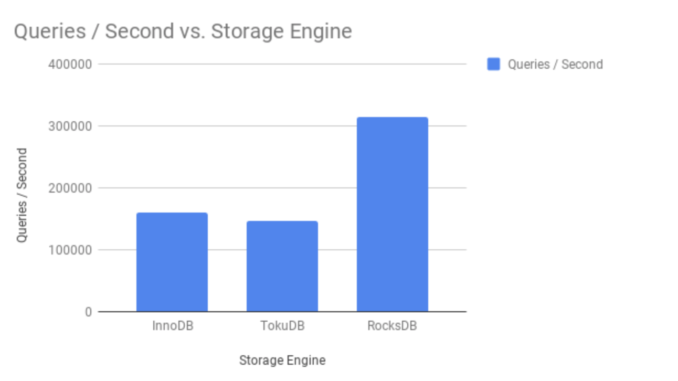
QPS (Queries per second) – 313936.76
Average latency (ms) – 5.09
Benchmarking READ-ONLY OLTP transactions on InnoDB
Step 1: Build data (100M records using oltp_read_only.lua) for benchmarking:
root@blr1p01-pfm-008:/usr/share/sysbench# sysbench oltp_read_only.lua --threads=100 --time=1800 --table-size=100000000 --db-driver=mysql --mysql-db=test --mysql-socket=/var/run/mysqld/mysqld.sock --mysql-user=root --mysql-password=USEYOURPASSWORD prepare
Step 2 – Step 2- Confirm InnoDB schema is available with 100M records:
mysql> show table status like 'sbtest1'\G;
*************************** 1. row ***************************
           Name: sbtest1
         Engine: InnoDB
        Version: 10
     Row_format: Dynamic
           Rows: 98650703
 Avg_row_length: 224
    Data_length: 22126002176
Max_data_length: 0
   Index_length: 0
      Data_free: 3145728
 Auto_increment: 100000001
    Create_time: 2018-08-05 17:20:48
    Update_time: 2018-08-05 17:18:19
     Check_time: NULL
      Collation: latin1_swedish_ci
       Checksum: NULL
 Create_options:
        Comment:
1 row in set (0.00 sec)

ERROR:
No query specified
Step 3 – Benchmarking InnoDB OLTP READ-ONLY transaction performance:
root@blr1p01-pfm-008:/usr/share/sysbench# sysbench oltp_read_only.lua --threads=100 --time=1800 --table-size=100000000  --db-driver=mysql --mysql-db=test --mysql-socket=/var/run/mysqld/mysqld.sock  --mysql-user=root --mysql-password=USEYOURPASSWORD run
sysbench 1.0.15 (using bundled LuaJIT 2.1.0-beta2)

Running the test with following options:
Number of threads: 100
Initializing random number generator from current time


Initializing worker threads...

Threads started!

SQL statistics:
    queries performed:
        read:                            251061874
        write:                           0
        other:                           35865982
        total:                           286927856
    transactions:                        17932991 (9962.59 per sec.)
    queries:                             286927856 (159401.44 per sec.)
    ignored errors:                      0      (0.00 per sec.)
    reconnects:                          0      (0.00 per sec.)

General statistics:
    total time:                          1800.0300s
    total number of events:              17932991

Latency (ms):
         min:                                    1.66
         avg:                                   10.03
         max:                                 1478.79
         95th percentile:                       33.12
         sum:                            179947481.25

Threads fairness:
    events (avg/stddev):           179329.9100/1283.20
    execution time (avg/stddev):   1799.4748/0.01
Interpreting results
QPS (Queries per second) – 159401.44
Average latency (ms) – 10.03
Graphical representation of OLTP READ-ONLY transactions performance in TokuDB, RocksDB and InnoDB:
Benchmarking OLTP READ-WRITE transactions performance on TokuDB, RocksDB and InnoDB
Benchmarking READ-WRITE OLTP transactions on TokuDB
Step 1: Build data (100M records using oltp_read_write.lua) for benchmarking:
root@blr1p01-pfm-008:/usr/share/sysbench# sysbench oltp_read_write.lua --threads=100 --time=1800 --table-size=100000000 --db-driver=mysql --mysql-db=test --mysql-socket=/var/run/mysqld/mysqld.sock --mysql-storage-engine=tokudb --mysql-user=root --mysql-password=USEYOURPASSWORD prepare
Step 2- Confirm TokuDB schema is available with 100M records:
mysql> show table status like 'sbtest1%'\G;
*************************** 1. row ***************************
           Name: sbtest1
         Engine: TokuDB
        Version: 10
     Row_format: tokudb_zlib
           Rows: 100000000
 Avg_row_length: 189
    Data_length: 18900000000
Max_data_length: 9223372036854775807
   Index_length: 860645232
      Data_free: 18446744065834916496
 Auto_increment: 100000001
    Create_time: 2018-08-05 22:41:43
    Update_time: 2018-08-05 23:01:00
     Check_time: NULL
      Collation: latin1_swedish_ci
       Checksum: NULL
 Create_options:
        Comment:
1 row in set (0.00 sec)

ERROR:
No query specified
Step3 – Benchmarking OLTP READ-WRITE performance on TokuDB:
root@blr1p01-pfm-008:/usr/share/sysbench# sysbench oltp_read_write.lua --threads=100 --time=1800 --table-size=100000000  --db-driver=mysql --mysql-db=test --mysql-socket=/var/run/mysqld/mysqld.sock --mysql-storage-engine=tokudb --mysql-user=root --mysql-password=USEYOURPASSWORD run
sysbench 1.0.15 (using bundled LuaJIT 2.1.0-beta2)

Running the test with following options:
Number of threads: 100
Initializing random number generator from current time


Initializing worker threads...

Threads started!

SQL statistics:
    queries performed:
        read:                            19844342
        write:                           5669812
        other:                           2834906
        total:                           28349060
    transactions:                        1417453 (787.44 per sec.)
    queries:                             28349060 (15748.86 per sec.)
    ignored errors:                      0      (0.00 per sec.)
    reconnects:                          0      (0.00 per sec.)

General statistics:
    total time:                          1800.0668s
    total number of events:              1417453

Latency (ms):
         min:                                    3.90
         avg:                                  126.99
         max:                                  426.41
         95th percentile:                      147.61
         sum:                            179997357.31

Threads fairness:
    events (avg/stddev):           14174.5300/7.61
    execution time (avg/stddev):   1799.9736/0.02
Interpreting results
QPS (Queries per second) – 15748.86
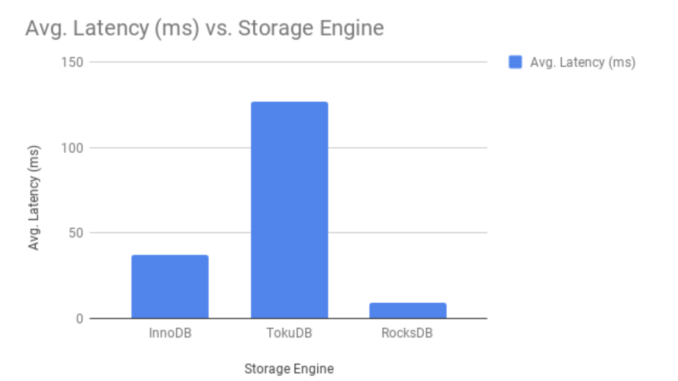
Average latency (ms) – 126.99
Benchmarking READ-WRITE OLTP transactions on RocksDB
Step 1: Build data (100M records using oltp_read_write.lua) for benchmarking:
root@blr1p01-pfm-008:/usr/share/sysbench# sysbench oltp_read_write.lua --threads=100 --time=1800 --table-size=100000000 --db-driver=mysql --mysql-db=test --mysql-socket=/var/run/mysqld/mysqld.sock --mysql-storage-engine=rocksdb --mysql-user=root --mysql-password=USEYOURPASSWORD prepare
Step 2- Confirm RocksDB schema is available with 100M records:
mysql> show table status like 'sbtest1%'\G;
*************************** 1. row ***************************
           Name: sbtest1
         Engine: ROCKSDB
        Version: 10
     Row_format: Fixed
           Rows: 100000000
 Avg_row_length: 198
    Data_length: 19855694789
Max_data_length: 0
   Index_length: 750521319
      Data_free: 0
 Auto_increment: 100000001
    Create_time: NULL
    Update_time: NULL
     Check_time: NULL
      Collation: latin1_swedish_ci
       Checksum: NULL
 Create_options:
        Comment:
1 row in set (0.00 sec)

ERROR:
No query specified
Step3 – Benchmarking OLTP READ-WRITE performance on RocksDB:
root@blr1p01-pfm-008:/usr/share/sysbench# sysbench oltp_read_write.lua --threads=100 --time=1800 --table-size=100000000  --db-driver=mysql --mysql-db=test --mysql-socket=/var/run/mysqld/mysqld.sock --mysql-storage-engine=rocksdb --mysql-user=root --mysql-password=USEYOURPASSWORD run
sysbench 1.0.15 (using bundled LuaJIT 2.1.0-beta2)

Running the test with following options:
Number of threads: 100
Initializing random number generator from current time


Initializing worker threads...

Threads started!

SQL statistics:
    queries performed:
        read:                            286818014
        write:                           81910410
        other:                           40961372
        total:                           409689796
    transactions:                        20474371 (11374.39 per sec.)
    queries:                             409689796 (227600.23 per sec.)
    ignored errors:                      12630  (7.02 per sec.)
    reconnects:                          0      (0.00 per sec.)

General statistics:
    total time:                          1800.0375s
    total number of events:              20474371

Latency (ms):
         min:                                    2.50
         avg:                                    8.79
         max:                                  402.68
         95th percentile:                       12.75
         sum:                            179935638.52

Threads fairness:
    events (avg/stddev):           204743.7100/2264.14
    execution time (avg/stddev):   1799.3564/0.01
Interpreting results
QPS (Queries per second) – 227600.23
Average latency (ms) – 8.79
Benchmarking READ-WRITE OLTP transactions on InnoDB
Step 1: Build data (100M records using oltp_read_write.lua) for benchmarking:
root@blr1p01-pfm-008:/usr/share/sysbench# sysbench oltp_read_write.lua --threads=100 --time=1800 --table-size=100000000 --db-driver=mysql --mysql-db=test --mysql-socket=/var/run/mysqld/mysqld.sock --mysql-user=root --mysql-password=USEYOURPASSWORD prepare
Step 2- Confirm InnoDB schema is available with 100M records:
mysql> show table status like 'sbtest1%'\G;
*************************** 1. row ***************************
           Name: sbtest1
         Engine: InnoDB
        Version: 10
     Row_format: Dynamic
           Rows: 100000000
 Avg_row_length: 221
    Data_length: 21885878272
Max_data_length: 0
   Index_length: 0
      Data_free: 6291456
 Auto_increment: 100000001
    Create_time: 2018-08-06 10:24:54
    Update_time: 2018-08-06 10:31:53
     Check_time: NULL
      Collation: latin1_swedish_ci
       Checksum: NULL
 Create_options:
        Comment:
1 row in set (0.00 sec)

ERROR:
No query specified
Step3 – Benchmarking OLTP READ-WRITE performance on InnoDB:
root@blr1p01-pfm-008:/usr/share/sysbench# sysbench oltp_read_write.lua --threads=100 --time=1800 --table-size=100000000 --db-driver=mysql --mysql-db=test --mysql-socket=/var/run/mysqld/mysqld.sock --mysql-user=root --mysql-password=USEYOURPASSWORD run
sysbench 1.0.15 (using bundled LuaJIT 2.1.0-beta2)

Running the test with following options:
Number of threads: 100
Initializing random number generator from current time


Initializing worker threads...

Threads started!

SQL statistics:
    queries performed:
        read:                            67383470
        write:                           19251931
        other:                           9626043
        total:                           96261444
    transactions:                        4812938 (2673.78 per sec.)
    queries:                             96261444 (53477.03 per sec.)
    ignored errors:                      167    (0.09 per sec.)
    reconnects:                          0      (0.00 per sec.)

General statistics:
    total time:                          1800.0491s
    total number of events:              4812938

Latency (ms):
         min:                                    2.28
         avg:                                   37.40
         max:                                 1177.78
         95th percentile:                       71.83
         sum:                            179981855.37

Threads fairness:
    events (avg/stddev):           48129.3800/110.24
    execution time (avg/stddev):   1799.8186/0.00
Interpreting results
QPS (Queries per second) – 53477.03
Average latency (ms) – 37.40
Graphical representation of OLTP READ-WRITE transactions performance in TokuDB, RocksDB and InnoDB:
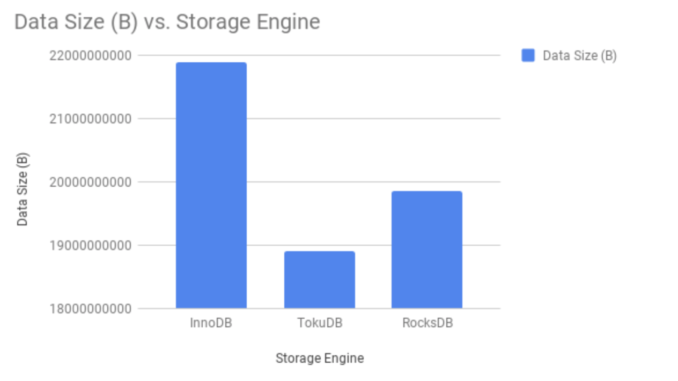
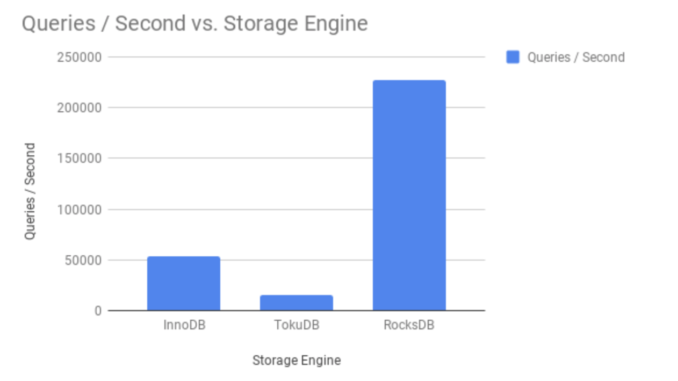
Conclusion
The results of benchmarking concluded RocksDB the most ideal candidate for SSD based storage infrastructure compared to InnoDB and TokuDB, The most compelling reasons for using RocksDB on SSD are performance, storage efficiency/compression and much smaller write amplification compared to InnoDB or TokuDB.
The post Comparing TokuDB, RocksDB and InnoDB Performance on Intel(R) Xeon(R) Gold 6140 CPU appeared first on The WebScale Database Infrastructure Operations Experts.
]]>The post A friendly comparison of InnoDB and MyRocks Performance appeared first on The WebScale Database Infrastructure Operations Experts.
]]>How InnoDB and MyRocks are different ?
- MyRocks supports only READ-COMMITTED isolation level, There is no REPEATABLE-READ isolation level like InnoDB so no gap locking like InnoDB, We have written detailed blog on InnoDB transaction isolation levels here
- To get an verbose information about MyRocks instance, the log is located in ” /var/lib/mysql/#rocksdb ” . Much more detailed story about your RocksDB diagnostics report can be generated with the command SHOW ENGINE ROCKSDB STATUS , It really takes good amount of time to understand and interpret MyRocks operations matrices.
- In MyRocks, you have rocksdb_block_cache_size system variable which is somewhat similar to innodb_buffer_pool_size but It’s mainly beneficial for reads. By default it uses buffered reads and OS cache contains cached compressed data and RockDB block cache will contain uncompressed data. You can have two levels of cache or disable buffering by forcing block cache to use direct reads with configuration rocksdb_use_direct_reads=ON.
- LSM Data Structure – MyRocks is not an alternative or advanced version of InnoDB, LSM data structure is great for write-intensive database operations, reads will be slow and full table scans are too expensive. so InnoDB and RocksDB together makes an great combination !
Benchmarking InnoDB and MyRocks performance with sysbench 1.0.14 for OLTP operations
Linux – CentOS Linux release 7.3.1611 (Core)
Database infrastructure – MariaDB 10.3.7
Building database infrastructure for benchmarking
We have used “oltp_common.lua” script to create database infrastructure for benchmarking InnoDB and MyRocks, We have not tuned both InnoDB and MyRocks variables for performance. The script below creates database for benchmarking:
[root@localhost sysbench]#
[root@localhost sysbench]# sysbench bulk_insert.lua  --threads=1 --db-driver=mysql --mysql-db=test --mysql-socket=/var/lib/mysql/mysql.sock --mysql-user=root --mysql-password=MyPassword2018  --mysql-storage-engine=rocksdb prepare
sysbench 1.0.14 (using bundled LuaJIT 2.1.0-beta2)

Creating table 'sbtest1'...
[root@localhost sysbench]#
Benchmarking bulk INSERT performance on InnoDB and MyRocks
Benchmarking OLTP insert on InnoDB using “oltp_insert.lua”
Script to create data (5M records) for benchmarking OLTP INSERT performance:
[root@localhost sysbench]# sysbench oltp_insert.lua --threads=100 --time=180 --table-size=5000000  --db-driver=mysql --mysql-db=test --mysql-socket=/var/lib/mysql/mysql.sock --mysql-user=root --mysql-password=MyPassword2018 prepare
sysbench 1.0.14 (using bundled LuaJIT 2.1.0-beta2)

Initializing worker threads...

Creating table 'sbtest1'...
Inserting 5000000 records into 'sbtest1'
Creating a secondary index on 'sbtest1'...
[root@localhost sysbench]#
MariaDB [test]> show table status like 'sbtest1'\G;
*************************** 1. row ***************************
            Name: sbtest1
          Engine: InnoDB
         Version: 10
      Row_format: Dynamic
            Rows: 5404891
  Avg_row_length: 265
     Data_length: 1433403392
 Max_data_length: 0
    Index_length: 157024256
       Data_free: 4194304
  Auto_increment: 5696281
     Create_time: 2018-06-03 12:48:12
     Update_time: 2018-06-03 12:52:03
      Check_time: NULL
       Collation: latin1_swedish_ci
        Checksum: NULL
  Create_options:
         Comment:
Max_index_length: 0
       Temporary: N
1 row in set (0.000 sec)

ERROR: No query specified

MariaDB [test]>
Script for benchmarking InnoDB OLTP INSERT performance:
[root@localhost sysbench]# sysbench oltp_insert.lua --threads=100 --time=180 --table-size=5000000  --db-driver=mysql --mysql-db=test --mysql-socket=/var/lib/mysql/mysql.sock --mysql-user=root --mysql-password=MyPassword2018 run
sysbench 1.0.14 (using bundled LuaJIT 2.1.0-beta2)

Running the test with following options:
Number of threads: 100
Initializing random number generator from current time


Initializing worker threads...

Threads started!

SQL statistics:
    queries performed:
        read:                            0
        write:                           696280
        other:                           0
        total:                           696280
    transactions:                        696280 (3866.32 per sec.)
    queries:                             696280 (3866.32 per sec.)
    ignored errors:                      0      (0.00 per sec.)
    reconnects:                          0      (0.00 per sec.)

General statistics:
    total time:                          180.0872s
    total number of events:              696280

Latency (ms):
         min:                                    0.62
         avg:                                   25.85
         max:                                  358.63
         95th percentile:                       81.48
         sum:                             17998504.11

Threads fairness:
    events (avg/stddev):           6962.8000/57.61
    execution time (avg/stddev):   179.9850/0.04
What we look for seriously in this benchmarking is QPS (queries per seconds) , In the test above it is 3866 QPS
Benchmarking MyRocks INSERT performance using Sysbench 1.0.14:
The steps are same, except for explicitly mentioning the storage engine RocksDB in sysbench scripts: “–mysql-storage-engine=rocksdb”
Script for benchmarking OLTP insert on MyRocks using “oltp_insert.lua” :
[root@localhost sysbench]# sysbench oltp_insert.lua --threads=100 --time=180 --table-size=5000000  --db-driver=mysql --mysql-db=test --mysql-socket=/var/lib/mysql/mysql.sock --mysql-user=root --mysql-password=MyPassword2018 --mysql-storage-engine=rocksdb prepare
sysbench 1.0.14 (using bundled LuaJIT 2.1.0-beta2)

Initializing worker threads...

Creating table 'sbtest1'...
Inserting 5000000 records into 'sbtest1'
Creating a secondary index on 'sbtest1'...
[root@localhost sysbench]#
MariaDB [test]> show table status like 'sbtest1%'\G;
*************************** 1. row ***************************
            Name: sbtest1
          Engine: ROCKSDB
         Version: 10
      Row_format: Fixed
            Rows: 5000000
  Avg_row_length: 198
     Data_length: 992949774
 Max_data_length: 0
    Index_length: 38739880
       Data_free: 0
  Auto_increment: 5000001
     Create_time: NULL
     Update_time: NULL
      Check_time: NULL
       Collation: latin1_swedish_ci
        Checksum: NULL
  Create_options:
         Comment:
Max_index_length: 0
       Temporary: N
1 row in set (0.007 sec)

ERROR: No query specified

MariaDB [test]>
Script for benchmarking RocksDB OLTP INSERT performance:
[root@localhost sysbench]# sysbench oltp_insert.lua --threads=100 --time=180 --table-size=5000000  --db-driver=mysql --mysql-db=test --mysql-socket=/var/lib/mysql/mysql.sock --mysql-user=root --mysql-password=MyPassword2018 --mysql-storage-engine=rocksdb run
sysbench 1.0.14 (using bundled LuaJIT 2.1.0-beta2)

Running the test with following options:
Number of threads: 100
Initializing random number generator from current time


Initializing worker threads...

Threads started!

SQL statistics:
    queries performed:
        read:                            0
        write:                           123049
        other:                           0
        total:                           123049
    transactions:                        123049 (683.37 per sec.)
    queries:                             123049 (683.37 per sec.)
    ignored errors:                      0      (0.00 per sec.)
    reconnects:                          0      (0.00 per sec.)

General statistics:
    total time:                          180.0618s
    total number of events:              123049

Latency (ms):
         min:                                    1.03
         avg:                                  146.30
         max:                                 1675.09
         95th percentile:                      308.84
         sum:                             18001689.44

Threads fairness:
    events (avg/stddev):           1230.4900/26.26
    execution time (avg/stddev):   180.0169/0.02

[root@localhost sysbench]#
Result: OLTP INSERT performance for RocksDB is 683 QPS (queries per second)
The graphical representation of more interesting performance benchmarking results on multiple bulk INSERT transactions scenarios:
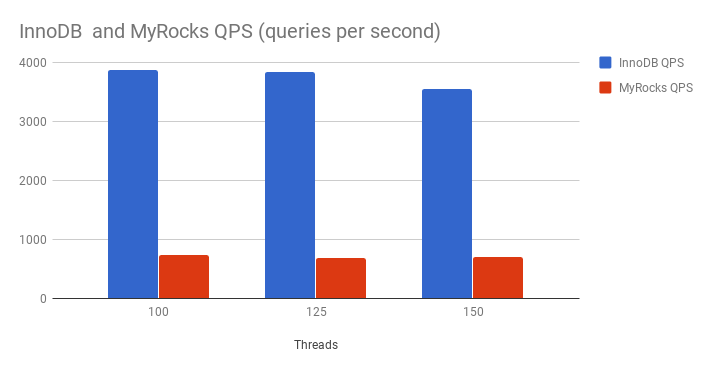
Conclusion
OLTP INSERT performance benchmarking clearly proves InnoDB is almost 6X faster than MyRocks. So MyRocks is not recommended for bulk INSERT transactions !
OLTP WRITE only transactions performance benchmarking for InnoDB and MyRocks
OLTP WRITE only performance benchmarking for InnoDB using “oltp_write_only.lua”
The steps remains same for “oltp_write_only.lua” script like “oltp_insert.lua” mentioned above, So we are directly copying the results of benchmarking without explaining details again:
[root@localhost sysbench]# sysbench oltp_write_only.lua  --threads=100  --table-size=5000000  --db-driver=mysql --mysql-db=test --mysql-socket=/var/lib/mysql/mysql.sock --mysql-user=root --mysql-password=MyPassword2018 prepare
sysbench 1.0.14 (using bundled LuaJIT 2.1.0-beta2)

Initializing worker threads...

Creating table 'sbtest1'...
Inserting 5000000 records into 'sbtest1'
Creating a secondary index on 'sbtest1'...
[root@localhost sysbench]# sysbench oltp_write_only.lua  --threads=100  --table-size=5000000  --db-driver=mysql --mysql-db=test --mysql-socket=/var/lib/mysql/mysql.sock --mysql-user=root --mysql-password=MyPassword2018 run
sysbench 1.0.14 (using bundled LuaJIT 2.1.0-beta2)

Running the test with following options:
Number of threads: 100
Initializing random number generator from current time


Initializing worker threads...

Threads started!

SQL statistics:
    queries performed:
        read:                            0
        write:                           14529
        other:                           7265
        total:                           21794
    transactions:                        3632   (355.03 per sec.)
    queries:                             21794  (2130.37 per sec.)
    ignored errors:                      1      (0.10 per sec.)
    reconnects:                          0      (0.00 per sec.)

General statistics:
    total time:                          10.2285s
    total number of events:              3632

Latency (ms):
         min:                                    1.88
         avg:                                  277.61
         max:                                 2701.56
         95th percentile:                      977.74
         sum:                              1008267.12

Threads fairness:
    events (avg/stddev):           36.3200/4.36
    execution time (avg/stddev):   10.0827/0.09
Result : 2130 QPS (queries per second)
OLTP WRITE only performance benchmarking for RocksDB using “oltp_write_only.lua”
[root@localhost sysbench]# sysbench oltp_write_only.lua  --threads=100  --table-size=5000000  --db-driver=mysql --mysql-db=test --mysql-socket=/var/lib/mysql/mysql.sock --mysql-user=root --mysql-password=MyPassword2018 --mysql-storage-engine=rocksdb prepare
sysbench 1.0.14 (using bundled LuaJIT 2.1.0-beta2)

Initializing worker threads...

Creating table 'sbtest1'...
Inserting 5000000 records into 'sbtest1'
Creating a secondary index on 'sbtest1'...
[root@localhost sysbench]# sysbench oltp_write_only.lua  --threads=100  --table-size=5000000  --db-driver=mysql --mysql-db=test --mysql-socket=/var/lib/mysql/mysql.sock --mysql-user=root --mysql-password=MyPassword2018 --mysql-storage-engine=rocksdb run
sysbench 1.0.14 (using bundled LuaJIT 2.1.0-beta2)

Running the test with following options:
Number of threads: 100
Initializing random number generator from current time


Initializing worker threads...

Threads started!

SQL statistics:
    queries performed:
        read:                            0
        write:                           25191
        other:                           12596
        total:                           37787
    transactions:                        6296   (625.73 per sec.)
    queries:                             37787  (3755.49 per sec.)
    ignored errors:                      4      (0.40 per sec.)
    reconnects:                          0      (0.00 per sec.)

General statistics:
    total time:                          10.0603s
    total number of events:              6296

Latency (ms):
         min:                                    1.39
         avg:                                  159.29
         max:                                 3620.58
         95th percentile:                      846.57
         sum:                              1002895.84

Threads fairness:
    events (avg/stddev):           62.9600/25.26
    execution time (avg/stddev):   10.0290/0.02
Result : 3755 QPS (queries per second)
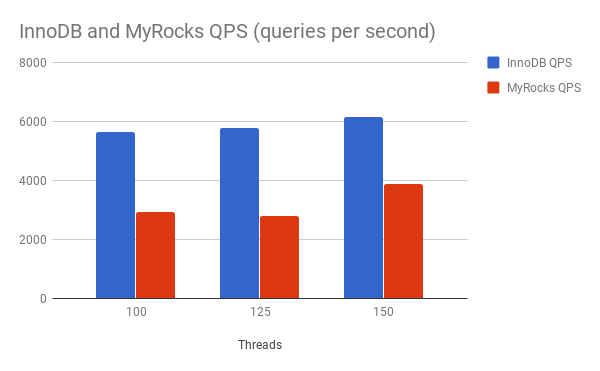
The graphical representation of more interesting performance benchmarking results on multiple WRITE only transactions scenarios:
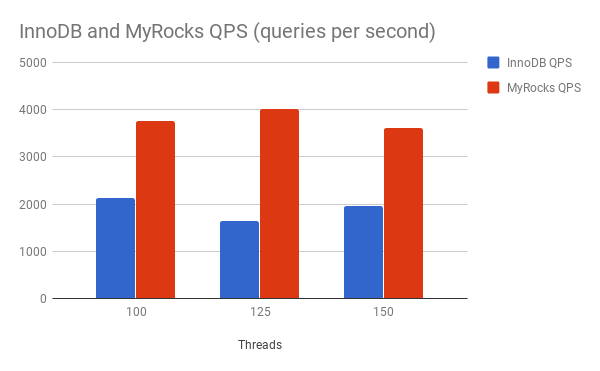
Conclusion
MyRocks OLTP write only performance is almost 2X compared to InnoDB, So MyRocks is definitely an preferred option for high performance and scalable writes, Thanks to LSM data structure !
OLTP READ-WRITE performance benchmarking using Sysbench lua script “oltp_read_write.lua”
The lua scripts below create data for OLTP READ-WRITE performance benchmarking:
Benchmarking OLTP READ-WRITE performance for InnoDB:
[root@localhost sysbench]# sysbench oltp_read_write.lua  --threads=100  --table-size=5000000  --db-driver=mysql --mysql-db=test --mysql-socket=/var/lib/mysql/mysql.sock --mysql-user=root --mysql-password=MyPassword2018 prepare
sysbench 1.0.14 (using bundled LuaJIT 2.1.0-beta2)

Initializing worker threads...

Creating table 'sbtest1'...
Inserting 5000000 records into 'sbtest1'
Creating a secondary index on 'sbtest1'...
[root@localhost sysbench]# sysbench oltp_read_write.lua  --threads=100  --table-size=5000000  --db-driver=mysql --mysql-db=test --mysql-socket=/var/lib/mysql/mysql.sock --mysql-user=root --mysql-password=MyPassword2018 run
sysbench 1.0.14 (using bundled LuaJIT 2.1.0-beta2)

Running the test with following options:
Number of threads: 100
Initializing random number generator from current time


Initializing worker threads...

Threads started!

SQL statistics:
    queries performed:
        read:                            15652
        write:                           4472
        other:                           2236
        total:                           22360
    transactions:                        1118   (105.96 per sec.)
    queries:                             22360  (2119.20 per sec.)
    ignored errors:                      0      (0.00 per sec.)
    reconnects:                          0      (0.00 per sec.)

General statistics:
    total time:                          10.5301s
    total number of events:              1118

Latency (ms):
         min:                                   15.71
         avg:                                  922.19
         max:                                 4973.09
         95th percentile:                     2009.23
         sum:                              1031006.57

Threads fairness:
    events (avg/stddev):           11.1800/1.68
    execution time (avg/stddev):   10.3101/0.13

[root@localhost sysbench]#
Result: 2119 QPS (queries per second)
Benchmarking OLTP READ-WRITE performance for RocksDB:
[root@localhost sysbench]# sysbench oltp_read_write.lua  --threads=100  --table-size=5000000  --db-driver=mysql --mysql-db=test --mysql-socket=/var/lib/mysql/mysql.sock --mysql-user=root --mysql-password=MyPassword2018 --mysql-storage-engine=rocksdb prepare
sysbench 1.0.14 (using bundled LuaJIT 2.1.0-beta2)

Initializing worker threads...

Creating table 'sbtest1'...
Inserting 5000000 records into 'sbtest1'
Creating a secondary index on 'sbtest1'...
[root@localhost sysbench]# sysbench oltp_read_write.lua  --threads=100  --table-size=5000000  --db-driver=mysql --mysql-db=test --mysql-socket=/var/lib/mysql/mysql.sock --mysql-user=root --mysql-password=MyPassword2018 --mysql-storage-engine=rocksdb run
sysbench 1.0.14 (using bundled LuaJIT 2.1.0-beta2)

Running the test with following options:
Number of threads: 100
Initializing random number generator from current time


Initializing worker threads...

Threads started!

SQL statistics:
    queries performed:
        read:                            26964
        write:                           7628
        other:                           3827
        total:                           38419
    transactions:                        1901   (182.46 per sec.)
    queries:                             38419  (3687.46 per sec.)
    ignored errors:                      25     (2.40 per sec.)
    reconnects:                          0      (0.00 per sec.)

General statistics:
    total time:                          10.4153s
    total number of events:              1901

Latency (ms):
         min:                                   11.23
         avg:                                  540.87
         max:                                 3480.91
         95th percentile:                     1352.03
         sum:                              1028196.02

Threads fairness:
    events (avg/stddev):           19.0100/2.25
    execution time (avg/stddev):   10.2820/0.10

[root@localhost sysbench]#
Result: 3687 QPS (queries per second)
The graphical representation of more interesting performance benchmarking results on multiple READ-WRITE transactions scenarios:
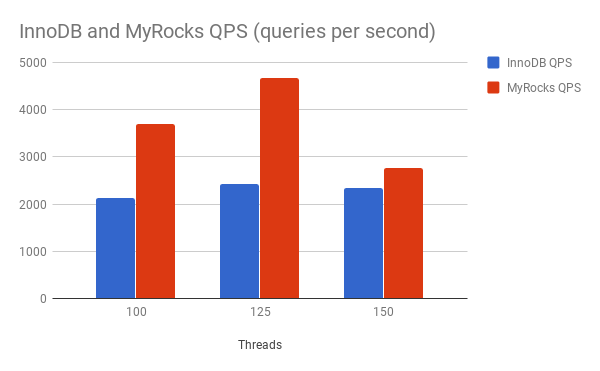
Conclusion
OLTP READ-WRITE I/O operations benchmarking results confirm MyRocks is the definite choice, May be these result vary more if we invest in tuning the InnoDB and MyRocks for performance.
Benchmarking OLTP READ ONLY operations using Sysbench oltp_read_only.lua script
OLTP READ ONLY transactions performance benchmarking for InnoDB:
[root@localhost sysbench]# sysbench oltp_read_only.lua  --threads=100  --table-size=5000000  --db-driver=mysql --mysql-db=test --mysql-socket=/var/lib/mysql/mysql.sock --mysql-user=root --mysql-password=MyPassword2018  prepare
sysbench 1.0.14 (using bundled LuaJIT 2.1.0-beta2)

Initializing worker threads...

Creating table 'sbtest1'...
Inserting 5000000 records into 'sbtest1'
Creating a secondary index on 'sbtest1'...
[root@localhost sysbench]# sysbench oltp_read_only.lua  --threads=100  --table-size=5000000  --db-driver=mysql --mysql-db=test --mysql-socket=/var/lib/mysql/mysql.sock --mysql-user=root --mysql-password=MyPassword2018  run
sysbench 1.0.14 (using bundled LuaJIT 2.1.0-beta2)

Running the test with following options:
Number of threads: 100
Initializing random number generator from current time


Initializing worker threads...

Threads started!

SQL statistics:
    queries performed:
        read:                            51072
        write:                           0
        other:                           7296
        total:                           58368
    transactions:                        3648   (352.59 per sec.)
    queries:                             58368  (5641.45 per sec.)
    ignored errors:                      0      (0.00 per sec.)
    reconnects:                          0      (0.00 per sec.)

General statistics:
    total time:                          10.3436s
    total number of events:              3648

Latency (ms):
         min:                                    1.10
         avg:                                  274.41
         max:                                 2863.46
         95th percentile:                      733.00
         sum:                              1001047.53

Threads fairness:
    events (avg/stddev):           36.4800/6.57
    execution time (avg/stddev):   10.0105/0.05
Result: 5641 QPS (queries per second)
OLTP READ ONLY transactions performance benchmarking for RocksDB:
[root@localhost sysbench]# sysbench oltp_read_only.lua  --threads=100  --table-size=5000000  --db-driver=mysql --mysql-db=test --mysql-socket=/var/lib/mysql/mysql.sock --mysql-user=root --mysql-password=MyPassword2018 --mysql-storage-engine=rocksdb prepare
sysbench 1.0.14 (using bundled LuaJIT 2.1.0-beta2)

Initializing worker threads...

Creating table 'sbtest1'...
Inserting 5000000 records into 'sbtest1'
Creating a secondary index on 'sbtest1'...
[root@localhost sysbench]# sysbench oltp_read_only.lua  --threads=100  --table-size=5000000  --db-driver=mysql --mysql-db=test --mysql-socket=/var/lib/mysql/mysql.sock --mysql-user=root --mysql-password=MyPassword2018 --mysql-storage-engine=rocksdb run
sysbench 1.0.14 (using bundled LuaJIT 2.1.0-beta2)

Running the test with following options:
Number of threads: 100
Initializing random number generator from current time


Initializing worker threads...

Threads started!

SQL statistics:
    queries performed:
        read:                            26362
        write:                           0
        other:                           3766
        total:                           30128
    transactions:                        1883   (182.77 per sec.)
    queries:                             30128  (2924.32 per sec.)
    ignored errors:                      0      (0.00 per sec.)
    reconnects:                          0      (0.00 per sec.)

General statistics:
    total time:                          10.2983s
    total number of events:              1883

Latency (ms):
         min:                                    6.20
         avg:                                  540.16
         max:                                 5258.04
         95th percentile:                     2045.74
         sum:                              1017118.10

Threads fairness:
    events (avg/stddev):           18.8300/2.29
    execution time (avg/stddev):   10.1712/0.08
Result: 2924 QPS (queries per second)
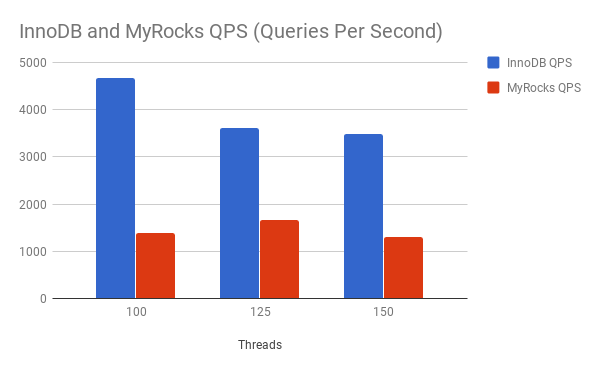
The graphical representation of more interesting performance benchmarking results on multiple READ only transactions scenarios:
Conclusion
InnoDB works great if it is OLTP READ only transactions, So we can continue recommending customers to use InnoDB for read intensive database operations.
Benchmarking OLTP DELETE ONLY operations using Sysbench oltp_delete.lua script
OLTP DELETE ONLY transactions performance benchmarking for InnoDB:
[root@localhost sysbench]# sysbench oltp_delete.lua  --threads=100  --table-size=5000000  --db-driver=mysql --mysql-db=test --mysql-socket=/var/lib/mysql/mysql.sock --mysql-user=root --mysql-password=MyPassword2018 prepare
sysbench 1.0.14 (using bundled LuaJIT 2.1.0-beta2)

Initializing worker threads...

Creating table 'sbtest1'...
Inserting 5000000 records into 'sbtest1'
Creating a secondary index on 'sbtest1'...
[root@localhost sysbench]# sysbench oltp_delete.lua  --threads=100  --table-size=5000000  --db-driver=mysql --mysql-db=test --mysql-socket=/var/lib/mysql/mysql.sock --mysql-user=root --mysql-password=MyPassword2018 run
sysbench 1.0.14 (using bundled LuaJIT 2.1.0-beta2)

Running the test with following options:
Number of threads: 100
Initializing random number generator from current time


Initializing worker threads...

Threads started!

SQL statistics:
    queries performed:
        read:                            0
        write:                           21659
        other:                           4464
        total:                           26123
    transactions:                        26123  (2521.93 per sec.)
    queries:                             26123  (2521.93 per sec.)
    ignored errors:                      0      (0.00 per sec.)
    reconnects:                          0      (0.00 per sec.)

General statistics:
    total time:                          10.3568s
    total number of events:              26123

Latency (ms):
         min:                                    0.04
         avg:                                   38.08
         max:                                 2679.06
         95th percentile:                      116.80
         sum:                               994654.43

Threads fairness:
    events (avg/stddev):           261.2300/46.27
    execution time (avg/stddev):   9.9465/0.18

[root@localhost sysbench]#
Result: 2521 QPS (queries per second)
OLTP DELETE ONLY transactions performance benchmarking for RocksDB:
[root@localhost sysbench]# sysbench oltp_delete.lua  --threads=100  --table-size=5000000  --db-driver=mysql --mysql-db=test --mysql-socket=/var/lib/mysql/mysql.sock --mysql-user=root --mysql-password=MyPassword2018 --mysql-storage-engine=rocksdb prepare
sysbench 1.0.14 (using bundled LuaJIT 2.1.0-beta2)

Initializing worker threads...

Creating table 'sbtest1'...
Inserting 5000000 records into 'sbtest1'
Creating a secondary index on 'sbtest1'...
[root@localhost sysbench]# sysbench oltp_delete.lua  --threads=100  --table-size=5000000  --db-driver=mysql --mysql-db=test --mysql-socket=/var/lib/mysql/mysql.sock --mysql-user=root --mysql-password=MyPassword2018 --mysql-storage-engine=rocksdb run
sysbench 1.0.14 (using bundled LuaJIT 2.1.0-beta2)

Running the test with following options:
Number of threads: 100
Initializing random number generator from current time


Initializing worker threads...

Threads started!

SQL statistics:
    queries performed:
        read:                            0
        write:                           7094
        other:                           421
        total:                           7515
    transactions:                        7515   (746.81 per sec.)
    queries:                             7515   (746.81 per sec.)
    ignored errors:                      0      (0.00 per sec.)
    reconnects:                          0      (0.00 per sec.)

General statistics:
    total time:                          10.0613s
    total number of events:              7515

Latency (ms):
         min:                                    0.43
         avg:                                  133.42
         max:                                 1666.25
         95th percentile:                      502.20
         sum:                              1002663.49

Threads fairness:
    events (avg/stddev):           75.1500/15.50
    execution time (avg/stddev):   10.0266/0.02
Result: 746 QPS (queries per second)
The graphical representation of more interesting performance benchmarking results on multiple DELETE only transactions scenarios:
Conclusion
InnoDB is almost 3X faster than MyRocks in OLTP DELETE operations.
InnoDB and MyRocks performance comparison :
- InnoDB is the definite choice if the transaction model is bulk INSERT, READ and DELETE intensive database operations.
- MyRocks performance is much better than InnoDB in WRITE and READ-WRITE intensive database operations.
The post A friendly comparison of InnoDB and MyRocks Performance appeared first on The WebScale Database Infrastructure Operations Experts.
]]>The post Benchmarking InnoDB and MyRocks Performance using Sysbench appeared first on The WebScale Database Infrastructure Operations Experts.
]]>Software Infrastructure we have used for this benchmarking :
MySQL 8.0 / InnoDB (no custom tuning done for performance)
[root@localhost sysbench]# cat /etc/redhat-release
CentOS Linux release 7.3.1611 (Core)
[root@localhost sysbench]#

mysql> select version();
--------------
select version()
--------------

+-----------+
| version() |
+-----------+
| 8.0.11    |
+-----------+
1 row in set (0.01 sec)
MariaDB 10.3.7 / MyRocks (no custom tuning done for performance)
[root@localhost sysbench]# cat /etc/redhat-release
CentOS Linux release 7.3.1611 (Core)
[root@localhost sysbench]#

MariaDB [(none)]> select version();
+----------------+
| version()      |
+----------------+
| 10.3.7-MariaDB |
+----------------+
1 row in set (0.008 sec)


MariaDB [(none)]> show engines\G;
*************************** 1. row ***************************
      Engine: ROCKSDB
     Support: YES
     Comment: RocksDB storage engine
Transactions: YES
          XA: YES
  Savepoints: YES
*************************** 2. row ***************************
      Engine: CSV
     Support: YES
     Comment: CSV storage engine
Transactions: NO
          XA: NO
  Savepoints: NO
*************************** 3. row ***************************
      Engine: MRG_MyISAM
     Support: YES
     Comment: Collection of identical MyISAM tables
Transactions: NO
          XA: NO
  Savepoints: NO
*************************** 4. row ***************************
      Engine: MEMORY
     Support: YES
     Comment: Hash based, stored in memory, useful for temporary tables
Transactions: NO
          XA: NO
  Savepoints: NO
*************************** 5. row ***************************
      Engine: Aria
     Support: YES
     Comment: Crash-safe tables with MyISAM heritage
Transactions: NO
          XA: NO
  Savepoints: NO
*************************** 6. row ***************************
      Engine: MyISAM
     Support: YES
     Comment: MyISAM storage engine
Transactions: NO
          XA: NO
  Savepoints: NO
*************************** 7. row ***************************
      Engine: PERFORMANCE_SCHEMA
     Support: YES
     Comment: Performance Schema
Transactions: NO
          XA: NO
  Savepoints: NO
*************************** 8. row ***************************
      Engine: InnoDB
     Support: DEFAULT
     Comment: Supports transactions, row-level locking, foreign keys and encryption for tables
Transactions: YES
          XA: YES
  Savepoints: YES
*************************** 9. row ***************************
      Engine: SEQUENCE
     Support: YES
     Comment: Generated tables filled with sequential values
Transactions: YES
          XA: NO
  Savepoints: YES
9 rows in set (0.000 sec)

ERROR: No query specified
Benchmarking InnoDB using Sysbench 1.0.14
Using Sysbench to create data in both InnoDB and MyRocks:
InnoDB
[root@localhost sysbench]# sysbench /usr/share/sysbench/oltp_point_select.lua --table-size=5000000 --threads=1 --rand-type=uniform --db-driver=mysql --mysql-db=test --mysql-socket=/var/lib/mysql/mysql.sock --mysql-user=root --mysql-password=MyPassword@2018  prepare
sysbench 1.0.14 (using bundled LuaJIT 2.1.0-beta2)

Creating table 'sbtest1'...
Inserting 5000000 records into 'sbtest1'
Creating a secondary index on 'sbtest1'...


mysql> show table status like 'sbtest1'\G;
*************************** 1. row ***************************
           Name: sbtest1
         Engine: InnoDB
        Version: 10
     Row_format: Dynamic
           Rows: 4823512
 Avg_row_length: 211
    Data_length: 1019215872
Max_data_length: 0
   Index_length: 0
      Data_free: 3145728
 Auto_increment: 5000001
    Create_time: 2018-06-01 13:31:20
    Update_time: 2018-06-01 13:31:20
     Check_time: NULL
      Collation: utf8mb4_0900_ai_ci
       Checksum: NULL
 Create_options:
        Comment:
1 row in set (0.09 sec)

ERROR:
No query specified
RocksDB
** We have explicitly mentioned “–mysql_storage_engine=rocksdb ” with Sysbench script
[root@localhost sysbench]# sysbench /usr/share/sysbench/oltp_point_select.lua --table-size=5000000 --threads=1 --rand-type=uniform --db-driver=mysql --mysql-db=test --mysql-socket=/var/lib/mysql/mysql.sock --mysql-user=root --mysql-password=MyPassword@2018 --mysql_storage_engine=rocksdb prepare
sysbench 1.0.14 (using bundled LuaJIT 2.1.0-beta2)

Creating table 'sbtest1'...
Inserting 5000000 records into 'sbtest1'
Creating a secondary index on 'sbtest1'...
[root@localhost sysbench]#

MariaDB [test]> show table status like 'sbtest1'\G;
*************************** 1. row ***************************
            Name: sbtest1
          Engine: ROCKSDB
         Version: 10
      Row_format: Fixed
            Rows: 5000000
  Avg_row_length: 198
     Data_length: 993119895
 Max_data_length: 0
    Index_length: 44910893
       Data_free: 0
  Auto_increment: 5000001
     Create_time: NULL
     Update_time: NULL
      Check_time: NULL
       Collation: latin1_swedish_ci
        Checksum: NULL
  Create_options:
         Comment:
Max_index_length: 0
       Temporary: N
1 row in set (0.009 sec)

ERROR: No query specified
Benchmarking InnoDB
[root@localhost sysbench]# sysbench /usr/share/sysbench/oltp_point_select.lua --table-size=5000000 --threads=100 --time=180 --rand-type=uniform --db-driver=mysql --mysql-db=test --mysql-socket=/var/lib/mysql/mysql.sock --mysql-user=root --mysql-password=MyPassword@2018  run
sysbench 1.0.14 (using bundled LuaJIT 2.1.0-beta2)

Running the test with following options:
Number of threads: 100
Initializing random number generator from current time


Initializing worker threads...

Threads started!

SQL statistics:
    queries performed:
        read:                            839690
        write:                           0
        other:                           0
        total:                           839690
    transactions:                        839690 (4660.85 per sec.)
    queries:                             839690 (4660.85 per sec.)
    ignored errors:                      0      (0.00 per sec.)
    reconnects:                          0      (0.00 per sec.)

General statistics:
    total time:                          180.1567s
    total number of events:              839690

Latency (ms):
         min:                                    0.05
         avg:                                   21.43
         max:                                 1777.14
         95th percentile:                       61.08
         sum:                             17998514.31

Threads fairness:
    events (avg/stddev):           8396.9000/100.67
    execution time (avg/stddev):   179.9851/0.04
Benchmarking MyRocks
[root@localhost sysbench]# sysbench /usr/share/sysbench/oltp_point_select.lua --table-size=5000000 --threads=100 --rand-type=uniform --time=180  --db-driver=mysql --mysql-db=test --mysql-socket=/var/lib/mysql/mysql.sock --mysql-user=root --mysql-password=MyPassword@2018 --mysql_storage_engine=rocksdb run
sysbench 1.0.14 (using bundled LuaJIT 2.1.0-beta2)

Running the test with following options:
Number of threads: 100
Initializing random number generator from current time


Initializing worker threads...

Threads started!

SQL statistics:
    queries performed:
        read:                            250051
        write:                           0
        other:                           0
        total:                           250051
    transactions:                        250051 (1383.08 per sec.)
    queries:                             250051 (1383.08 per sec.)
    ignored errors:                      0      (0.00 per sec.)
    reconnects:                          0      (0.00 per sec.)

General statistics:
    total time:                          180.7783s
    total number of events:              250051

Latency (ms):
         min:                                    0.32
         avg:                                   72.00
         max:                                 2368.31
         95th percentile:                      267.41
         sum:                             18003094.85

Threads fairness:
    events (avg/stddev):           2500.5100/129.62
    execution time (avg/stddev):   180.0309/0.17
How can we summarize the benchmarking of InnoDB (MySQL 8.0) and MyRocks (MariaDB 10.3.7) ?
Conclusion
InnoDB (MySQL 8.0) performance results are impressive compared to MyRocks (MariaDB 10.3.7), We love MyRocks and confident about their advancements in performance and scalability going forward.. This benchmarking is not conducted to prove MySQL better, We love technology (not biased to any business / individuals) and passionate about conducting research on database performance.
The post Benchmarking InnoDB and MyRocks Performance using Sysbench appeared first on The WebScale Database Infrastructure Operations Experts.
]]>